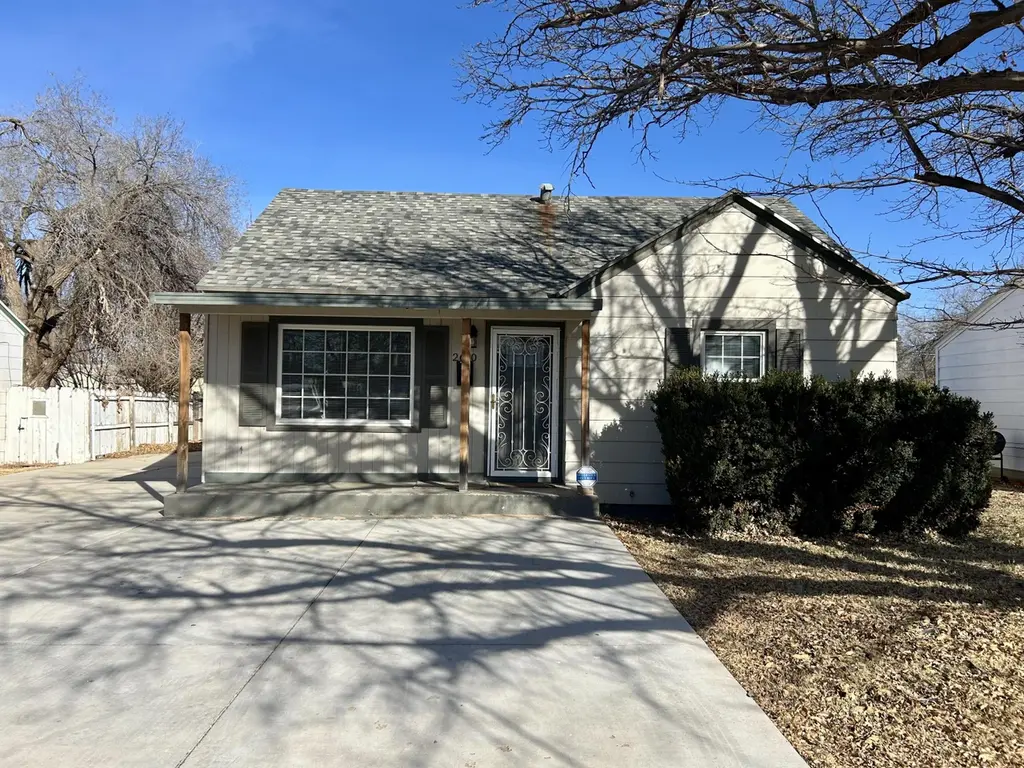
2610 36th St · Lubbock, TX
Flood risk 1/10 · Minimal
- FEMA flood zone
- X (unshaded)
- Chance of flooding over 30 yrs
- 0.0%
- Est. flood insurance / yr
- $507 – $1,088
Fire risk 1/10 · Minimal
- Est. fire insurance / yr
- $1,222 – $2,270
Heat risk 5/10 · Moderate
- Hot days now (above 99°F)
- 7 days/yr
- Hot days in 30 yrs
- 21 days/yr
Wind risk 2/10 · Minimal
- Chance of severe wind over 30 yrs
- —
Air-quality risk 2/10 · Minimal
- Unhealthy air days now
- 1 days/yr
- Unhealthy air days in 30 yrs
- 1 days/yr
Risk factors via First Street. Map © Google.
Why this score? — see what drove the D- grade
The composite is a weighted blend of 9 inputs, each scored 0–100. Each bar is that input's sub-score; the figure is the points it added to the 100-point composite (weight × sub-score).
- Cash flow +15.9/30.0
- DSCR +4.9/10.0
- 1% rule +4.3/10.0
- Livability +4.0/5.0
- Schools +3.1/10.0
- Rent growth +3.0/5.0
- Condition / age +2.5/5.0
- ARV discount +0.4/15.0
- Appreciation +0.0/10.0
$145,000
🖨 Deal sheet (PDF) 📄 Offer letter ✓ Due diligence
Listing remarks MLS
Looking for a property near Tech? Look no further. This home is great for a first time home buyer or investor. The home boasts three bedrooms, two bathrooms, and a large backyard. The fence has been installed over the last few years, and new concrete has been poured to extend the driveway! Call and set up a private tour today!
Key facts
- Hardwood flooring
- Large driveway
- High fencing
Tags
Property features AI
Exterior
- Parking: Off-street parking
- Security: Smoke detectors; Carbon monoxide detectors
- Utilities: Public water
- Home design: Single-family residence; One story; Residential property
- Construction: Metal siding and vinyl siding; Slab foundation; Composition roof; Built as 1-story
- Exterior features: Fenced yard; Paved road access
Interior
- Bathrooms: 2 full bathrooms
- Heating & cooling: Central heating (electric); Central air conditioning (electric); Ceiling fan(s)
- Interior features: Ceiling fans; Granite counters
Neighborhood map
What this means for you Summary
Snapshot
- This is a 3-bed/2.0-bath single-family listed at $145k.
Deal economics
- At list price, monthly cash flow is $69 ($825/yr) — positive.
- The deal already cash-flows at list — no discount required.
- To meet the 1% rule (rent ≥ 1% of price), the offer needs to be $134k (7.5% below list).
- Recommended offer: $134k (7.5% below list) — sets the bar for 1% rule.
Location & tenants
- Location reads 80/100 on livability (#37 in TX, #1,749 nationally) — a professional / high-income tenant draw. Strengths: commute A+, cost of living A+, housing A+; Watch: employment C-, crime F.
- Lubbock ISD (urban): math 36% / reading 39% proficiency, ranked #481 of 826 in TX (top 58%) — families likely to look elsewhere, expect single-tenant / working-renter base with shorter leases; 60% free/reduced lunch — lower-income household profile, screen leases tightly.
- Zoned schools: Wheelock El (math 32% / reading 32%, grade F, #2,268 of 4,322 statewide, top 55%, 323 students, 92% FRL); Slaton Middle (math 13% / reading 16%, grade F, #1,583 of 1,662 statewide, top 96%, 355 students, 96% FRL); Monterey H S (math 28% / reading 37%, grade F, #1,029 of 1,632 statewide, top 64%, 2,114 students, 72% FRL) — zoned schools average 86% FRL vs 60% district-wide (26 pts higher); higher-poverty schools than district average — tighter screening recommended.
- Market conditions: Rents rising (+1.9%/yr); 187 active listings in the ZIP; 40 comparable units currently listed for rent nearby; rentals at typical pace (median 23d on market — plan ~3-4 weeks tenant-placement turnaround); 42% of comp listings sitting > 30 days — soft ceiling on asking rent; 2,219 units permitted in Lubbock County in 2024 (252 in 5+ unit buildings).
Forward outlook
- Local home prices are declining (-3.0%/yr); year-one equity from $1k of loan paydown is wiped out by about $4k of value loss. Plan a longer hold.
- Lubbock County population projected at +39% by 2050 — long-run rental-demand tailwind backs the buy-and-hold thesis.
Negotiation context
- Only 13 days on market — expect competitive offers; lowballing is unlikely to land.
- 4 sale attempts since 9y ago with the ask held roughly flat each time — persistent listings suggest the price (not the market) is what's stuck; bring a comps-based counter.
Risks & watch-outs
- Watch-outs: built in 1952 — expect roof / HVAC / electrical / plumbing capex.
- Climate carrying-cost: extreme-heat days projected 7→21/yr by 2055 (HVAC capex compounding) — expect insurance premiums to compound above CPI over the hold.
Questions for the listing agent
- Built in 1952 — when were the roof, HVAC, electrical panel, plumbing, and water heater last replaced?
- Is there a deadline driving the sale (1031 exchange, divorce, estate, relocation)? That informs how much negotiation room exists.
- Schools are D-rated, which usually means shorter tenancies and higher turnover. Who's the typical renter profile here, and what's been the actual vacancy rate?
- Crime grade is F in this area — have there been break-ins, vandalism, or insurance claims at this property in the last 3 years? What carrier currently insures it and at what premium?
- The area grade is low — what's the realistic commute time and amenity access for the typical tenant pool here? Any planned neighborhood developments (good or bad) we should know about?
- What's the average days-on-market for RENTAL listings here right now (not sales)? A rising rental-DOM trend means longer vacancies and softer asking-rent achievability than the comps imply.
- What's the recent tenant-quality profile in this submarket — average credit score on applications, eviction rate, late-payment / NSF rate, and stable-employment percentage? A property-management company in the area should have these aggregated.
- How much new for-sale + rental construction is in the pipeline within 1–3 miles? Heavy new supply typically softens prices + rents 12–24 months out; constrained supply supports both.
Investment metrics
- 1% rule
- 0.93% ✗
- Cap rate
- 6.86%
- Cash-on-cash
- 2.03%
- DSCR
- 1.09
- GRM
- 9.0
CMA / ARV
- ARV (median comp)
- $125,237
- List price
- $145,000
- Delta
- 15.78%
- Verdict
- OVERPRICED
- Comps
- 2 within 1.0 mi
Projected returns pro-forma
-3.0% appreciation · 1.94% rent growth · sell at horizon
- IRR
- -14.3%
- Equity multiple
- 0.49×
- Total profit
- $-20,521
- Equity at exit
- $21,620
- IRR
- -7.3%
- Equity multiple
- 0.56×
- Total profit
- $-17,864
- Equity at exit
- $12,537
Cash invested: $40,600 (down + closing). Projections, not guarantees.
Landlord ↔ Tenant lean methodology
- Overall (STATE)
- 87 Strongly Landlord-Friendly
- State Texas
- 87 Strongly Landlord-Friendly · R+5
- County
- — inherits STATE
- City
- — inherits STATE
ZIP-level market 79413
- Rents YoY
- 1.9%
- Active inventory
- 187
- Price-to-rent
- 9.0×
Monthly cashflow live
- Estimated rent
- $1,342 high interval (Pro) →
- Mortgage (P&I)
- −$760
- Tax from tax record
- −$170 /mo · $2,046/yr
- Insurance
- −$60
- HOA
- −$0
- Vacancy / Maint / Mgmt
- −$282
- Net cashflow
- $69
Break-even live
Sensitivity live
| Price | -10% $151 | -5% $110 | +0% $69 | +5% $28 | +10% $-13 |
|---|---|---|---|---|---|
| Rent | -10% $-37 | -5% $16 | +0% $69 | +5% $122 | +10% $175 |
| Rate | -1.0pp $142 | -0.5pp $106 | base $69 | +0.5pp $31 | +1.0pp $-7 |
UW: 25.0% down · 7.5% · 30yr · 1.5% tax · 5.0% vac · 8.0% maint · 8.0% mgmt
Financing live
Cash to close
- Down payment
- $36,250
- Closing costs
- $4,350
- Reserves months
- —
- Total cash needed
- —
Loan-product check · same deal, 3 products live
Conventional
25% down · 7.5% · 30yr
- Down + closing
- —
- Monthly P&I
- —
- Monthly cashflow
- —
- DSCR
- —
- Eligible?
- —
Personal DTI + credit; lowest rate.
DSCR
20% down · 8.5% · 30yr
- Down + closing
- —
- Monthly P&I
- —
- Monthly cashflow
- —
- DSCR
- —
- Eligible?
- —
No personal income docs; deal must DSCR.
Hard money
10% down · 12.0% · 12mo
- Down + closing
- —
- Monthly P&I
- —
- Monthly cashflow
- —
- DSCR
- —
- Eligible?
- —
Short-term bridge; refi at stabilization.
Rent comps 40 comps
| Address | Beds | Baths | Sqft | Rent | $/sqft | DOM | Units | Dist |
|---|---|---|---|---|---|---|---|---|
| 2701 36th St Lubbock, TX | 2.0 | 1.0 | 802 | $1,195 | $1.49 | 15d | 1 | 0.07mi |
| 2616 37th St Lubbock, TX | 2.0 | 1.0 | 950 | $1,200 | $1.26 | 23d | 1 | 0.08mi |
| 2712 37th St Lubbock, TX | 3.0 | 1.0 | 1136 | $1,300 | $1.14 | 45d | 1 | 0.13mi |
| 2723 36th St Lubbock, TX | 2.0 | 1.0 | 802 | $950 | $1.18 | 23d | 1 | 0.17mi |
| 2508 37th St Lubbock, TX | 3.0 | 2.5 | 1495 | $1,700 | $1.14 | 45d | 1 | 0.18mi |
| 2801 36th St Lubbock, TX | 3.0 | 2.0 | 1446 | $2,700 | $1.87 | 45d | 1 | 0.18mi |
| 2506 37th St Lubbock, TX | 3.0 | 1.0 | 1053 | $1,550 | $1.47 | 23d | 1 | 0.19mi |
| 2408 35th St Lubbock, TX | 2.0 | 1.0 | 1072 | $995 | $0.93 | 23d | 1 | 0.29mi |
| 2823 33rd St Lubbock, TX | 3.0 | 1.0 | 1105 | $950 | $0.86 | 45d | 1 | 0.31mi |
| 2521 40th St Lubbock, TX | 2.0 | 1.0 | 902 | $1,195 | $1.32 | 23d | 1 | 0.31mi |
| 2420 33rd St Lubbock, TX | 2.0 | 1.0 | 800 | $799 | $1.00 | 23d | 1 | 0.32mi |
| 2613 30th St Lubbock, TX | 3.0 | 2.0 | 1472 | $1,500 | $1.02 | 45d | 1 | 0.34mi |
| 2609 41st St Lubbock, TX | 3.0 | 2.0 | 1469 | $1,550 | $1.06 | 23d | 1 | 0.36mi |
| 2605 41st St Lubbock, TX | 2.0 | 1.0 | 882 | $995 | $1.13 | 15d | 1 | 0.36mi |
| 2521 41st St Lubbock, TX | 2.0 | 1.0 | 990 | $925 | $0.93 | 45d | 1 | 0.37mi |
| 2816 40th St Lubbock, TX | 2.0 | 1.0 | 826 | $825 | $1.00 | 23d | 1 | 0.38mi |
| 2419 31st St Apt B Lubbock, TX | 2.0 | 1.0 | 878 | $795 | $0.91 | 15d | 1 | 0.39mi |
| 3007 32nd St Lubbock, TX | 3.0 | 1.0 | 1353 | $1,325 | $0.98 | 23d | 1 | 0.40mi |
| 2514 42nd St Lubbock, TX | 3.0 | 1.0 | 943 | $950 | $1.01 | 15d | 1 | 0.42mi |
| 2411 31st St Lubbock, TX | 3.0 | 1.0 | 1003 | $1,000 | $1.00 | 23d | 1 | 0.43mi |
| 3101 33rd St Lubbock, TX | 3.0 | 3.0 | 1250 | $999 | $0.80 | 45d | 1 | 0.45mi |
| 2420 30th St Lubbock, TX | 2.0 | 1.0 | 1092 | $1,100 | $1.01 | 23d | 1 | 0.47mi |
| 2315 32nd St Lubbock, TX | 2.0 | 1.0 | 900 | $995 | $1.11 | 23d | 1 | 0.47mi |
| 3107 37th St Lubbock, TX | 2.0 | 1.0 | 750 | $1,095 | $1.46 | 23d | 1 | 0.48mi |
| 2217 36th St Lubbock, TX | 3.0 | 1.0 | 1284 | $1,109 | $0.86 | 15d | 1 | 0.48mi |
| 2304 39th St Lubbock, TX | 2.0 | 1.0 | 830 | $1,150 | $1.39 | 23d | 1 | 0.48mi |
| 2602 28th St Lubbock, TX | 2.0 | 1.0 | 937 | $1,095 | $1.17 | 23d | 1 | 0.49mi |
| 2513 43rd St Lubbock, TX | 2.0 | 1.0 | 912 | $1,150 | $1.26 | 15d | 1 | 0.50mi |
| 2513 43rd St Lubbock, TX | 2.0 | 1.0 | 912 | $1,150 | $1.26 | 45d | 1 | 0.50mi |
| 3114 37th St Lubbock, TX | 3.0 | 1.0 | 988 | $1,095 | $1.11 | 45d | 1 | 0.51mi |
| 2302 40th St Lubbock, TX | 2.0 | 1.0 | 793 | $749 | $0.94 | 23d | 1 | 0.52mi |
| 3016 30th St Lubbock, TX | 2.0 | 1.0 | 947 | $975 | $1.03 | 45d | 1 | 0.53mi |
| 2812 43rd St Unit 6 Lubbock, TX | 2.0 | 1.0 | 1104 | $700 | $0.63 | 45d | 1 | 0.54mi |
| 2812 43rd St Unit 7 Lubbock, TX | 2.0 | 1.0 | 1104 | $750 | $0.68 | 23d | 1 | 0.54mi |
| 3126 38th St Lubbock, TX | 2.0 | 1.0 | 1248 | $1,195 | $0.96 | 45d | 1 | 0.54mi |
| 3116 33rd St Lubbock, TX | 2.0 | 1.0 | 912 | $1,195 | $1.31 | 45d | 1 | 0.54mi |
| 2706 44th St Apt C Lubbock, TX | 2.0 | 1.0 | 900 | $680 | $0.76 | 45d | 1 | 0.55mi |
| 2208 35th St Unit B Lubbock, TX | 2.0 | 1.0 | 767 | $750 | $0.98 | 45d | 1 | 0.55mi |
| 2504 44th St Lubbock, TX | 2.0 | 1.0 | 939 | $995 | $1.06 | 45d | 1 | 0.55mi |
| 2611 44th St Lubbock, TX | 3.0 | 1.0 | 1200 | $1,395 | $1.16 | 45d | 1 | 0.55mi |
Listing history 14 events
-
2026-05-11$145,000 Active 345-char remark
-
2026-02-09historical $1,280
-
2026-01-13$1,280
-
2023-01-24soldstatus
-
2023-01-20soldstatus Closed 328-char remark
Show marketing remark (328 chars)
Looking for a property near Tech? Look no further. This home is great for a first time home buyer or investor. The home boasts three bedrooms, two bathrooms, and a large backyard. The fence has been installed over the last few years, and new concrete has been poured to extend the driveway! Call and set up a private tour today!
-
2022-12-27status Pending 328-char remark
Show marketing remark (328 chars)
Looking for a property near Tech? Look no further. This home is great for a first time home buyer or investor. The home boasts three bedrooms, two bathrooms, and a large backyard. The fence has been installed over the last few years, and new concrete has been poured to extend the driveway! Call and set up a private tour today!
-
2022-12-05$150,000 Active 328-char remark
Show marketing remark (328 chars)
Looking for a property near Tech? Look no further. This home is great for a first time home buyer or investor. The home boasts three bedrooms, two bathrooms, and a large backyard. The fence has been installed over the last few years, and new concrete has been poured to extend the driveway! Call and set up a private tour today!
-
2017-11-03soldstatus
-
2017-09-29soldstatus
-
2017-07-27soldstatus
Show marketing remark (120 chars)
Attention investors! Only blocks from tech a large 3 bed 2 bath home make this a desirable investment to your portfolio.
-
2017-07-25soldstatus
-
2017-05-22$65,000
Show marketing remark (120 chars)
Attention investors! Only blocks from tech a large 3 bed 2 bath home make this a desirable investment to your portfolio.
-
2001-06-29soldstatus
-
1983-09-01soldstatus
ⓘ Source: listings_history table (triggers on properties + properties_extension) + one-shot
backfill from property_details.listing_events for pre-trigger history.
Tax reassessment forecast TX · Resets to sale price
- Current annual tax
- $2,046 · $170/mo
- Projected year-2 tax
- $2,654 · $221/mo
- Expected delta
- +$608/yr (+$51/mo · 29.7%)
ⓘ Screening estimate from a state-policy table — verify with the county assessor before closing.
Climate risk First Street
- Flood 1/10 Low FEMA zone X (unshaded) · 0% chance over 30 yrs
- Wildfire 1/10 Low
- Heat 5/10 Major 7 d/yr ≥99°F today · 21 d/yr by 30 yrs out
- Wind 2/10 Low
- Air quality 2/10 Low 1 unhealthy d/yr today · 1 by 30 yrs out
Nearby sold comps map
Loading sold comps map…
Walkable amenities ~0.75 mi
Loading nearby amenities…
Taxation est. · year 1
- Rental income
- $16,102
- − Mortgage interest
- −$8,122
- − Property taxes
- −$2,046
- − Insurance
- −$725
- − Repairs & maintenance
- −$1,288
- − Management
- −$1,288
- − Depreciation
- −$4,218
- Taxable loss
- −$1,586
- Est. tax savings @ 24.0%
- +$381
- After-tax cash flow
- $1,205/yr
For passive investors: Depreciation is non-cash, so a rental often shows a tax loss while cash-flowing — sheltering income. Rental losses are passive: they offset passive income freely, and up to $25,000/yr can offset ordinary (W-2) income if you actively participate and your MAGI is under $100k (phasing out to $0 by $150k); unused losses carry forward. On sale, claimed depreciation is recaptured at up to 25%, and gains may owe capital-gains tax (a 1031 exchange can defer both). Figures are a year-1 estimate at your 24.0% rate — not tax advice; consult a CPA.
Schools (NCES district)
- District
- Lubbock ISD
- NCES district ID
- 4828500
- Math proficiency
- 36% ▼ -8.00%
- Reading proficiency
- 39% ▼ -1.00%
- Median HH income
- $39,820
- Composite
- 31.44/100
- National rank
- #5984
- State rank
- #481 of 826 in TX
Livability — Lubbock
- Score
- 80/100
- State rank
- #37
- US rank
- #1749
Category grades
Schools grade is shown separately in the Schools card above.
Census & demographics
- Census place
- Lubbock, TX
- County
- Lubbock County · 293,542 people
- City population
- 283,030
- Metro
- Lubbock, TX
- Population (ZIP)
- 23,343
- Household income
- $69,400
- Rent vs Own
- Severe rent burden
- 1211.0
Population outlook (Lubbock County) Hauer SSP2
- Today (2025)
- 345,960 people
- By 2030
- 371,449 · +7.4%
- By 2040
- 424,539 · +22.7%
- By 2050
- 481,150 · +39.1%
- By 2075
- 633,467 · +83.1%
- By 2100
- 746,853 · +115.9%
Race, ethnicity, and origin ACS 2023
- Neighborhood character
- Diverse neighborhood (Simpson 0.59)
- Race & ethnicity
- White 54% Hispanic / Latino 34% Two or more races 18% Black 6%
- Hispanic origin (detail)
- Mexican 25%
- Common ancestry
- Slovak 2% Italian 2% Serbian 1%
- Foreign-born
- 3% · Canada, China
- Languages at home
- 88% English-only · Spanish 10% Chinese 1%
Political lean MEDSL · Lubbock
- 2024 margin
- Solid R (+39.5) · D 29.7% · R 69.2% · Other 1.0%
- 2008→2024 swing
- -2.8pp toward R · 2008: -36.7pp · 2024: -39.5pp
- All cycles
- 2024: R+39.5 2020: R+32.2 2016: R+38.4 2012: R+40.9 2008: R+36.7
Not yet ingested
- Civics
- —
Market trends
- HPI YoY
- ▼ -145.52%
- Current HPI
- 239.8854
- Rent YoY
- ▲ 1.94%
- Metro
- Lubbock, TX
- State GDP YoY
- ▲ 3.95%
- F500 in state
- 110
Industry mix (Fortune 500 HQ in TX)
| Industry | F500 HQs | Revenue |
|---|---|---|
| Energy | 16 | $1,198B |
|
||
| Technology | 5 | $198B |
|
||
| Engineering / Construction | 4 | $72B |
|
||
| Energy Services | 3 | $60B |
|
||
| Utilities | 3 | $41B |
|
||
| Healthcare | 2 | $330B |
|
||
Price history
+123.1% since first listed15 events — show timeline
- 2026-05-26 Pending — LARMLS
- 2026-05-11 Listed $145,000 LARMLS
- 2026-02-09 Rental Removed $1,280 APPFOLIO
- 2026-01-13 Listed for Rent $1,280 APPFOLIO
- 2023-01-24 Sold (Public Records) — Public Records
- 2023-01-20 Sold (MLS) — LARMLS
- 2022-12-27 Pending — LARMLS
- 2022-12-05 Listed $150,000 LARMLS
- 2017-11-03 Sold (Public Records) — Public Records
- 2017-09-29 Sold (Public Records) — Public Records
- 2017-07-27 Sold (MLS) — LARMLS
- 2017-07-25 Sold (Public Records) — Public Records
- 2017-05-22 Listed $65,000 LARMLS
- 2001-06-29 Sold (Public Records) — Public Records
- 1983-09-01 Sold (Public Records) — Public Records
Property tax history
+4.3%/yrLatest (2025): $2,046 · -5.3% YoY. Source: county tax records.
Cash-flow waterfall
monthlySold comps — $/sqft
last 12 mo · ≤1 miLoading sold comps…