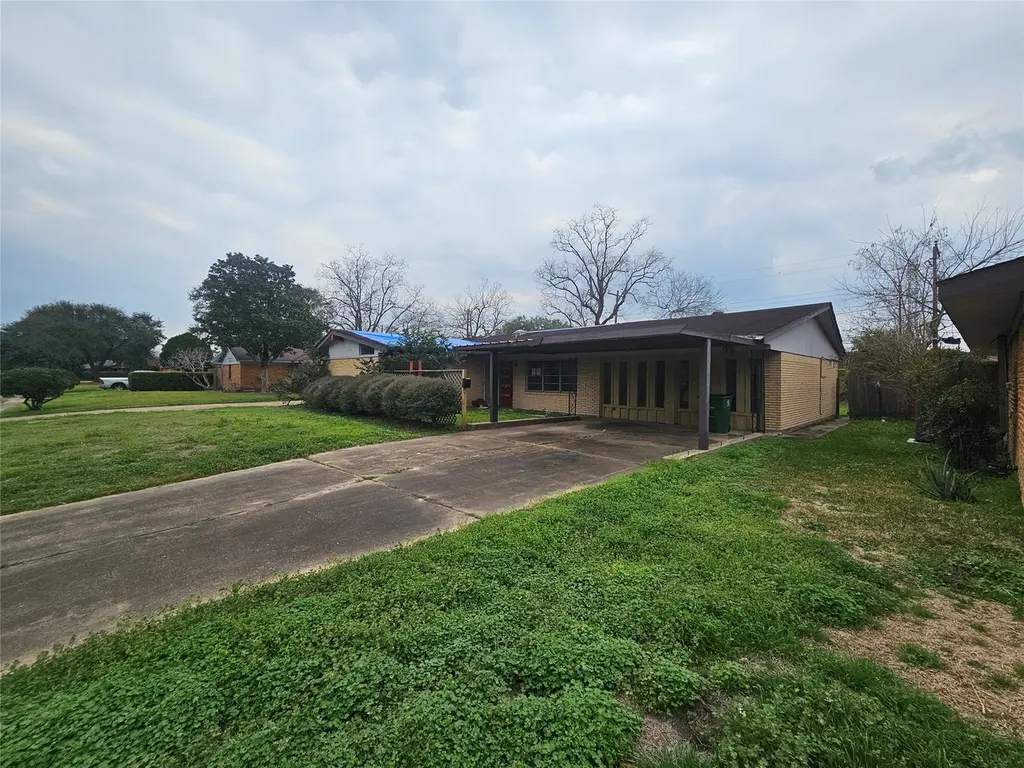
5327 Knotty Oaks Trl · Houston, TX
Flood risk 4/10 · Minor
- FEMA flood zone
- X (unshaded)
- Chance of flooding over 30 yrs
- 0.22%
- Est. flood insurance / yr
- $507 – $1,088
Fire risk 1/10 · Minimal
- Est. fire insurance / yr
- $1,222 – $2,270
Heat risk 9/10 · Severe
- Hot days now (above 110°F)
- 7 days/yr
- Hot days in 30 yrs
- 23 days/yr
Wind risk 9/10 · Severe
- Chance of severe wind over 30 yrs
- 99.0%
Air-quality risk 3/10 · Minor
- Unhealthy air days now
- 2 days/yr
- Unhealthy air days in 30 yrs
- 3 days/yr
Risk factors via First Street. Map © Google.
Why this score? — see what drove the C+ grade
The composite is a weighted blend of 9 inputs, each scored 0–100. Each bar is that input's sub-score; the figure is the points it added to the 100-point composite (weight × sub-score).
- Cash flow +22.3/30.0
- ARV discount +15.0/15.0
- 1% rule +7.3/10.0
- DSCR +7.2/10.0
- Livability +3.7/5.0
- Schools +2.7/10.0
- Condition / age +2.5/5.0
- Rent growth +1.9/5.0
- Appreciation +0.0/10.0
$165,480
🖨 Deal sheet (PDF) 📄 Offer letter ✓ Due diligence
Listing remarks MLS
Traditional 1-story home situated on a generous lot in an established neighborhood. This property offers 3 bedrooms, 2 full bathrooms, and a functional floor plan ready for customization! Interior features include a spacious living area, primary suite, and a kitchen with adjacent dining space. The house includes a porte-cochere for covered parking and additional driveway space. The backyard offers room for outdoor entertaining or future improvements, including a pool. Property is being sold AS-IS and presents an excellent opportunity for investors or buyers looking to renovate and add value. With solid bones and strong potential, this home is ideal for a fix-and-flip, rental investment, or owner-occupant renovation project.
Key facts
- Strong potential
- Solid bones
- Generous lot
Tags
Neighborhood map
What this means for you Summary
Snapshot
- This is a 4-bed/2.0-bath single-family listed at $165k.
Deal economics
- At list price, monthly cash flow is $273 ($3k/yr) — positive.
- The deal already cash-flows at list — no discount required.
- Meets the 1% rule at list price ($2k rent vs $165k).
- Recommended offer: $151k (9.0% below list) — sets the bar for market timing.
- Cap rate 8.3% vs local median 3.1% in Houston — top-decile yield for the area; either an underpriced asset or a hidden risk that comps aren't pricing in. Stress-test before assuming the spread holds.
Location & tenants
- Location reads 74/100 on livability (#184 in TX, #4,771 nationally) — a middle-class / working-renter tenant base. Strengths: amenities A+, cost of living A+, housing A+; Watch: schools D, crime F.
- Houston ISD (urban): math 27% / reading 35% proficiency, ranked #593 of 826 in TX (top 72%) — families likely to look elsewhere, expect single-tenant / working-renter base with shorter leases; 71% free/reduced lunch — lower-income household profile, screen leases tightly.
- Market conditions: Rents soft (-2.4%/yr); 135 active listings in the ZIP; 4 comparable units currently listed for rent nearby; rentals at typical pace (median 22d on market — plan ~3-4 weeks tenant-placement turnaround); 29,883 units permitted in Harris County in 2024 (8,621 in 5+ unit buildings).
- This rent runs 41% of the median local income ($60k/yr) — at the standard rent-burdened threshold; future hikes will face affordability resistance.
Forward outlook
- Local home prices are declining (-3.0%/yr); year-one equity from $1k of loan paydown is wiped out by about $5k of value loss. Plan a longer hold.
- Harris County population projected at +47% by 2050 — long-run rental-demand tailwind backs the buy-and-hold thesis.
Negotiation context
- It's been on market 109 days — a 9% lower offer ($151k) is reasonable based on typical stale-listing flexibility.
- 3 sale attempts since 2y ago; this cycle's ask has dropped $32k (16%) from the opening price — seller is motivated, your offer sets the floor, not the list.
Risks & watch-outs
- Watch-outs: property tax is 2.8% of price.
- Climate carrying-cost: severe wind risk, 99% chance of damaging wind over 30y; extreme-heat days projected 7→23/yr by 2055 (HVAC capex compounding) — expect insurance premiums to compound above CPI over the hold.
Questions for the listing agent
- It's been on market 109 days. Have you received any prior offers? Is the seller open to a 9% concession, seller financing, or rate buy-down credit?
- Built in 1960 — when were the roof, HVAC, electrical panel, plumbing, and water heater last replaced?
- Property tax is high relative to price — has the assessment been appealed recently, and will the sale trigger a re-assessment?
- Why hasn't it sold? Are there any deal-killer items the seller is aware of (foundation, flood, title, zoning, code violations)?
- Is there a deadline driving the sale (1031 exchange, divorce, estate, relocation)? That informs how much negotiation room exists.
- Schools are D-rated, which usually means shorter tenancies and higher turnover. Who's the typical renter profile here, and what's been the actual vacancy rate?
- Crime grade is F in this area — have there been break-ins, vandalism, or insurance claims at this property in the last 3 years? What carrier currently insures it and at what premium?
- What's the average days-on-market for RENTAL listings here right now (not sales)? A rising rental-DOM trend means longer vacancies and softer asking-rent achievability than the comps imply.
- What's the recent tenant-quality profile in this submarket — average credit score on applications, eviction rate, late-payment / NSF rate, and stable-employment percentage? A property-management company in the area should have these aggregated.
- How much new for-sale + rental construction is in the pipeline within 1–3 miles? Heavy new supply typically softens prices + rents 12–24 months out; constrained supply supports both.
Investment metrics
- 1% rule
- 1.23% ✓
- Cap rate
- 8.28%
- Cash-on-cash
- 7.08%
- DSCR
- 1.32
- GRM
- 6.8
CMA / ARV
- ARV (median comp)
- $237,895
- List price
- $165,480
- Delta
- -30.44%
- Verdict
- UNDERPRICED
- Comps
- 20 within 1.0 mi
Show comp detail 12 sales within ~0.75 mi
| Address | Dist | Beds/Ba | Sqft | Sold | Price | $/sf | Match |
|---|---|---|---|---|---|---|---|
| 13606 Sunrose Ln | 0.21mi | 4/2.0 | 1,920 (-12%) | 4mo | $237,000 | $123 | 67 |
| 5819 Tidewater Dr | 0.50mi | 3/2.5 (-1) | 2,260 (+4%) | 9mo | $261,000 | $115 | 56 |
| 13839 Aldaco Dr | 0.67mi | 4/2.5 | 2,270 (+4%) | 6mo | $305,000 | $134 | 55 |
| 12930 Chrysanthemum Dr | 0.40mi | 4/2.5 | 1,860 (-15%) | 1mo | $240,000 | $129 | 54 |
| 5043 Canyon Blanco Dr | 0.70mi | 4/2.5 | 2,278 (+4%) | 8mo | $275,000 | $121 | 51 |
| 6014 Pinacle Pt | 0.66mi | 3/2.5 (-1) | 2,044 (-6%) | 2mo | $264,900 | $130 | 50 |
| 5726 Coastal Way | 0.42mi | 4/2.5 | 1,910 (-12%) | 11mo | $285,000 | $149 | 48 |
| 5906 Nodaway Creek Ct | 0.74mi | 3/2.5 (-1) | 2,169 (-1%) | 12mo | $309,000 | $142 | 48 |
| 5618 Tiger Lilly Way | 0.42mi | 4/2.5 | 1,880 (-14%) | 10mo | $280,000 | $149 | 47 |
| 13915 Nitida St | 0.61mi | 4/2.0 | 1,890 (-13%) | 4mo | $199,900 | $106 | 46 |
| 12906 Yarrow Crest Ct | 0.49mi | 4/2.5 | 1,860 (-15%) | 11mo | $267,000 | $144 | 41 |
| 12842 Colony Heath Ln | 0.74mi | 4/2.5 | 2,360 (+8%) | 12mo | $333,000 | $141 | 40 |
Match score weights: distance 35% · size 25% · config 20% · recency 20%. Top-matched comps best support the ARV.
Projected returns pro-forma
-3.0% appreciation · 0.0% rent growth · sell at horizon
- IRR
- -9.3%
- Equity multiple
- 0.67×
- Total profit
- $-15,196
- Equity at exit
- $24,674
- IRR
- -5.1%
- Equity multiple
- 0.72×
- Total profit
- $-13,187
- Equity at exit
- $14,308
Cash invested: $46,334 (down + closing). Projections, not guarantees.
Landlord ↔ Tenant lean methodology
- Overall (STATE)
- 87 Strongly Landlord-Friendly
- State Texas
- 87 Strongly Landlord-Friendly · R+5
- County
- — inherits STATE
- City
- — inherits STATE
ZIP-level market 77045
- Home prices YoY
- -7.4%
- Rents YoY
- -2.4%
- Active inventory
- 135
- Price-to-rent
- 6.8×
Monthly cashflow live
- Estimated rent
- $2,028 medium interval (Pro) →
- Mortgage (P&I)
- −$868
- Tax from tax record
- −$392 /mo · $4,702/yr
- Insurance
- −$69
- HOA
- −$0
- Vacancy / Maint / Mgmt
- −$426
- Net cashflow
- $273
Break-even live
Sensitivity live
| Price | -10% $367 | -5% $320 | +0% $273 | +5% $227 | +10% $180 |
|---|---|---|---|---|---|
| Rent | -10% $113 | -5% $193 | +0% $273 | +5% $354 | +10% $434 |
| Rate | -1.0pp $357 | -0.5pp $316 | base $273 | +0.5pp $231 | +1.0pp $187 |
UW: 25.0% down · 7.5% · 30yr · 1.5% tax · 5.0% vac · 8.0% maint · 8.0% mgmt
Financing live
Cash to close
- Down payment
- $41,370
- Closing costs
- $4,964
- Reserves months
- —
- Total cash needed
- —
Loan-product check · same deal, 3 products live
Conventional
25% down · 7.5% · 30yr
- Down + closing
- —
- Monthly P&I
- —
- Monthly cashflow
- —
- DSCR
- —
- Eligible?
- —
Personal DTI + credit; lowest rate.
DSCR
20% down · 8.5% · 30yr
- Down + closing
- —
- Monthly P&I
- —
- Monthly cashflow
- —
- DSCR
- —
- Eligible?
- —
No personal income docs; deal must DSCR.
Hard money
10% down · 12.0% · 12mo
- Down + closing
- —
- Monthly P&I
- —
- Monthly cashflow
- —
- DSCR
- —
- Eligible?
- —
Short-term bridge; refi at stabilization.
Rent comps 4 comps
| Address | Beds | Baths | Sqft | Rent | $/sqft | DOM | Units | Dist |
|---|---|---|---|---|---|---|---|---|
| 6023 Heatherbrook Dr Houston, TX | 3.0 | 2.0 | 1474 | $1,899 | $1.29 | 0d | 1 | 1.10mi |
| 13003 Brentlawn Ct Houston, TX | 3.0 | 2.0 | 1731 | $1,380 | $0.80 | 14d | 1 | 1.16mi |
| 13023 Cherton Ct Houston, TX | 4.0 | 2.5 | 2751 | $2,375 | $0.86 | 22d | 1 | 1.25mi |
| 4023 Glenn Ricki Dr Houston, TX | 3.0 | 2.0 | 2605 | $1,860 | $0.71 | 21d | 1 | 1.46mi |
Listing history 23 events
-
2026-06-18days on market $165,480 Active 109 DOM
-
2026-06-17days on market $165,480 Active 108 DOM
-
2026-06-16days on market $165,480 Active 107 DOM
-
2026-06-15days on market $165,480 Active 106 DOM
-
2026-06-13statusdays on market $165,480 Active 104 DOM
-
2026-06-08statusdays on market $165,480 Pending 103 DOM
-
2026-06-07days on market $165,480 Active 102 DOM
-
2026-06-04days on market $165,480 Active 99 DOM
-
2026-06-01days on market $165,480 Active 96 DOM
-
2026-05-31days on market $165,480 Active 95 DOM
-
2026-05-18status Pending 738-char remark
Show marketing remark (738 chars)
Traditional 1-story home situated on a generous lot in an established neighborhood. This property offers 3 bedrooms, 2 full bathrooms, and a functional floor plan ready for customization! Interior features include a spacious living area, primary suite, and a kitchen with adjacent dining space. The house includes a porte-cochere for covered parking and additional driveway space. The backyard offers room for outdoor entertaining or future improvements, including a pool. Property is being sold AS-IS and presents an excellent opportunity for investors or buyers looking to renovate and add value. With solid bones and strong potential, this home is ideal for a fix-and-flip, rental investment, or owner-occupant renovation project.
-
2026-05-09price $165,480 738-char remark
Show marketing remark (738 chars)
Traditional 1-story home situated on a generous lot in an established neighborhood. This property offers 3 bedrooms, 2 full bathrooms, and a functional floor plan ready for customization! Interior features include a spacious living area, primary suite, and a kitchen with adjacent dining space. The house includes a porte-cochere for covered parking and additional driveway space. The backyard offers room for outdoor entertaining or future improvements, including a pool. Property is being sold AS-IS and presents an excellent opportunity for investors or buyers looking to renovate and add value. With solid bones and strong potential, this home is ideal for a fix-and-flip, rental investment, or owner-occupant renovation project.
-
2026-04-08price $181,240 738-char remark
Show marketing remark (738 chars)
Traditional 1-story home situated on a generous lot in an established neighborhood. This property offers 3 bedrooms, 2 full bathrooms, and a functional floor plan ready for customization! Interior features include a spacious living area, primary suite, and a kitchen with adjacent dining space. The house includes a porte-cochere for covered parking and additional driveway space. The backyard offers room for outdoor entertaining or future improvements, including a pool. Property is being sold AS-IS and presents an excellent opportunity for investors or buyers looking to renovate and add value. With solid bones and strong potential, this home is ideal for a fix-and-flip, rental investment, or owner-occupant renovation project.
-
2026-02-20$197,000 Active 738-char remark
Show marketing remark (738 chars)
Traditional 1-story home situated on a generous lot in an established neighborhood. This property offers 3 bedrooms, 2 full bathrooms, and a functional floor plan ready for customization! Interior features include a spacious living area, primary suite, and a kitchen with adjacent dining space. The house includes a porte-cochere for covered parking and additional driveway space. The backyard offers room for outdoor entertaining or future improvements, including a pool. Property is being sold AS-IS and presents an excellent opportunity for investors or buyers looking to renovate and add value. With solid bones and strong potential, this home is ideal for a fix-and-flip, rental investment, or owner-occupant renovation project.
-
2024-08-30historical
-
2024-08-19price $171,000
-
2024-08-05price $179,500
-
2024-08-05status Active
-
2024-07-29status Pending
-
2024-07-23price $185,000
-
2024-07-18price $199,000
-
2024-06-27$210,000 Active
-
1988-01-02soldstatus
ⓘ Source: listings_history table (triggers on properties + properties_extension) + one-shot
backfill from property_details.listing_events for pre-trigger history.
Tax reassessment forecast TX · Resets to sale price
- Current annual tax
- $4,702 · $392/mo
- Projected year-2 tax
- $4,702 · $392/mo
- Expected delta
- $0/yr ($0/mo · 0.0%)
ⓘ Screening estimate from a state-policy table — verify with the county assessor before closing.
Climate risk First Street
- Flood 4/10 Moderate FEMA zone X (unshaded) · 22% chance over 30 yrs
- Wildfire 1/10 Low
- Heat 9/10 Extreme 7 d/yr ≥110°F today · 23 d/yr by 30 yrs out
- Wind 9/10 Extreme 99% chance of damaging wind over 30 yrs
- Air quality 3/10 Moderate 2 unhealthy d/yr today · 3 by 30 yrs out
Nearby sold comps map
Loading sold comps map…
Walkable amenities ~0.75 mi
Loading nearby amenities…
Taxation est. · year 1
- Rental income
- $24,335
- − Mortgage interest
- −$9,269
- − Property taxes
- −$4,702
- − Insurance
- −$827
- − Repairs & maintenance
- −$1,947
- − Management
- −$1,947
- − Depreciation
- −$4,814
- Taxable income
- $828
- Est. tax owed @ 24.0%
- −$199
- After-tax cash flow
- $3,083/yr
For passive investors: Depreciation is non-cash, so a rental often shows a tax loss while cash-flowing — sheltering income. Rental losses are passive: they offset passive income freely, and up to $25,000/yr can offset ordinary (W-2) income if you actively participate and your MAGI is under $100k (phasing out to $0 by $150k); unused losses carry forward. On sale, claimed depreciation is recaptured at up to 25%, and gains may owe capital-gains tax (a 1031 exchange can defer both). Figures are a year-1 estimate at your 24.0% rate — not tax advice; consult a CPA.
Schools (NCES district)
- District
- Houston ISD
- NCES district ID
- 4823640
- Math proficiency
- 27% ▼ -18.00%
- Reading proficiency
- 35% ▼ -6.00%
- Median HH income
- $46,054
- Composite
- 26.63/100
- National rank
- #7173
- State rank
- #593 of 826 in TX
Livability — Houston
- Score
- 74/100
- State rank
- #184
- US rank
- #4771
Category grades
Schools grade is shown separately in the Schools card above.
Census & demographics
- Census place
- Houston, TX
- County
- Harris County · 4,702,590 people
- City population
- 3,226,434
- Metro
- Houston-The Woodlands-Sugar Land, TX
- Population (ZIP)
- 33,563
- Household income
- $59,688
- Rent vs Own
- Severe rent burden
- 803.0
Population outlook (Harris County) Hauer SSP2
- Today (2025)
- 5,571,493 people
- By 2030
- 6,089,821 · +9.3%
- By 2040
- 7,142,806 · +28.2%
- By 2050
- 8,185,864 · +46.9%
- By 2075
- 10,574,329 · +89.8%
- By 2100
- 12,109,958 · +117.4%
Race, ethnicity, and origin ACS 2023
- Neighborhood character
- Diverse neighborhood (Simpson 0.56)
- Race & ethnicity
- Hispanic / Latino 54% Black 37% Two or more races 25% White 4% Asian 2% Native American 1%
- Hispanic origin (detail)
- Mexican 37%
- Common ancestry
- Ukrainian 1% Lithuanian 1%
- Foreign-born
- 23% · Canada, Jamaica, China
- Languages at home
- 47% English-only · Spanish 49% Arabic 2% Tagalog/Filipino 1%
Political lean MEDSL · Harris
- 2024 margin
- Lean D (+5.5) · D 52.0% · R 46.4% · Other 1.6%
- 2008→2024 swing
- +3.9pp toward D · 2008: 1.6pp · 2024: 5.5pp
- All cycles
- 2024: D+5.5 2020: D+13.3 2016: D+12.4 2012: D+0.1 2008: D+1.6
Not yet ingested
- Civics
- —
Market trends
- HPI YoY
- ▼ -22.49%
- Current HPI
- 282.5426
- Rent YoY
- ▼ -2.35%
- Metro
- Houston-The Woodlands-Sugar Land, TX
- State GDP YoY
- ▲ 3.95%
- F500 in state
- 110
Industry mix (Fortune 500 HQ in TX)
| Industry | F500 HQs | Revenue |
|---|---|---|
| Energy | 16 | $1,198B |
|
||
| Technology | 5 | $198B |
|
||
| Engineering / Construction | 4 | $72B |
|
||
| Energy Services | 3 | $60B |
|
||
| Utilities | 3 | $41B |
|
||
| Healthcare | 2 | $330B |
|
||
Price history
-21.2% since first listed13 events — show timeline
- 2026-05-18 Pending — HARMLS
- 2026-05-09 Price Changed $165,480 HARMLS
- 2026-04-08 Price Changed $181,240 HARMLS
- 2026-02-20 Listed $197,000 HARMLS
- 2024-08-30 Listing Removed — HARMLS
- 2024-08-19 Price Changed $171,000 HARMLS
- 2024-08-05 Price Changed $179,500 HARMLS
- 2024-08-05 Relisted — HARMLS
- 2024-07-29 Pending — HARMLS
- 2024-07-23 Price Changed $185,000 HARMLS
- 2024-07-18 Price Changed $199,000 HARMLS
- 2024-06-27 Listed $210,000 HARMLS
- 1988-01-02 Sold (Public Records) — Public Records
Property tax history
+2.9%/yrLatest (2025): $4,702 · +11.6% YoY. Source: county tax records.
Cash-flow waterfall
monthlySold comps — $/sqft
last 12 mo · ≤1 miLoading sold comps…