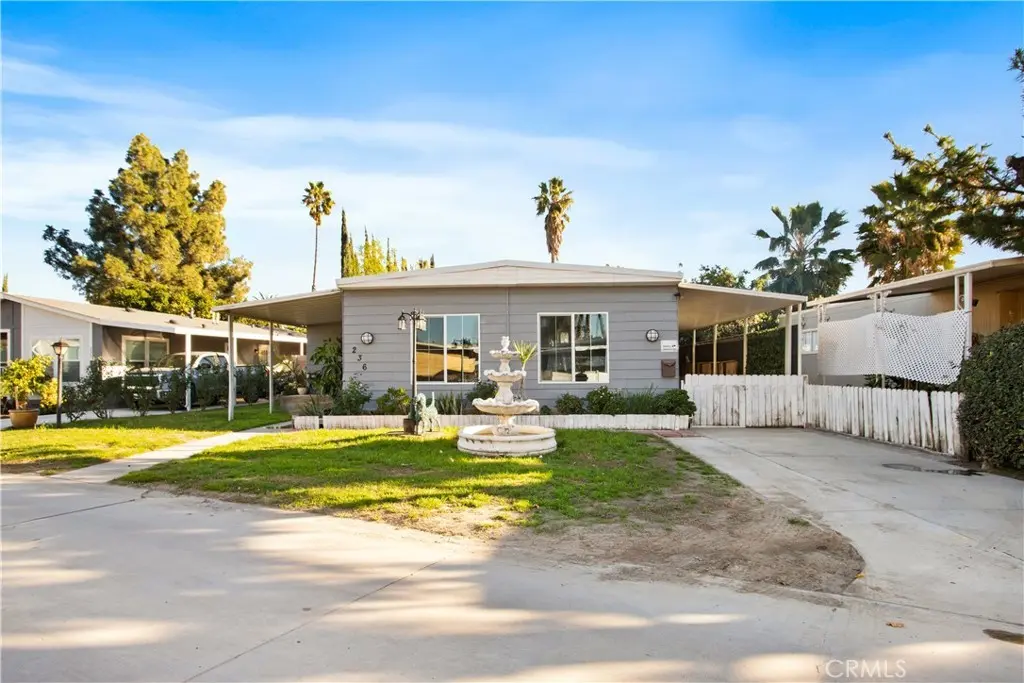
5800 Hamner Ave #236 · Eastvale, CA
Flood risk 4/10 · Minor
- FEMA flood zone
- X (unshaded)
- Chance of flooding over 30 yrs
- 0.2%
- Est. flood insurance / yr
- $507 – $1,088
Fire risk 7/10 · Major
- Est. fire insurance / yr
- $659 – $1,223
Heat risk 7/10 · Major
- Hot days now (above 102°F)
- 3 days/yr
- Hot days in 30 yrs
- 7 days/yr
Wind risk 1/10 · Minimal
- Chance of severe wind over 30 yrs
- —
Air-quality risk 9/10 · Severe
- Unhealthy air days now
- 23 days/yr
- Unhealthy air days in 30 yrs
- 26 days/yr
Risk factors via First Street. Map © Google.
Why this score? — see what drove the B+ grade
The composite is a weighted blend of 9 inputs, each scored 0–100. Each bar is that input's sub-score; the figure is the points it added to the 100-point composite (weight × sub-score).
- Cash flow +30.0/30.0
- ARV discount +15.0/15.0
- 1% rule +10.0/10.0
- DSCR +10.0/10.0
- Rent growth +3.2/5.0
- Livability +3.2/5.0
- Schools +3.1/10.0
- Condition / age +2.5/5.0
- Appreciation +0.0/10.0
$129,000
🖨 Deal sheet (PDF) 📄 Offer letter ✓ Due diligence
Listing remarks MLS
A clean, move-in-ready 3-bed, 2-bath mobile home that checks all the boxes. Sharp curb appeal, well-kept exterior, and a bright, inviting interior that feels instantly like home. Spacious bedrooms, a functional layout, and pride of ownership throughout. Located in a desirable Eastvale community with easy access to shopping, dining, and major freeways. Turnkey. Comfortable. Ready for its next owner.
Key facts
- Built 1972
- Listed 140 days
Neighborhood map
What this means for you Summary
Snapshot
- This is a 2-bed/2.0-bath manufactured listed at $129k.
Deal economics
- At list price, monthly cash flow is $2k ($18k/yr) — positive.
- The deal already cash-flows at list — no discount required.
- Meets the 1% rule at list price ($3k rent vs $129k).
- Recommended offer: $114k (12.0% below list) — sets the bar for market timing.
- Cap rate 20.5% vs local median 2.9% in Eastvale — top-decile yield for the area; either an underpriced asset or a hidden risk that comps aren't pricing in. Stress-test before assuming the spread holds.
Location & tenants
- Location reads 63/100 on livability (#464 in CA) — a middle-class / working-renter tenant base. Strengths: employment A+, housing A+, crime A-; Watch: amenities F, commute F, cost of living F.
- Jurupa Unified (suburban): math 25% / reading 38% proficiency, ranked #953 of 1,400 in CA (top 68%) — families likely to look elsewhere, expect single-tenant / working-renter base with shorter leases; 64% free/reduced lunch — lower-income household profile, screen leases tightly.
- Zoned schools: Sky Country Elementary (428 students, 70% FRL); Mira Loma Middle (math 24% / reading 24%, grade F, #277 of 498 statewide, top 73%, 694 students, 87% FRL); Jurupa Valley High (1,716 students, 82% FRL) — zoned schools average 80% FRL vs 64% district-wide (16 pts higher); higher-poverty schools than district average — tighter screening recommended.
- Market conditions: Rents rising (+3.0%/yr); 65 active listings in the ZIP; 14 comparable units currently listed for rent nearby; rentals at typical pace (median 26d on market — plan ~3-4 weeks tenant-placement turnaround); high-income renter base; 9,195 units permitted in Riverside County in 2024 (1,512 in 5+ unit buildings).
- This rent runs 32% of the median local income ($115k/yr) — at the standard rent-burdened threshold; future hikes will face affordability resistance.
Forward outlook
- Local home prices are declining (-3.0%/yr); year-one equity from $892 of loan paydown is wiped out by about $4k of value loss. Plan a longer hold.
- Riverside County population projected at +22% by 2050 — long-run rental-demand tailwind backs the buy-and-hold thesis.
- At projected returns (-3.0% appreciation + 3.0% rent growth), your $36k cash investment doubles in ~3 years — after that, you're playing with house money.
Negotiation context
- It's been on market 140 days — a 12% lower offer ($114k) is reasonable based on typical stale-listing flexibility.
- 3 sale attempts since 20y ago with the ask held roughly flat each time — persistent listings suggest the price (not the market) is what's stuck; bring a comps-based counter.
Risks & watch-outs
- Climate carrying-cost: major wildfire risk; extreme-heat days projected 3→7/yr by 2055 (HVAC capex compounding) — expect insurance premiums to compound above CPI over the hold.
Questions for the listing agent
- It's been on market 140 days. Have you received any prior offers? Is the seller open to a 12% concession, seller financing, or rate buy-down credit?
- Built in 1972 — when were the roof, HVAC, electrical panel, plumbing, and water heater last replaced?
- Why hasn't it sold? Are there any deal-killer items the seller is aware of (foundation, flood, title, zoning, code violations)?
- Is there a deadline driving the sale (1031 exchange, divorce, estate, relocation)? That informs how much negotiation room exists.
- Schools are B-rated — typically a magnet for longer-tenancy family renters. What's the average tenant stay here, and is there a school-zone premium baked into asking?
- What's the average days-on-market for RENTAL listings here right now (not sales)? A rising rental-DOM trend means longer vacancies and softer asking-rent achievability than the comps imply.
- What's the recent tenant-quality profile in this submarket — average credit score on applications, eviction rate, late-payment / NSF rate, and stable-employment percentage? A property-management company in the area should have these aggregated.
- How much new for-sale + rental construction is in the pipeline within 1–3 miles? Heavy new supply typically softens prices + rents 12–24 months out; constrained supply supports both.
Investment metrics
- 1% rule
- 2.38% ✓
- Cap rate
- 20.55%
- Cash-on-cash
- 50.92%
- DSCR
- 3.27
- GRM
- 3.5
CMA / ARV
- ARV (median comp)
- $156,276
- List price
- $129,000
- Delta
- -17.45%
- Verdict
- UNDERPRICED
- Comps
- 20 within 1.0 mi
Show comp detail 12 sales within ~0.75 mi
| Address | Dist | Beds/Ba | Sqft | Sold | Price | $/sf | Match |
|---|---|---|---|---|---|---|---|
| 5800 Hamner #416 | 0.00mi | 3/3.0 (+1) | 1,200 (0%) | 1mo | $115,000 | $96 | 90 |
| 5800 Hamner Ave #436 | 0.00mi | 3/2.0 (+1) | 1,230 (+2%) | 2mo | $235,000 | $191 | 90 |
| 5800 Hamner Ave #159 | 0.00mi | 3/2.0 (+1) | 1,200 (0%) | 7mo | $180,000 | $150 | 90 |
| 5800 Hamner #431 | 0.00mi | 3/2.0 (+1) | 1,248 (+4%) | 1mo | $155,000 | $124 | 88 |
| 5800 Hamner #156 | 0.00mi | 3/2.0 (+1) | 1,152 (-4%) | 3mo | $172,500 | $150 | 86 |
| 5800 Hamner Ave #288 | 0.00mi | 3/2.0 (+1) | 1,152 (-4%) | 9mo | $127,000 | $110 | 81 |
| 5800 Hamner #287 | 0.00mi | 3/2.0 (+1) | 1,122 (-6%) | 7mo | $60,000 | $53 | 78 |
| 5800 Hamner Ave #72 | 0.00mi | 3/2.0 (+1) | 1,344 (+12%) | 3mo | $255,000 | $190 | 73 |
| 5800 Hamner Ave #568 | 0.07mi | 3/2.0 (+1) | 1,344 (+12%) | 0mo | $247,500 | $184 | 72 |
| 5800-#407 Hamner Ave #407 | 0.00mi | 3/2.0 (+1) | 1,344 (+12%) | 8mo | $161,500 | $120 | 68 |
| 5800 Hamner #64 | 0.18mi | 3/2.0 (+1) | 1,056 (-12%) | 6mo | $160,000 | $152 | 61 |
| 5800 Hamner Ave #301 | 0.21mi | 3/2.0 (+1) | 1,049 (-13%) | 9mo | $130,000 | $124 | 57 |
Match score weights: distance 35% · size 25% · config 20% · recency 20%. Top-matched comps best support the ARV.
Projected returns pro-forma
-3.0% appreciation · 3.0% rent growth · sell at horizon
- IRR
- 48.7%
- Equity multiple
- 3.12×
- Total profit
- $76,755
- Equity at exit
- $19,234
- IRR
- 54.3%
- Equity multiple
- 6.34×
- Total profit
- $192,716
- Equity at exit
- $11,154
Cash invested: $36,120 (down + closing). Projections, not guarantees.
Landlord ↔ Tenant lean methodology
- Overall (STATE)
- 18 Strongly Tenant-Friendly
- State California
- 18 Strongly Tenant-Friendly · D+13
- County
- — inherits STATE
- City
- — inherits STATE
ZIP-level market 91752
- Rents YoY
- 3.0%
- Active inventory
- 65
- Price-to-rent
- 3.5×
Monthly cashflow live
- Estimated rent
- $3,068 high interval (Pro) →
- Mortgage (P&I)
- −$676
- Tax est. 1.5%
- −$161 /mo · $1,935/yr
- Insurance
- −$54
- HOA
- −$0
- Vacancy / Maint / Mgmt
- −$644
- Net cashflow
- $1,533
Break-even live
Sensitivity live
| Price | -10% $1,622 | -5% $1,577 | +0% $1,533 | +5% $1,488 | +10% $1,443 |
|---|---|---|---|---|---|
| Rent | -10% $1,290 | -5% $1,411 | +0% $1,533 | +5% $1,654 | +10% $1,775 |
| Rate | -1.0pp $1,598 | -0.5pp $1,565 | base $1,533 | +0.5pp $1,499 | +1.0pp $1,465 |
UW: 25.0% down · 7.5% · 30yr · 1.5% tax · 5.0% vac · 8.0% maint · 8.0% mgmt
Financing live
Cash to close
- Down payment
- $32,250
- Closing costs
- $3,870
- Reserves months
- —
- Total cash needed
- —
Loan-product check · same deal, 3 products live
Conventional
25% down · 7.5% · 30yr
- Down + closing
- —
- Monthly P&I
- —
- Monthly cashflow
- —
- DSCR
- —
- Eligible?
- —
Personal DTI + credit; lowest rate.
DSCR
20% down · 8.5% · 30yr
- Down + closing
- —
- Monthly P&I
- —
- Monthly cashflow
- —
- DSCR
- —
- Eligible?
- —
No personal income docs; deal must DSCR.
Hard money
10% down · 12.0% · 12mo
- Down + closing
- —
- Monthly P&I
- —
- Monthly cashflow
- —
- DSCR
- —
- Eligible?
- —
Short-term bridge; refi at stabilization.
Rent comps 14 comps
| Address | Beds | Baths | Sqft | Rent | $/sqft | DOM | Units | Dist |
|---|---|---|---|---|---|---|---|---|
| 5464 W Homecoming Cir Eastvale, CA | 1.0–3.0 | 1.5–3.0 | 1359 | $3,554 | $2.62 | 0d | 22 | 0.26mi |
| 5954 Catskills Ct Eastvale, CA | 2.0 | 2.5 | 1378 | $3,500 | $2.54 | 23d | 1 | 0.43mi |
| 6302 Ancora Ln Eastvale, CA | 2.0 | 2.5 | 1211 | $2,800 | $2.31 | 45d | 1 | 0.60mi |
| 12402 Constellation St Eastvale, CA | 3.0 | 3.0 | 1499 | $3,300 | $2.20 | 45d | 1 | 0.62mi |
| 6386 Pegasus Ct Eastvale, CA | 3.0 | 4.0 | 1500 | $3,100 | $2.07 | 26d | 1 | 0.69mi |
| 4536 S Afton Privado Ontario, CA | 2.0 | 2.0 | 1416 | $3,500 | $2.47 | 0d | 1 | 0.80mi |
| 11958 Sunstone Ct Unit 2-5 Jurupa Valley, CA | 1.0 | 1.0 | 866 | $1,499 | $1.73 | 45d | 1 | 0.88mi |
| 11958 Sunstone Ct Unit 2-M Jurupa Valley, CA | 1.0 | 1.0 | 899 | $1,699 | $1.89 | 45d | 1 | 0.88mi |
| 4130 E Malagon Privado #88 Ontario, CA | 3.0 | 2.5 | 1389 | $3,150 | $2.27 | 26d | 1 | 0.91mi |
| 4110 E Coronado Privado Ontario, CA | 2.0 | 2.0 | 1193 | $3,300 | $2.77 | 23d | 1 | 1.06mi |
| 6770 Pats Ranch Rd Jurupa Valley, CA | 1.0–3.0 | 1.0–2.0 | 1045 | $2,760 | $2.64 | 0d | 16 | 1.14mi |
| 4255 E Carmel Privado Ontario, CA | 3.0 | 2.5 | 1450 | $3,200 | $2.21 | 26d | 1 | 1.17mi |
| 4231 S Hollyhock Paseo #76 Ontario, CA | 3.0 | 2.5 | 1428 | $3,000 | $2.10 | 26d | 1 | 1.22mi |
| 4231 E Sage Paseo Unit 97 Ontario, CA | 3.0 | 2.5 | 1428 | $3,150 | $2.21 | 26d | 1 | 1.25mi |
Listing history 18 events
-
2026-06-18days on market $129,000 Active 140 DOM
-
2026-06-17days on market $129,000 Active 139 DOM
-
2026-06-16days on market $129,000 Active 138 DOM
-
2026-06-15days on market $129,000 Active 137 DOM
-
2026-06-13days on market $129,000 Active 135 DOM
-
2026-06-13days on market $129,000 Active 134 DOM
-
2026-06-09days on market $129,000 Active 131 DOM
-
2026-06-08days on market $129,000 Active 130 DOM
-
2026-06-07days on market $129,000 Active 129 DOM
-
2026-06-04days on market $129,000 Active 126 DOM
-
2026-06-03days on market $129,000 Active 125 DOM
-
2026-06-02days on market $129,000 Active 124 DOM
-
2026-06-01days on market $129,000 Active 123 DOM
-
2026-05-31days on market $129,000 Active 122 DOM
-
2026-04-10status Active 401-char remark
Show marketing remark (401 chars)
A clean, move-in-ready 3-bed, 2-bath mobile home that checks all the boxes. Sharp curb appeal, well-kept exterior, and a bright, inviting interior that feels instantly like home. Spacious bedrooms, a functional layout, and pride of ownership throughout. Located in a desirable Eastvale community with easy access to shopping, dining, and major freeways. Turnkey. Comfortable. Ready for its next owner.
-
2026-01-16$129,000 Active 401-char remark
Show marketing remark (401 chars)
A clean, move-in-ready 3-bed, 2-bath mobile home that checks all the boxes. Sharp curb appeal, well-kept exterior, and a bright, inviting interior that feels instantly like home. Spacious bedrooms, a functional layout, and pride of ownership throughout. Located in a desirable Eastvale community with easy access to shopping, dining, and major freeways. Turnkey. Comfortable. Ready for its next owner.
-
2006-04-06historical
-
2006-02-02$31,910
ⓘ Source: listings_history table (triggers on properties + properties_extension) + one-shot
backfill from property_details.listing_events for pre-trigger history.
Climate risk First Street
- Flood 4/10 Moderate FEMA zone X (unshaded) · 20% chance over 30 yrs
- Wildfire 7/10 Severe
- Heat 7/10 Severe 3 d/yr ≥102°F today · 7 d/yr by 30 yrs out
- Wind 1/10 Low
- Air quality 9/10 Extreme 23 unhealthy d/yr today · 26 by 30 yrs out
Nearby sold comps map
Loading sold comps map…
Walkable amenities ~0.75 mi
Loading nearby amenities…
Taxation est. · year 1
- Rental income
- $36,822
- − Mortgage interest
- −$7,226
- − Property taxes
- −$1,935
- − Insurance
- −$645
- − Repairs & maintenance
- −$2,946
- − Management
- −$2,946
- − Depreciation
- −$3,753
- Taxable income
- $17,371
- Est. tax owed @ 24.0%
- −$4,169
- After-tax cash flow
- $14,222/yr
For passive investors: Depreciation is non-cash, so a rental often shows a tax loss while cash-flowing — sheltering income. Rental losses are passive: they offset passive income freely, and up to $25,000/yr can offset ordinary (W-2) income if you actively participate and your MAGI is under $100k (phasing out to $0 by $150k); unused losses carry forward. On sale, claimed depreciation is recaptured at up to 25%, and gains may owe capital-gains tax (a 1031 exchange can defer both). Figures are a year-1 estimate at your 24.0% rate — not tax advice; consult a CPA.
Schools (NCES district)
- District
- Jurupa Unified
- NCES district ID
- 0619260
- Math proficiency
- 25% ▲ 2.00%
- Reading proficiency
- 38% ▲ 2.00%
- Median HH income
- $58,100
- Composite
- 30.97/100
- National rank
- #11327
- State rank
- #953 of 1400 in CA
Livability — Eastvale
- Score
- 63/100
- State rank
- #464
- US rank
- #15853
Category grades
Schools grade is shown separately in the Schools card above.
Census & demographics
- Census place
- Eastvale, CA
- County
- Riverside County · 2,287,001 people
- City population
- 75,043
- Metro
- Riverside-San Bernardino-Ontario, CA
- Population (ZIP)
- 37,983
- Household income
- $115,177
- Rent vs Own
- Severe rent burden
- 1280.0
Population outlook (Riverside County) Hauer SSP2
- Today (2025)
- 2,664,475 people
- By 2030
- 2,802,692 · +5.2%
- By 2040
- 3,050,904 · +14.5%
- By 2050
- 3,256,783 · +22.2%
- By 2075
- 3,655,058 · +37.2%
- By 2100
- 3,766,594 · +41.4%
Race, ethnicity, and origin ACS 2023
- Neighborhood character
- Diverse neighborhood (Simpson 0.57)
- Race & ethnicity
- Hispanic / Latino 61% White 20% Two or more races 16% Asian 10% Black 7% Native American 1%
- Hispanic origin (detail)
- Mexican 54% Puerto Rican 1%
- Common ancestry
- Italian 1% Lithuanian 1% Iranian 1%
- Foreign-born
- 26% · Canada, China, South Korea
- Languages at home
- 47% English-only · Spanish 45% Tagalog/Filipino 2% Other Indo-European 2%
Political lean MEDSL · Riverside
- 2024 margin
- Toss-up / Even · D 48.0% · R 49.3% · Other 2.6%
- 2008→2024 swing
- -3.6pp toward R · 2008: 2.3pp · 2024: -1.3pp
- All cycles
- 2024: R+1.3 2020: D+8.0 2016: D+4.3 2012: R+0.4 2008: D+2.3
Not yet ingested
- Civics
- —
Market trends
- HPI YoY
- ▼ -560.99%
- Current HPI
- 426.3636
- Rent YoY
- ▲ 3.00%
- Metro
- Riverside-San Bernardino-Ontario, CA
- State GDP YoY
- ▲ 3.21%
- F500 in state
- 116
Industry mix (Fortune 500 HQ in CA)
| Industry | F500 HQs | Revenue |
|---|---|---|
| Technology | 27 | $1,492B |
|
||
| Financial Services | 3 | $174B |
|
||
| Retail | 3 | $44B |
|
||
| Insurance | 3 | $26B |
|
||
| Media / Entertainment | 2 | $115B |
|
||
| Pharmaceuticals / Biotech | 2 | $62B |
|
||
Price history
+304.3% since first listed4 events — show timeline
- 2026-04-10 Relisted — CRMLS
- 2026-01-16 Listed $129,000 CRMLS
- 2006-04-06 Listing Removed — CRMLS
- 2006-02-02 Listed $31,910 CRMLS
Property tax history
-3.1%/yrLatest (2025): $79 · +7.5% YoY. Source: county tax records.
Cash-flow waterfall
monthlySold comps — $/sqft
last 12 mo · ≤1 miLoading sold comps…