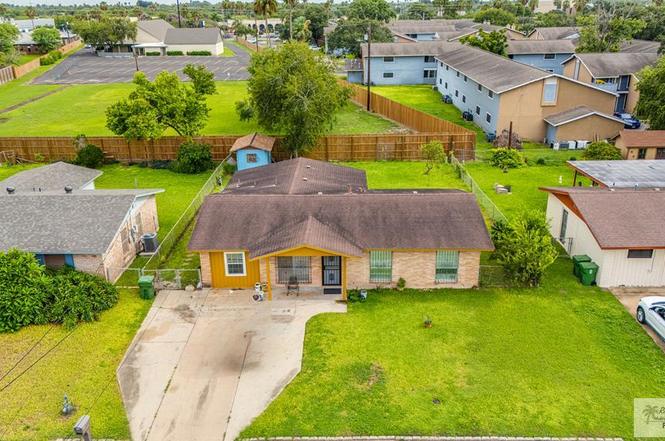
24 Ivy Ln · Brownsville, TX
Flood risk 4/10 · Minor
- FEMA flood zone
- X (unshaded)
- Chance of flooding over 30 yrs
- 0.2%
- Est. flood insurance / yr
- $507 – $1,088
Fire risk 1/10 · Minimal
- Est. fire insurance / yr
- $1,222 – $2,270
Heat risk 9/10 · Severe
- Hot days now (above 111°F)
- 7 days/yr
- Hot days in 30 yrs
- 25 days/yr
Wind risk 9/10 · Severe
- Chance of severe wind over 30 yrs
- 99.0%
Air-quality risk 3/10 · Minor
- Unhealthy air days now
- 2 days/yr
- Unhealthy air days in 30 yrs
- 3 days/yr
Risk factors via First Street. Map © Google.
Why this score? — see what drove the C grade
The composite is a weighted blend of 9 inputs, each scored 0–100. Each bar is that input's sub-score; the figure is the points it added to the 100-point composite (weight × sub-score).
- Cash flow +25.0/30.0
- DSCR +8.1/10.0
- ARV discount +7.5/15.0
- 1% rule +6.1/10.0
- Rent growth +4.5/5.0
- Livability +4.0/5.0
- Condition / age +2.5/5.0
- Schools +2.2/10.0
- Appreciation +0.0/10.0
$185,000
🖨 Deal sheet 📄 Offer letter ✓ Due diligence
Listing remarks
Large backyard, wooden high-privacy fence, central location, quiet neighborhood. It has a large TV room that can be used as a game room.
Key facts
- Large tv room
- Large backyard
- Central location
Tags
Neighborhood map
What this means for you Summary
Snapshot
- This is a 4-bed/2.5-bath single-family listed at $185k.
Deal economics
- At list price, monthly cash flow is $402 ($5k/yr) — positive.
- The deal already cash-flows at list — no discount required.
- Meets the 1% rule at list price ($2k rent vs $185k).
- Cap rate 8.9% vs local median 5.0% in Brownsville — top-decile yield for the area; either an underpriced asset or a hidden risk that comps aren't pricing in. Stress-test before assuming the spread holds.
Location & tenants
- Location reads 79/100 on livability (#62 in TX, #2,311 nationally) — a middle-class / working-renter tenant base. Strengths: commute A+, cost of living A+, housing A+; Watch: amenities D, crime D-, employment F.
- Brownsville ISD (urban): math 20% / reading 34% proficiency, ranked #710 of 826 in TX (top 86%) — low school quality limits family demand, transient renter base, plan for 1-2y turnover; 83% free/reduced lunch — lower-income household profile, screen leases tightly.
- Zoned schools: Perez El (math 12% / reading 17%, grade F, #4,048 of 4,322 statewide, top 95%, 628 students, 96% FRL); Oliveira Middle (math 23% / reading 37%, grade F, #1,056 of 1,662 statewide, top 65%, 802 students, 94% FRL); Hanna Early College H S (math 24% / reading 49%, grade F, #924 of 1,632 statewide, top 57%, 2,246 students, 88% FRL).
- Market conditions: Rents rising fast (+8.2%/yr); 365 active listings in the ZIP; 20 comparable units currently listed for rent nearby; rentals at typical pace (median 21d on market — plan ~3-4 weeks tenant-placement turnaround); 45% of comp listings sitting > 30 days — soft ceiling on asking rent; lower-income renter base — watch delinquency; 2,326 units permitted in Cameron County in 2024 (503 in 5+ unit buildings).
- At $2,054/mo this rent would consume 55% of the median local household income ($45k/yr) (locally 2682% of renters already pay >50% of income on rent) — very limited rent-growth headroom before tenants either downsize or default.
Forward outlook
- Local home prices are declining (-3.0%/yr); year-one equity from $1k of loan paydown is wiped out by about $6k of value loss. Plan a longer hold.
- Cameron County population projected at +3% by 2050 — modest demand growth; plan on rents tracking national, not racing it.
- At projected returns (-3.0% appreciation + 8.0% rent growth), your $52k cash investment doubles in ~8 years — after that, you're playing with house money.
Negotiation context
- Only 6 days on market — expect competitive offers; lowballing is unlikely to land.
Risks & watch-outs
- Climate carrying-cost: severe wind risk, 99% chance of damaging wind over 30y; extreme-heat days projected 7→25/yr by 2055 (HVAC capex compounding) — expect insurance premiums to compound above CPI over the hold.
Questions for the listing agent
- Built in 1972 — when were the roof, HVAC, electrical panel, plumbing, and water heater last replaced?
- Is there a deadline driving the sale (1031 exchange, divorce, estate, relocation)? That informs how much negotiation room exists.
- Crime grade is D in this area — have there been break-ins, vandalism, or insurance claims at this property in the last 3 years? What carrier currently insures it and at what premium?
- What's the average days-on-market for RENTAL listings here right now (not sales)? A rising rental-DOM trend means longer vacancies and softer asking-rent achievability than the comps imply.
- What's the recent tenant-quality profile in this submarket — average credit score on applications, eviction rate, late-payment / NSF rate, and stable-employment percentage? A property-management company in the area should have these aggregated.
- How much new for-sale + rental construction is in the pipeline within 1–3 miles? Heavy new supply typically softens prices + rents 12–24 months out; constrained supply supports both.
Investment metrics
- 1% rule
- 1.11% ✓
- Cap rate
- 8.90%
- Cash-on-cash
- 9.31%
- DSCR
- 1.41
- GRM
- 7.5
CMA / ARV
No comps found within radius.
Projected returns pro-forma
-3.0% appreciation · 8.0% rent growth · sell at horizon
- IRR
- 3.1%
- Equity multiple
- 1.12×
- Total profit
- $6,468
- Equity at exit
- $27,584
- IRR
- 16.8%
- Equity multiple
- 2.70×
- Total profit
- $87,981
- Equity at exit
- $15,995
Cash invested: $51,800 (down + closing). Projections, not guarantees.
Landlord ↔ Tenant lean methodology
- Overall (STATE)
- 87 Strongly Landlord-Friendly
- State Texas
- 87 Strongly Landlord-Friendly · R+5
- County
- — inherits STATE
- City
- — inherits STATE
ZIP-level market 78521
- Home prices YoY
- -26.0%
- Rents YoY
- 8.2%
- Active inventory
- 365
- Price-to-rent
- 7.5×
Monthly cashflow live
- Estimated rent
- $2,054 high interval (Pro) →
- Mortgage (P&I)
- −$970
- Tax from tax record
- −$174 /mo · $2,085/yr
- Insurance
- −$77
- HOA
- −$0
- Vacancy / Maint / Mgmt
- −$431
- Net cashflow
- $402
Break-even live
UW: 25.0% down · 7.5% · 30yr · 1.5% tax · 5.0% vac · 8.0% maint · 8.0% mgmt
Financing live
Cash to close
- Down payment
- $46,250
- Closing costs
- $5,550
- Reserves months
- —
- Total cash needed
- —
Loan-product check · same deal, 3 products live
Conventional
25% down · 7.5% · 30yr
- Down + closing
- —
- Monthly P&I
- —
- Monthly cashflow
- —
- DSCR
- —
- Eligible?
- —
Personal DTI + credit; lowest rate.
DSCR
20% down · 8.5% · 30yr
- Down + closing
- —
- Monthly P&I
- —
- Monthly cashflow
- —
- DSCR
- —
- Eligible?
- —
No personal income docs; deal must DSCR.
Hard money
10% down · 12.0% · 12mo
- Down + closing
- —
- Monthly P&I
- —
- Monthly cashflow
- —
- DSCR
- —
- Eligible?
- —
Short-term bridge; refi at stabilization.
Rent comps 20 comps
| Address | Beds | Baths | Sqft | Rent | $/sqft | DOM | Units | Dist |
|---|---|---|---|---|---|---|---|---|
| 2D Palmetto Ct Unit 2D Brownsville, TX | 3.0 | 2.0 | 1360 | $1,450 | $1.07 | 21d | 1 | 0.51mi |
| 63 N Tupelo Cir Brownsville, TX | 3.0 | 2.0 | 2055 | $2,200 | $1.07 | 21d | 1 | 0.70mi |
| 20 Casa Linda Brownsville, TX | 4.0 | 2.0 | 1900 | $2,300 | $1.21 | 44d | 1 | 0.73mi |
| 1604 Yale Ave Brownsville, TX | 3.0 | 1.0 | 1316 | $1,800 | $1.37 | 21d | 1 | 0.91mi |
| 1815 Sancho Panza St Brownsville, TX | 4.0 | 3.0 | 1784 | $2,350 | $1.32 | 44d | 1 | 0.95mi |
| 95 Poinciana Dr Brownsville, TX | 1.0–3.0 | 1.5–2.0 | 1130 | $2,500 | $2.21 | 44d | 2 | 0.97mi |
| 95 Poinciana Dr Brownsville, TX | 2.0–3.0 | 2.0 | 1218 | $2,600 | $2.13 | 14d | 2 | 0.97mi |
| 515 Mc Davitt Blvd Brownsville, TX | 4.0 | 2.0 | 1272 | $1,300 | $1.02 | 44d | 1 | 0.99mi |
| 538 Land O Lakes Dr Brownsville, TX | 3.0 | 2.0 | 1421 | $1,600 | $1.13 | 44d | 1 | 1.05mi |
| 1405 Harvard Ave Brownsville, TX | 3.0 | 2.0 | 1426 | $1,700 | $1.19 | 44d | 1 | 1.10mi |
| 3016 San Miguel Cir Brownsville, TX | 3.0 | 2.5 | 2044 | $2,200 | $1.08 | 44d | 1 | 1.12mi |
| 2998 San Miguel Cir Brownsville, TX | 3.0 | 2.5 | 2044 | $2,300 | $1.13 | 21d | 1 | 1.14mi |
| 2700 Farm to Market Road 802 Brownsville, TX | 1.0–3.0 | 1.0–2.0 | 990 | $2,002 | $2.02 | 14d | 8 | 1.15mi |
| 205 Ebony Ave Brownsville, TX | 4.0 | 3.0 | 2400 | $2,000 | $0.83 | 21d | 1 | 1.26mi |
| 2425 Barnard Rd Unit ujnit 1-A Brownsville, TX | 3.0 | 1.5 | 1300 | $1,600 | $1.23 | 44d | 1 | 1.30mi |
| 2834 Boardwalk Brownsville, TX | 3.0 | 2.0 | 1314 | $1,800 | $1.37 | 21d | 1 | 1.39mi |
| 2888 Seville Blvd Brownsville, TX | 3.0 | 2.0 | 1456 | $1,650 | $1.13 | 21d | 1 | 1.42mi |
| 1105 Parkwood Pl Brownsville, TX | 5.0 | 3.0 | 1914 | $2,000 | $1.04 | 21d | 1 | 1.44mi |
| 2428 San Marino Dr Brownsville, TX | 3.0 | 3.5 | 1915 | $2,800 | $1.46 | 44d | 1 | 1.46mi |
| 2459 Salerno Dr Brownsville, TX | 3.0 | 3.0 | 1797 | $2,500 | $1.39 | 21d | 1 | 1.50mi |
Listing history 5 events
-
2025-07-16status Pending
-
2025-07-08$185,000 Active
-
2021-10-13soldstatus
-
2004-07-30soldstatus
-
1996-01-12soldstatus
ⓘ Source: listings_history table (triggers on properties + properties_extension) + one-shot
backfill from property_details.listing_events for pre-trigger history.
Tax reassessment forecast TX · Resets to sale price
- Current annual tax
- $2,085 · $174/mo
- Projected year-2 tax
- $3,386 · $282/mo
- Expected delta
- +$1,301/yr (+$108/mo · 62.4%)
ⓘ Screening estimate from a state-policy table — verify with the county assessor before closing.
Climate risk First Street
- Flood 4/10 Moderate FEMA zone X (unshaded) · 20% chance over 30 yrs
- Wildfire 1/10 Low
- Heat 9/10 Extreme 7 d/yr ≥111°F today · 25 d/yr by 30 yrs out
- Wind 9/10 Extreme 99% chance of damaging wind over 30 yrs
- Air quality 3/10 Moderate 2 unhealthy d/yr today · 3 by 30 yrs out
Nearby sold comps map
Loading sold comps map…
Walkable amenities ~0.75 mi
Loading nearby amenities…
Taxation est. · year 1
- Rental income
- $24,651
- − Mortgage interest
- −$10,363
- − Property taxes
- −$2,085
- − Insurance
- −$925
- − Repairs & maintenance
- −$1,972
- − Management
- −$1,972
- − Depreciation
- −$5,382
- Taxable income
- $1,952
- Est. tax owed @ 24.0%
- −$468
- After-tax cash flow
- $4,354/yr
For passive investors: Depreciation is non-cash, so a rental often shows a tax loss while cash-flowing — sheltering income. Rental losses are passive: they offset passive income freely, and up to $25,000/yr can offset ordinary (W-2) income if you actively participate and your MAGI is under $100k (phasing out to $0 by $150k); unused losses carry forward. On sale, claimed depreciation is recaptured at up to 25%, and gains may owe capital-gains tax (a 1031 exchange can defer both). Figures are a year-1 estimate at your 24.0% rate — not tax advice; consult a CPA.
Schools (NCES district)
- District
- Brownsville ISD
- NCES district ID
- 4811680
- Math proficiency
- 20% ▼ -36.00%
- Reading proficiency
- 34% ▼ -13.00%
- Median HH income
- $30,490
- Composite
- 21.8/100
- National rank
- #8249
- State rank
- #710 of 826 in TX
Livability — Brownsville
- Score
- 79/100
- State rank
- #62
- US rank
- #2311
Category grades
Schools grade is shown separately in the Schools card above.
Census & demographics
- Census place
- Brownsville, TX
- County
- Cameron County · 310,734 people
- City population
- 212,132
- Metro
- Brownsville-Harlingen, TX
- Population (ZIP)
- 87,380
- Household income
- $44,509
- Rent vs Own
- Severe rent burden
- 2682.0
Population outlook (Cameron County) Hauer SSP2
- Today (2025)
- 441,603 people
- By 2030
- 448,113 · +1.5%
- By 2040
- 456,385 · +3.3%
- By 2050
- 456,294 · +3.3%
- By 2075
- 423,851 · -4.0%
- By 2100
- 342,787 · -22.4%
Race, ethnicity, and origin ACS 2023
- Neighborhood character
- Predominantly Hispanic (97%)
- Race & ethnicity
- Hispanic / Latino 97% Two or more races 45% White 3%
- Hispanic origin (detail)
- Mexican 91%
- Foreign-born
- 30% · Canada
- Languages at home
- 12% English-only · Spanish 88%
Political lean MEDSL · Cameron
- 2024 margin
- Lean R (+5.8) · D 46.7% · R 52.5%
- 2008→2024 swing
- -34.6pp toward R · 2008: 28.8pp · 2024: -5.8pp
- All cycles
- 2024: R+5.8 2020: D+13.2 2016: D+32.5 2012: D+32.4 2008: D+28.8
Not yet ingested
- Civics
- —
Market trends
- HPI YoY
- ▼ -81.45%
- Current HPI
- 232.1072
- Rent YoY
- ▲ 8.19%
- Metro
- Brownsville-Harlingen, TX
- State GDP YoY
- ▲ 3.95%
- F500 in state
- 110
Industry mix (Fortune 500 HQ in TX)
| Industry | F500 HQs | Revenue |
|---|---|---|
| Energy | 16 | $1,198B |
|
||
| Technology | 5 | $198B |
|
||
| Engineering / Construction | 4 | $72B |
|
||
| Energy Services | 3 | $60B |
|
||
| Utilities | 3 | $41B |
|
||
| Healthcare | 2 | $330B |
|
||
Price history
5 events — show timeline
- 2025-07-16 Pending — RGVMLS
- 2025-07-08 Listed $185,000 RGVMLS
- 2021-10-13 Sold (Public Records) — Public Records
- 2004-07-30 Sold (Public Records) — Public Records
- 1996-01-12 Sold (Public Records) — Public Records
Property tax history
+2.3%/yrLatest (2025): $2,085 · +0.1% YoY. Source: county tax records.
Cash-flow waterfall
monthlySold comps — $/sqft
last 12 mo · ≤1 miLoading sold comps…