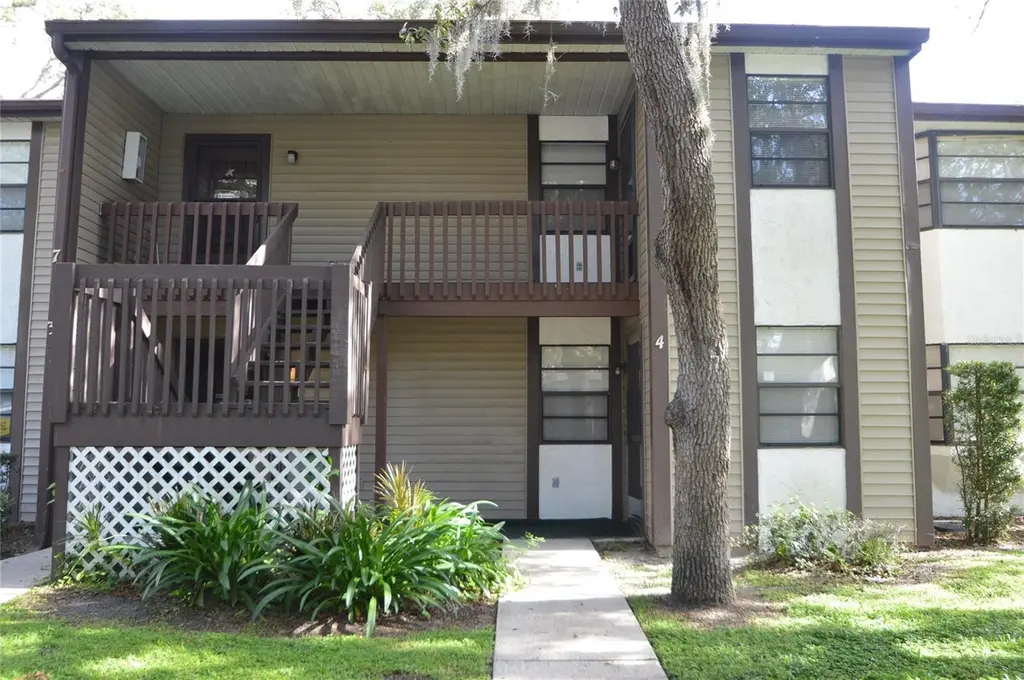
12010 Proctor Loop #4 · Moon Lake, FL
Flood risk 1/10 · Minimal
- FEMA flood zone
- X (unshaded)
- Chance of flooding over 30 yrs
- 0.0%
- Est. flood insurance / yr
- $507 – $1,088
Fire risk 4/10 · Minor
- Est. fire insurance / yr
- $947 – $1,759
Heat risk 10/10 · Severe
- Hot days now (above 108°F)
- 7 days/yr
- Hot days in 30 yrs
- 26 days/yr
Wind risk 10/10 · Severe
- Chance of severe wind over 30 yrs
- 99.0%
Air-quality risk 2/10 · Minimal
- Unhealthy air days now
- 1 days/yr
- Unhealthy air days in 30 yrs
- 3 days/yr
Risk factors via First Street. Map © Google.
Why this score? — see what drove the C+ grade
The composite is a weighted blend of 9 inputs, each scored 0–100. Each bar is that input's sub-score; the figure is the points it added to the 100-point composite (weight × sub-score).
- Cash flow +25.6/30.0
- 1% rule +10.0/10.0
- DSCR +8.5/10.0
- ARV discount +7.5/15.0
- Schools +4.3/10.0
- Livability +2.8/5.0
- Condition / age +2.5/5.0
- Rent growth +2.0/5.0
- Appreciation +0.0/10.0
$119,500
🖨 Deal sheet 📄 Offer letter ✓ Due diligence
Listing remarks MLS
Property is a 2 bedroom, 2 bathroom condo. located on first floor and corner unit. Has screened/covered back patio.
Key facts
- Ground floor
- Large kitchen
- Screened porch
Tags
Property features AI
Finance
- Other: Directions: Highway 52 to Moon Lake Road, go south then right on Baywood Meadows and then left on Proctor Loop
- Financial info: Total monthly fees $474; Total annual fees $5,688; Lease restrictions apply
- HOA & community: Baywood Meadows Association; Monthly condo fee $474 (includes pool, structure maintenance, grounds maintenance, management); Association approval required; Clubhouse and pool in the community; Cats and dogs allowed
Exterior
- Parking: No parking details provided
- Utilities: Public water; Public sewer; Public utilities
- Home design: Condominium (Residential); One story; Faces west; PUD zoning; Unit on first floor
- Construction: Frame construction; Shingle roof; Slab foundation; Built/identified as building number 12010
- Exterior features: Sliding doors; Asphalt road access
Interior
- Kitchen: Dishwasher; Range; Refrigerator; Disposal; Electric water heater
- Bedrooms: 3 bedrooms
- Flooring: Ceramic tile
- Bathrooms: 2 full bathrooms
- Heating & cooling: Central heating (electric); Central air conditioning
- Interior features: Ceiling fans; Living room/dining room combo; 6 total rooms
- Laundry & utility: Laundry closet; Washer; Dryer
Neighborhood map
What this means for you Summary
Snapshot
- This is a 3-bed/2.0-bath condo listed at $120k.
Deal economics
- At list price, monthly cash flow is $282 ($3k/yr) — positive.
- The deal already cash-flows at list — no discount required.
- Meets the 1% rule at list price ($2k rent vs $120k).
- Recommended offer: $116k (3.0% below list) — sets the bar for market timing.
- Cap rate 9.1% vs local median 4.4% in Moon Lake — top-decile yield for the area; either an underpriced asset or a hidden risk that comps aren't pricing in. Stress-test before assuming the spread holds.
Location & tenants
- Location reads 56/100 on livability (#871 in FL) — a working-class tenant base; expect higher turnover. Strengths: cost of living A+, housing A+; Watch: schools F, amenities F, commute F.
- Pasco (suburban): math 50% / reading 52% proficiency, ranked #32 of 73 in FL (top 44%) — acceptable for families but not a draw, mixed tenant base, ~2y average lease.
- Market conditions: Rents soft (-1.9%/yr); 353 active listings in the ZIP; 5 comparable units currently listed for rent nearby; rentals at typical pace (median 24d on market — plan ~3-4 weeks tenant-placement turnaround); 6,765 units permitted in Pasco County in 2024 (1,250 in 5+ unit buildings).
- This rent runs 33% of the median local income ($74k/yr) — at the standard rent-burdened threshold; future hikes will face affordability resistance.
Forward outlook
- Local home prices are declining (-3.0%/yr); year-one equity from $826 of loan paydown is wiped out by about $4k of value loss. Plan a longer hold.
- Pasco County population projected at +29% by 2050 — long-run rental-demand tailwind backs the buy-and-hold thesis.
Negotiation context
- It's been on market 41 days — a 3% lower offer ($116k) is reasonable based on typical stale-listing flexibility.
- 2 sale attempts since 8y ago with the ask held roughly flat each time — persistent listings suggest the price (not the market) is what's stuck; bring a comps-based counter.
- Current owner paid $94k; 27% above their basis — modest negotiation headroom, anchor on the comps not their cost.
Risks & watch-outs
- Watch-outs: HOA is 24% of rent.
- Climate carrying-cost: severe wind risk, 99% chance of damaging wind over 30y; extreme-heat days projected 7→26/yr by 2055 (HVAC capex compounding) — expect insurance premiums to compound above CPI over the hold.
Questions for the listing agent
- It's been on market 41 days. Have you received any prior offers? Is the seller open to a 3% concession, seller financing, or rate buy-down credit?
- What does the HOA fee cover, when was the last increase, and are there any pending special assessments or reserve-fund shortfalls?
- Any open or pending special assessments — roof, HVAC, plumbing, elevator, façade? What's the per-unit balance and payoff schedule, and is the seller paying it off at close or rolling it to the buyer?
- Is there a deadline driving the sale (1031 exchange, divorce, estate, relocation)? That informs how much negotiation room exists.
- Schools are F-rated, which usually means shorter tenancies and higher turnover. Who's the typical renter profile here, and what's been the actual vacancy rate?
- What's the average days-on-market for RENTAL listings here right now (not sales)? A rising rental-DOM trend means longer vacancies and softer asking-rent achievability than the comps imply.
- What's the recent tenant-quality profile in this submarket — average credit score on applications, eviction rate, late-payment / NSF rate, and stable-employment percentage? A property-management company in the area should have these aggregated.
- How much new apartment / multifamily construction is in the pipeline within 1–3 miles? Heavy new supply (>2% of stock underway) typically softens rents 12–24 months out; light construction supports rent growth.
Investment metrics
- 1% rule
- 1.68% ✓
- Cap rate
- 9.13%
- Cash-on-cash
- 10.12%
- DSCR
- 1.45
- GRM
- 5.0
CMA / ARV
No comps found within radius.
Projected returns pro-forma
-3.0% appreciation · 0.0% rent growth · sell at horizon
- IRR
- -5.8%
- Equity multiple
- 0.79×
- Total profit
- $-6,952
- Equity at exit
- $17,818
- IRR
- -2.4%
- Equity multiple
- 0.87×
- Total profit
- $-4,340
- Equity at exit
- $10,332
Cash invested: $33,460 (down + closing). Projections, not guarantees.
Landlord ↔ Tenant lean methodology
- Overall (STATE)
- 87 Strongly Landlord-Friendly
- State Florida
- 87 Strongly Landlord-Friendly · R+3
- County
- — inherits STATE
- City
- — inherits STATE
ZIP-level market 34654
- Home prices YoY
- -12.7%
- Rents YoY
- -1.9%
- Active inventory
- 353
- Price-to-rent
- 5.0×
Monthly cashflow live
- Estimated rent
- $2,009 high interval (Pro) →
- Mortgage (P&I)
- −$627
- Tax from tax record
- −$154 /mo · $1,851/yr
- Insurance
- −$50
- HOA
- −$474
- Vacancy / Maint / Mgmt
- −$422
- Net cashflow
- $282
Break-even live
UW: 25.0% down · 7.5% · 30yr · 1.5% tax · 5.0% vac · 8.0% maint · 8.0% mgmt
Financing live
Cash to close
- Down payment
- $29,875
- Closing costs
- $3,585
- Reserves months
- —
- Total cash needed
- —
Loan-product check · same deal, 3 products live
Conventional
25% down · 7.5% · 30yr
- Down + closing
- —
- Monthly P&I
- —
- Monthly cashflow
- —
- DSCR
- —
- Eligible?
- —
Personal DTI + credit; lowest rate.
DSCR
20% down · 8.5% · 30yr
- Down + closing
- —
- Monthly P&I
- —
- Monthly cashflow
- —
- DSCR
- —
- Eligible?
- —
No personal income docs; deal must DSCR.
Hard money
10% down · 12.0% · 12mo
- Down + closing
- —
- Monthly P&I
- —
- Monthly cashflow
- —
- DSCR
- —
- Eligible?
- —
Short-term bridge; refi at stabilization.
Rent comps 5 comps
| Address | Beds | Baths | Sqft | Rent | $/sqft | DOM | Units | Dist |
|---|---|---|---|---|---|---|---|---|
| 11550 Baywood Meadows Dr #7 New Port Richey, FL | 2.0 | 1.0 | 1008 | $1,495 | $1.48 | 24d | 1 | 0.08mi |
| 12135 Environmental Dr #4 New Port Richey, FL | 3.0 | 2.0 | 1239 | $1,800 | $1.45 | 24d | 1 | 0.13mi |
| 12065 Grizzly Ln New Port Richey, FL | 3.0 | 2.5 | 1440 | $2,200 | $1.53 | 17d | 1 | 0.27mi |
| 12245 Grizzly Ln New Port Richey, FL | 3.0 | 2.5 | 1207 | $2,280 | $1.89 | 24d | 1 | 0.30mi |
| 12405 Shearwater Dr Unit 12405 New Port Richey, FL | 2.0 | 2.0 | 1000 | $1,600 | $1.60 | 2d | 1 | 0.40mi |
HOA detail condo
- Monthly dues
- $474 · $5,688/yr
- Assessments
- None detected in remarks — confirm with the listing agent.
Listing history 21 events
-
2026-06-18days on market $119,500 Active 41 DOM
-
2026-06-17days on market $119,500 Active 40 DOM
-
2026-06-16days on market $119,500 Active 39 DOM
-
2026-06-15days on market $119,500 Active 38 DOM
-
2026-06-13days on market $119,500 Active 36 DOM
-
2026-06-09days on market $119,500 Active 32 DOM
-
2026-06-08days on market $119,500 Active 31 DOM
-
2026-06-07days on market $119,500 Active 30 DOM
-
2026-06-04days on market $119,500 Active 27 DOM
-
2026-06-03days on market $119,500 Active 26 DOM
-
2026-06-02days on market $119,500 Active 25 DOM
-
2026-06-01days on market $119,500 Active 24 DOM
-
2026-05-31days on market $119,500 Active 23 DOM
-
2026-05-08$119,500 Active
-
2018-06-13soldstatus $94,000
-
2018-04-14status Pending 115-char remark
Show marketing remark (115 chars)
Property is a 2 bedroom, 2 bathroom condo. located on first floor and corner unit. Has screened/covered back patio.
-
2018-04-13soldstatus $47,000 Sold 115-char remark
Show marketing remark (115 chars)
Property is a 2 bedroom, 2 bathroom condo. located on first floor and corner unit. Has screened/covered back patio.
-
2018-03-23status Pending 115-char remark
Show marketing remark (115 chars)
Property is a 2 bedroom, 2 bathroom condo. located on first floor and corner unit. Has screened/covered back patio.
-
2018-03-23status Pending 115-char remark
Show marketing remark (115 chars)
Property is a 2 bedroom, 2 bathroom condo. located on first floor and corner unit. Has screened/covered back patio.
-
2018-03-23status Pending 115-char remark
Show marketing remark (115 chars)
Property is a 2 bedroom, 2 bathroom condo. located on first floor and corner unit. Has screened/covered back patio.
-
2018-02-28$49,900 Active 115-char remark
Show marketing remark (115 chars)
Property is a 2 bedroom, 2 bathroom condo. located on first floor and corner unit. Has screened/covered back patio.
ⓘ Source: listings_history table (triggers on properties + properties_extension) + one-shot
backfill from property_details.listing_events for pre-trigger history.
Tax reassessment forecast FL · Resets to sale price
- Current annual tax
- $1,851 · $154/mo
- Projected year-2 tax
- $1,851 · $154/mo
- Expected delta
- $0/yr ($0/mo · 0.0%)
ⓘ Screening estimate from a state-policy table — verify with the county assessor before closing.
Climate risk First Street
- Flood 1/10 Low FEMA zone X (unshaded) · 0% chance over 30 yrs
- Wildfire 4/10 Moderate
- Heat 10/10 Extreme 7 d/yr ≥108°F today · 26 d/yr by 30 yrs out
- Wind 10/10 Extreme 99% chance of damaging wind over 30 yrs
- Air quality 2/10 Low 1 unhealthy d/yr today · 3 by 30 yrs out
Nearby sold comps map
Loading sold comps map…
Walkable amenities ~0.75 mi
Loading nearby amenities…
Taxation est. · year 1
- Rental income
- $24,105
- − Mortgage interest
- −$6,694
- − Property taxes
- −$1,851
- − Insurance
- −$598
- − Repairs & maintenance
- −$1,928
- − Management
- −$1,928
- − HOA
- −$5,688
- − Depreciation
- −$3,476
- Taxable income
- $1,942
- Est. tax owed @ 24.0%
- −$466
- After-tax cash flow
- $2,921/yr
For passive investors: Depreciation is non-cash, so a rental often shows a tax loss while cash-flowing — sheltering income. Rental losses are passive: they offset passive income freely, and up to $25,000/yr can offset ordinary (W-2) income if you actively participate and your MAGI is under $100k (phasing out to $0 by $150k); unused losses carry forward. On sale, claimed depreciation is recaptured at up to 25%, and gains may owe capital-gains tax (a 1031 exchange can defer both). Figures are a year-1 estimate at your 24.0% rate — not tax advice; consult a CPA.
Schools (NCES district)
- District
- Pasco
- NCES district ID
- 1201530
- Math proficiency
- 50% ▼ -10.00%
- Reading proficiency
- 52% ▼ -5.00%
- Median HH income
- $45,039
- Composite
- 43.14/100
- National rank
- #3074
- State rank
- #32 of 73 in FL
Livability — Moon Lake
- Score
- 56/100
- State rank
- #871
- US rank
- #22850
Category grades
Schools grade is shown separately in the Schools card above.
Census & demographics
- County
- Pasco County · 524,098 people
- Metro
- Tampa-St. Petersburg-Clearwater, FL
- Population (ZIP)
- 24,355
- Household income
- $73,947
- Rent vs Own
- Severe rent burden
- 179.0
Population outlook (Pasco County) Hauer SSP2
- Today (2025)
- 570,045 people
- By 2030
- 605,844 · +6.3%
- By 2040
- 674,806 · +18.4%
- By 2050
- 736,022 · +29.1%
- By 2075
- 862,900 · +51.4%
- By 2100
- 906,364 · +59.0%
Race, ethnicity, and origin ACS 2023
- Neighborhood character
- Predominantly White (81%)
- Race & ethnicity
- White 81% Hispanic / Latino 10% Two or more races 7% Black 3% Asian 2%
- Hispanic origin (detail)
- Puerto Rican 6%
- Common ancestry
- Romanian 4% Slovak 2% Italian 2%
- Foreign-born
- 7% · Canada, China, Jamaica
- Languages at home
- 88% English-only · Spanish 5% Russian/Polish/Slavic 2% Other Indo-European 1%
Political lean MEDSL · Pasco
- 2024 margin
- Strong R (+25.2) · D 36.9% · R 62.1% · Other 1.0%
- 2008→2024 swing
- -21.6pp toward R · 2008: -3.6pp · 2024: -25.2pp
- All cycles
- 2024: R+25.2 2020: R+20.1 2016: R+21.6 2012: R+6.7 2008: R+3.6
Not yet ingested
- Civics
- —
Market trends
- HPI YoY
- ▼ -42.63%
- Current HPI
- 294.4358
- Rent YoY
- ▼ -1.85%
- Metro
- Tampa-St. Petersburg-Clearwater, FL
- State GDP YoY
- ▲ 3.28%
- F500 in state
- 36
Industry mix (Fortune 500 HQ in FL)
| Industry | F500 HQs | Revenue |
|---|---|---|
| Industrial Technology | 2 | $29B |
|
||
| Insurance | 2 | $17B |
|
||
| Retail | 1 | $60B |
|
||
| Technology Distribution | 1 | $58B |
|
||
| Homebuilding | 1 | $35B |
|
||
| Technology Manufacturing | 1 | $35B |
|
||
Price history
+139.5% since first listed8 events — show timeline
- 2026-05-08 Listed $119,500 Stellar MLS as Distributed by MLS Grid
- 2018-06-13 Sold (Public Records) $94,000 Public Records
- 2018-04-14 Pending — Stellar MLS as Distributed by MLS Grid
- 2018-04-13 Sold (MLS) $47,000 Stellar MLS as Distributed by MLS Grid
- 2018-03-23 Pending — Stellar MLS as Distributed by MLS Grid
- 2018-03-23 Pending — Stellar MLS as Distributed by MLS Grid
- 2018-03-23 Pending — Stellar MLS as Distributed by MLS Grid
- 2018-02-28 Listed $49,900 Stellar MLS as Distributed by MLS Grid
Property tax history
+25.7%/yrLatest (2025): $1,851 · +3.8% YoY. Source: county tax records.
Cash-flow waterfall
monthlySold comps — $/sqft
last 12 mo · ≤1 miLoading sold comps…