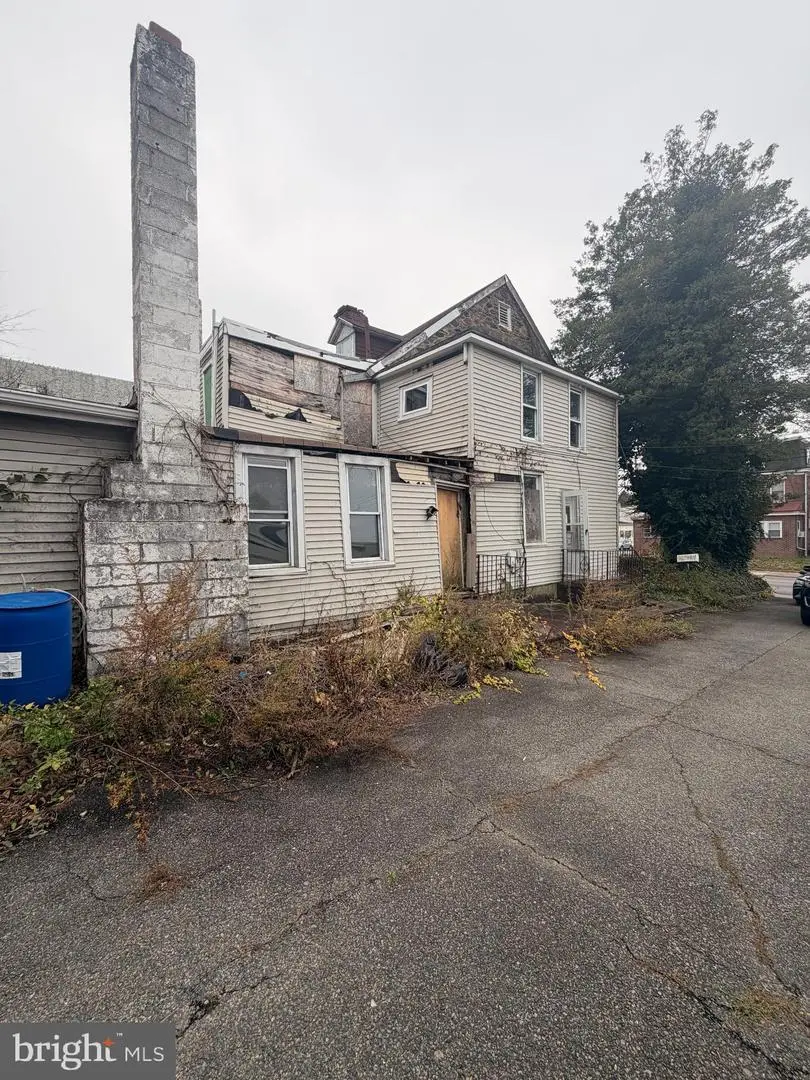
1125 Main St · Darby, PA
Flood risk 1/10 · Minimal
- FEMA flood zone
- X (unshaded)
- Chance of flooding over 30 yrs
- 0.0%
- Est. flood insurance / yr
- $507 – $1,088
Fire risk 1/10 · Minimal
- Est. fire insurance / yr
- $511 – $949
Heat risk 7/10 · Major
- Hot days now (above 103°F)
- 7 days/yr
- Hot days in 30 yrs
- 15 days/yr
Wind risk 6/10 · Moderate
- Chance of severe wind over 30 yrs
- 27.0%
Air-quality risk 4/10 · Minor
- Unhealthy air days now
- 3 days/yr
- Unhealthy air days in 30 yrs
- 6 days/yr
Risk factors via First Street. Map © Google.
Why this score? — see what drove the B grade
The composite is a weighted blend of 9 inputs, each scored 0–100. Each bar is that input's sub-score; the figure is the points it added to the 100-point composite (weight × sub-score).
- Cash flow +30.0/30.0
- 1% rule +10.0/10.0
- DSCR +10.0/10.0
- ARV discount +7.5/15.0
- Rent growth +5.0/5.0
- Livability +3.7/5.0
- Condition / age +2.5/5.0
- Schools +1.7/10.0
- Appreciation +0.0/10.0
$140,000
🖨 Deal sheet 📄 Offer letter ✓ Due diligence
Listing remarks MLS
Calling all investors or rehab buyers! Main Street property ready for full transformation. Home is being sold AS-IS with no repairs or credits. Buyer is responsible for all township resale requirements, including but not limited to Certificate of Occupancy / Use & Occupancy, sewer lateral inspection, and any required repairs or certifications. Property requires major work - not suitable for traditional financing. Cash or rehab loan offers preferred. Proof of funds required. All information, including square footage and lot size, is approximate. Buyer to verify all information. Entry is at buyer's sole risk. Property contains unsafe conditions.
Key facts
- 3 parking spots
- Built 1772
- Listed 183 days
Neighborhood map
What this means for you Summary
Snapshot
- This is a 4-bed/1.5-bath single-family listed at $140k.
Deal economics
- At list price, monthly cash flow is $553 ($7k/yr) — positive.
- The deal already cash-flows at list — no discount required.
- Meets the 1% rule at list price ($2k rent vs $140k).
- Recommended offer: $123k (12.0% below list) — sets the bar for market timing.
- Cap rate 11.0% vs local median 6.3% in Darby — top-decile yield for the area; either an underpriced asset or a hidden risk that comps aren't pricing in. Stress-test before assuming the spread holds.
Location & tenants
- Location reads 74/100 on livability (#485 in PA, #4,468 nationally) — a middle-class / working-renter tenant base. Strengths: commute A+, cost of living A+, housing A+; Watch: amenities D+, employment D, schools F.
- William Penn SD (suburban): math 11% / reading 28% proficiency, ranked #491 of 539 in PA (top 91%) — low school quality limits family demand, transient renter base, plan for 1-2y turnover; 69% free/reduced lunch — lower-income household profile, screen leases tightly.
- Market conditions: Rents rising fast (+13.1%/yr); 99 active listings in the ZIP; 4 comparable units currently listed for rent nearby; rentals at typical pace (median 24d on market — plan ~3-4 weeks tenant-placement turnaround); 299 units permitted in Delaware County in 2024 (5 in 5+ unit buildings).
- At $2,206/mo this rent would consume 57% of the median local household income ($46k/yr) (locally 1468% of renters already pay >50% of income on rent) — very limited rent-growth headroom before tenants either downsize or default.
Forward outlook
- Local home prices are declining (-3.0%/yr); year-one equity from $968 of loan paydown is wiped out by about $4k of value loss. Plan a longer hold.
- At projected returns (-3.0% appreciation + 8.0% rent growth), your $39k cash investment doubles in ~6 years — after that, you're playing with house money.
Negotiation context
- It's been on market 183 days — a 12% lower offer ($123k) is reasonable based on typical stale-listing flexibility.
- 7 sale attempts since 31y ago; this cycle's ask has dropped $60k (30%) from the opening price — seller is motivated, your offer sets the floor, not the list.
- Current owner paid $16k; list at $140k implies a 775% gain — meaningful room to come down on a strong offer.
Risks & watch-outs
- Watch-outs: property tax is 3.4% of price; built in 1772 — expect roof / HVAC / electrical / plumbing capex.
- Climate carrying-cost: major wind risk, 27% chance of damaging wind over 30y; extreme-heat days projected 7→15/yr by 2055 (HVAC capex compounding) — expect insurance premiums to compound above CPI over the hold.
Questions for the listing agent
- It's been on market 183 days. Have you received any prior offers? Is the seller open to a 12% concession, seller financing, or rate buy-down credit?
- Built in 1772 — when were the roof, HVAC, electrical panel, plumbing, and water heater last replaced?
- Property tax is high relative to price — has the assessment been appealed recently, and will the sale trigger a re-assessment?
- Why hasn't it sold? Are there any deal-killer items the seller is aware of (foundation, flood, title, zoning, code violations)?
- Is there a deadline driving the sale (1031 exchange, divorce, estate, relocation)? That informs how much negotiation room exists.
- Schools are F-rated, which usually means shorter tenancies and higher turnover. Who's the typical renter profile here, and what's been the actual vacancy rate?
- Crime grade is F in this area — have there been break-ins, vandalism, or insurance claims at this property in the last 3 years? What carrier currently insures it and at what premium?
- What's the average days-on-market for RENTAL listings here right now (not sales)? A rising rental-DOM trend means longer vacancies and softer asking-rent achievability than the comps imply.
- What's the recent tenant-quality profile in this submarket — average credit score on applications, eviction rate, late-payment / NSF rate, and stable-employment percentage? A property-management company in the area should have these aggregated.
- How much new for-sale + rental construction is in the pipeline within 1–3 miles? Heavy new supply typically softens prices + rents 12–24 months out; constrained supply supports both.
Investment metrics
- 1% rule
- 1.58% ✓
- Cap rate
- 11.03%
- Cash-on-cash
- 16.92%
- DSCR
- 1.75
- GRM
- 5.3
CMA / ARV
- ARV (median comp)
- $294,121
- List price
- $140,000
- Delta
- -52.40%
- Verdict
- UNDERPRICED
- Comps
- 20 within 1.0 mi
Show comp detail 4 sales within ~0.75 mi
| Address | Dist | Beds/Ba | Sqft | Sold | Price | $/sf | Match |
|---|---|---|---|---|---|---|---|
| 439 Beechwood Ave | 0.63mi | 4/2.0 | 2,364 (-4%) | 5mo | $290,000 | $123 | 58 |
| 12 Golf Rd | 0.33mi | 4/1.5 | 2,202 (-11%) | 15mo | $370,000 | $168 | 55 |
| 30 Elder Ave | 0.62mi | 4/3.0 | 2,164 (-12%) | 9mo | $340,000 | $157 | 37 |
| 201 Elder Ave | 0.74mi | 4/2.0 | 2,125 (-14%) | 6mo | $385,000 | $181 | 35 |
Match score weights: distance 35% · size 25% · config 20% · recency 20%. Top-matched comps best support the ARV.
Projected returns pro-forma
-3.0% appreciation · 8.0% rent growth · sell at horizon
- IRR
- 14.5%
- Equity multiple
- 1.62×
- Total profit
- $24,348
- Equity at exit
- $20,874
- IRR
- 27.2%
- Equity multiple
- 4.07×
- Total profit
- $120,282
- Equity at exit
- $12,105
Cash invested: $39,200 (down + closing). Projections, not guarantees.
Landlord ↔ Tenant lean methodology
- Overall (STATE)
- 62 Landlord-Friendly
- State Pennsylvania
- 62 Landlord-Friendly · EVEN
- County
- — inherits STATE
- City
- — inherits STATE
ZIP-level market 19023
- Rents YoY
- 13.1%
- Active inventory
- 99
- Price-to-rent
- 5.3×
Monthly cashflow live
- Estimated rent
- $2,206 medium interval (Pro) →
- Mortgage (P&I)
- −$734
- Tax from tax record
- −$397 /mo · $4,767/yr
- Insurance
- −$58
- HOA
- −$0
- Vacancy / Maint / Mgmt
- −$463
- Net cashflow
- $553
Break-even live
UW: 25.0% down · 7.5% · 30yr · 1.5% tax · 5.0% vac · 8.0% maint · 8.0% mgmt
Financing live
Cash to close
- Down payment
- $35,000
- Closing costs
- $4,200
- Reserves months
- —
- Total cash needed
- —
Loan-product check · same deal, 3 products live
Conventional
25% down · 7.5% · 30yr
- Down + closing
- —
- Monthly P&I
- —
- Monthly cashflow
- —
- DSCR
- —
- Eligible?
- —
Personal DTI + credit; lowest rate.
DSCR
20% down · 8.5% · 30yr
- Down + closing
- —
- Monthly P&I
- —
- Monthly cashflow
- —
- DSCR
- —
- Eligible?
- —
No personal income docs; deal must DSCR.
Hard money
10% down · 12.0% · 12mo
- Down + closing
- —
- Monthly P&I
- —
- Monthly cashflow
- —
- DSCR
- —
- Eligible?
- —
Short-term bridge; refi at stabilization.
Rent comps 4 comps
| Address | Beds | Baths | Sqft | Rent | $/sqft | DOM | Units | Dist |
|---|---|---|---|---|---|---|---|---|
| 220 N 9th St Darby, PA | 5.0 | 1.5 | 1600 | $2,800 | $1.75 | 5d | 1 | 0.38mi |
| 94 S 6th St Darby, PA | 3.0 | 1.5 | 1666 | $2,000 | $1.20 | 24d | 1 | 0.59mi |
| 304 S 3rd St Darby, PA | 3.0 | 1.0 | 1602 | $1,595 | $1.00 | 20d | 1 | 0.86mi |
| 304 S 3rd St Darby, PA | 3.0 | 1.0 | 1602 | $1,695 | $1.06 | 43d | 1 | 0.86mi |
Listing history 21 events
-
2026-06-02days on market $140,000 Active 183 DOM
-
2026-06-01days on market $140,000 Active 182 DOM
-
2026-05-31days on market $140,000 Active 181 DOM
-
2026-03-01price $140,000 657-char remark
Show marketing remark (657 chars)
Calling all investors or rehab buyers! Main Street property ready for full transformation. Home is being sold AS-IS with no repairs or credits. Buyer is responsible for all township resale requirements, including but not limited to Certificate of Occupancy / Use & Occupancy, sewer lateral inspection, and any required repairs or certifications. Property requires major work - not suitable for traditional financing. Cash or rehab loan offers preferred. Proof of funds required. All information, including square footage and lot size, is approximate. Buyer to verify all information. Entry is at buyer's sole risk. Property contains unsafe conditions.
-
2025-12-01$200,000 Active 657-char remark
Show marketing remark (657 chars)
Calling all investors or rehab buyers! Main Street property ready for full transformation. Home is being sold AS-IS with no repairs or credits. Buyer is responsible for all township resale requirements, including but not limited to Certificate of Occupancy / Use & Occupancy, sewer lateral inspection, and any required repairs or certifications. Property requires major work - not suitable for traditional financing. Cash or rehab loan offers preferred. Proof of funds required. All information, including square footage and lot size, is approximate. Buyer to verify all information. Entry is at buyer's sole risk. Property contains unsafe conditions.
-
2015-09-30soldstatus $16,000 Sold 488-char remark
Show marketing remark (488 chars)
Any presale offers should be submitted to Hudson & Marshall by clicking on the Bid Now icon. Bids will be taken during pre and post sale at the website. No minimum starting bid. Properties are subject to a 5 percent buyer's premium with a minimum of 2K and subject to a reserve price as well as seller confirmation. Seller has the right (a) to change the date, place, and terms of the sale; (b) to remove the property from the market; and (c) to sell the property prior to the sale.
-
2015-09-30soldstatus $16,000
Show marketing remark (488 chars)
Any presale offers should be submitted to Hudson & Marshall by clicking on the Bid Now icon. Bids will be taken during pre and post sale at the website. No minimum starting bid. Properties are subject to a 5 percent buyer's premium with a minimum of 2K and subject to a reserve price as well as seller confirmation. Seller has the right (a) to change the date, place, and terms of the sale; (b) to remove the property from the market; and (c) to sell the property prior to the sale.
-
2015-08-24status Under Contract 488-char remark
Show marketing remark (488 chars)
Any presale offers should be submitted to Hudson & Marshall by clicking on the Bid Now icon. Bids will be taken during pre and post sale at the website. No minimum starting bid. Properties are subject to a 5 percent buyer's premium with a minimum of 2K and subject to a reserve price as well as seller confirmation. Seller has the right (a) to change the date, place, and terms of the sale; (b) to remove the property from the market; and (c) to sell the property prior to the sale.
-
2015-08-21historical
-
2015-08-10$16,000 Active 488-char remark
Show marketing remark (488 chars)
Any presale offers should be submitted to Hudson & Marshall by clicking on the Bid Now icon. Bids will be taken during pre and post sale at the website. No minimum starting bid. Properties are subject to a 5 percent buyer's premium with a minimum of 2K and subject to a reserve price as well as seller confirmation. Seller has the right (a) to change the date, place, and terms of the sale; (b) to remove the property from the market; and (c) to sell the property prior to the sale.
-
2015-08-05$16,000
-
1999-01-04soldstatus $75,000
-
1998-04-30historical
-
1998-02-04$69,900
-
1997-08-05$69,900
-
1997-08-05historical
-
1995-11-30$74,900
-
1995-11-30historical
-
1995-04-13$74,900
-
1995-04-13historical
-
1985-08-13soldstatus $20,000
ⓘ Source: listings_history table (triggers on properties + properties_extension) + one-shot
backfill from property_details.listing_events for pre-trigger history.
Tax reassessment forecast PA · Partial reset (capped growth)
- Current annual tax
- $4,767 · $397/mo
- Projected year-2 tax
- $4,767 · $397/mo
- Expected delta
- $0/yr ($0/mo · 0.0%)
ⓘ Screening estimate from a state-policy table — verify with the county assessor before closing.
Climate risk First Street
- Flood 1/10 Low FEMA zone X (unshaded) · 0% chance over 30 yrs
- Wildfire 1/10 Low
- Heat 7/10 Severe 7 d/yr ≥103°F today · 15 d/yr by 30 yrs out
- Wind 6/10 Major 27% chance of damaging wind over 30 yrs
- Air quality 4/10 Moderate 3 unhealthy d/yr today · 6 by 30 yrs out
Nearby sold comps map
Loading sold comps map…
Walkable amenities ~0.75 mi
Loading nearby amenities…
Taxation est. · year 1
- Rental income
- $26,469
- − Mortgage interest
- −$7,842
- − Property taxes
- −$4,767
- − Insurance
- −$700
- − Repairs & maintenance
- −$2,118
- − Management
- −$2,118
- − Depreciation
- −$4,073
- Taxable income
- $4,852
- Est. tax owed @ 24.0%
- −$1,165
- After-tax cash flow
- $5,469/yr
For passive investors: Depreciation is non-cash, so a rental often shows a tax loss while cash-flowing — sheltering income. Rental losses are passive: they offset passive income freely, and up to $25,000/yr can offset ordinary (W-2) income if you actively participate and your MAGI is under $100k (phasing out to $0 by $150k); unused losses carry forward. On sale, claimed depreciation is recaptured at up to 25%, and gains may owe capital-gains tax (a 1031 exchange can defer both). Figures are a year-1 estimate at your 24.0% rate — not tax advice; consult a CPA.
Schools (NCES district)
- District
- William Penn SD
- NCES district ID
- 4226390
- Math proficiency
- 11% ▼ -3.00%
- Reading proficiency
- 28% ▼ -7.00%
- Median HH income
- $48,543
- Composite
- 17.29/100
- National rank
- #9086
- State rank
- #491 of 539 in PA
Livability — Darby
- Score
- 74/100
- State rank
- #485
- US rank
- #4468
Category grades
Schools grade is shown separately in the Schools card above.
Census & demographics
- Census place
- Darby, PA
- County
- Delaware County · 399,863 people
- Metro
- Philadelphia-Camden-Wilmington, PA-NJ-DE-MD
- Population (ZIP)
- 22,247
- Household income
- $46,463
- Rent vs Own
- Severe rent burden
- 1468.0
Population outlook (Delaware County) Hauer SSP2
- Today (2025)
- 577,490 people
- By 2030
- 581,243 · +0.6%
- By 2040
- 584,700 · +1.2%
- By 2050
- 586,581 · +1.6%
- By 2075
- 598,706 · +3.7%
- By 2100
- 590,823 · +2.3%
Race, ethnicity, and origin ACS 2023
- Neighborhood character
- Predominantly Black (76%)
- Race & ethnicity
- Black 76% White 15% Two or more races 5% Hispanic / Latino 3% Asian 2%
- Common ancestry
- Swiss 5% Hispanic 1% Romanian 1%
- Foreign-born
- 18% · Canada
- Languages at home
- 84% English-only · French/Haitian/Cajun 4% Spanish 3% Other Asian/Pacific 1%
Political lean MEDSL · Delaware
- 2024 margin
- Strong D (+23.7) · D 61.4% · R 37.6% · Other 1.0%
- 2008→2024 swing
- +2.3pp toward D · 2008: 21.4pp · 2024: 23.7pp
- All cycles
- 2024: D+23.7 2020: D+26.7 2016: D+22.0 2012: D+21.8 2008: D+21.4
Not yet ingested
- Civics
- —
Market trends
- HPI YoY
- ▼ -190.50%
- Current HPI
- 277.7034
- Rent YoY
- ▲ 13.10%
- Metro
- Philadelphia-Camden-Wilmington, PA-NJ-DE-MD
- State GDP YoY
- ▲ 1.68%
- F500 in state
- 34
Industry mix (Fortune 500 HQ in PA)
| Industry | F500 HQs | Revenue |
|---|---|---|
| Healthcare | 2 | $309B |
|
||
| Insurance | 2 | $27B |
|
||
| Telecommunications / Media | 1 | $124B |
|
||
| Industrial Distribution | 1 | $22B |
|
||
| Financial Services | 1 | $20B |
|
||
| Chemicals / Materials | 1 | $18B |
|
||
Price history
+600.0% since first listed18 events — show timeline
- 2026-03-01 Price Changed $140,000 BRIGHT MLS
- 2025-12-01 Listed $200,000 BRIGHT MLS
- 2015-09-30 Sold (MLS) $16,000 BRIGHT MLS
- 2015-09-30 Sold (MLS) $16,000 TREND
- 2015-08-24 Pending — TREND
- 2015-08-21 Listing Removed — BRIGHT MLS
- 2015-08-10 Listed $16,000 TREND
- 2015-08-05 Listed $16,000 BRIGHT MLS
- 1999-01-04 Sold (Public Records) $75,000 Public Records
- 1998-04-30 Listing Removed — BRIGHT MLS
- 1998-02-04 Listed $69,900 BRIGHT MLS
- 1997-08-05 Listing Removed — BRIGHT MLS
- 1997-08-05 Listed $69,900 BRIGHT MLS
- 1995-11-30 Listing Removed — BRIGHT MLS
- 1995-11-30 Listed $74,900 BRIGHT MLS
- 1995-04-13 Listing Removed — BRIGHT MLS
- 1995-04-13 Listed $74,900 BRIGHT MLS
- 1985-08-13 Sold (Public Records) $20,000 Public Records
Property tax history
+0.1%/yrLatest (2026): $4,767 · -0.5% YoY. Source: county tax records.
Cash-flow waterfall
monthlySold comps — $/sqft
last 12 mo · ≤1 miLoading sold comps…