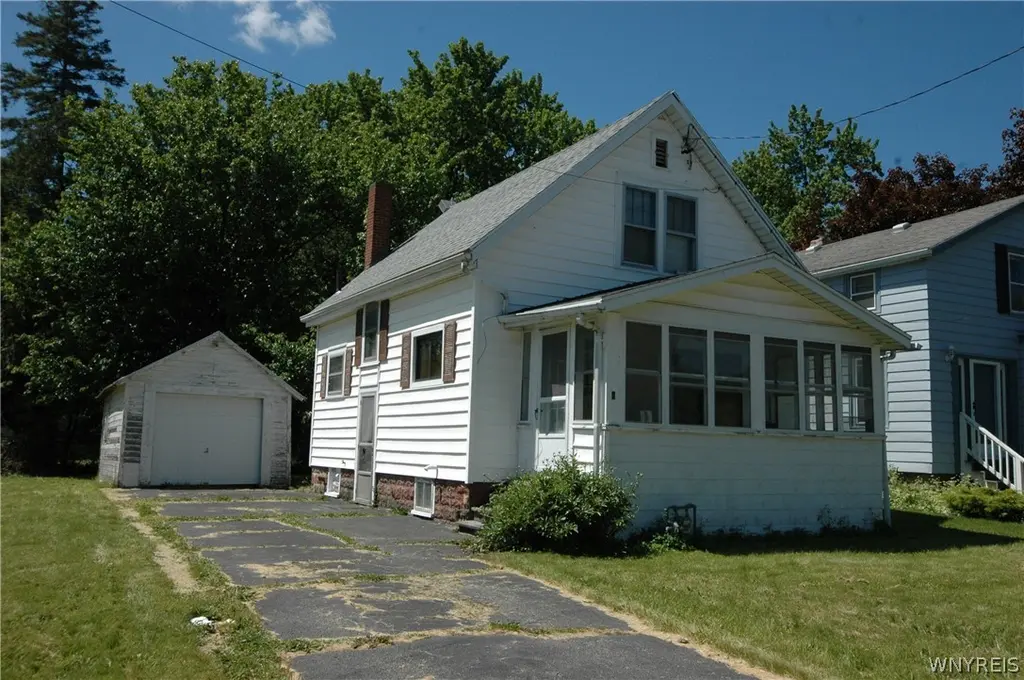
8 Denio St · Batavia, NY
Flood risk 1/10 · Minimal
- FEMA flood zone
- X
- Chance of flooding over 30 yrs
- 0.0%
- Est. flood insurance / yr
- $473 – $860
Fire risk 3/10 · Minor
- Est. fire insurance / yr
- $691 – $1,283
Heat risk 2/10 · Minimal
- Hot days now (above 95°F)
- 7 days/yr
- Hot days in 30 yrs
- 16 days/yr
Wind risk 1/10 · Minimal
- Chance of severe wind over 30 yrs
- —
Air-quality risk 2/10 · Minimal
- Unhealthy air days now
- 1 days/yr
- Unhealthy air days in 30 yrs
- 2 days/yr
Risk factors via First Street. Map © Google.
Why this score? — see what drove the B- grade
The composite is a weighted blend of 9 inputs, each scored 0–100. Each bar is that input's sub-score; the figure is the points it added to the 100-point composite (weight × sub-score).
- Cash flow +30.0/30.0
- 1% rule +10.0/10.0
- DSCR +10.0/10.0
- ARV discount +7.5/15.0
- Schools +3.7/10.0
- Livability +3.4/5.0
- Rent growth +2.5/5.0
- Condition / age +2.5/5.0
- Appreciation +0.0/10.0
$70,000
🖨 Deal sheet 📄 Offer letter ✓ Due diligence
Listing remarks
This great starter home is begging for someone to love it! Yes, you will need to bring your paint brush and go to town but what a buy! Extra wide lot provides room for a garden or family fun on top of the privacy of the back yard. When you see this home you will say “An EXCEPTIONAL value for the money!” Open house dates: Sunday 6/7/26 2:00-4:00 p. m. and Tuesday 6/9/26 5:00 – 7:00 p. m. Delayed showings begin Sunday 6/7/26 at 2:00 p. m. Delayed negotiations commence 6/14/26 at noon
Key facts
- Extra wide lot
- 9,503 sq ft lot
- Garage
Tags
Property features AI
Exterior
- Parking: Detached garage; 1-car garage
- Utilities: Electricity connected; Public water connected; Sewer connected
- Home design: Single-story; Existing construction; Resale property
- Construction: Vinyl siding; Block foundation
- Exterior features: Blacktop driveway; Near public transit; Rectangular lot (80 x 118)
Interior
- Kitchen: Gas water heater
- Bedrooms: Total of 5 rooms (includes living areas)
- Flooring: Carpet; Varies
- Bathrooms: 1 full bathroom
- Heating & cooling: Gas forced air heating; Heating present
- Interior features: Eat-in kitchen; Separate/formal living room; Full basement
Neighborhood map
What this means for you Summary
Snapshot
- This is a 3-bed/1.0-bath single-family listed at $70k.
Deal economics
- At list price, monthly cash flow is $523 ($6k/yr) — positive.
- The deal already cash-flows at list — no discount required.
- Meets the 1% rule at list price ($1k rent vs $70k).
- Cap rate 15.3% vs local median 5.5% in Batavia — top-decile yield for the area; either an underpriced asset or a hidden risk that comps aren't pricing in. Stress-test before assuming the spread holds.
Location & tenants
- Location reads 68/100 on livability (#536 in NY) — a middle-class / working-renter tenant base. Strengths: cost of living A+, housing A+, health & safety A; Watch: employment C-, crime D+, amenities F.
- Batavia City School District (town): math 38% / reading 50% proficiency, ranked #477 of 590 in NY (top 81%) — families likely to look elsewhere, expect single-tenant / working-renter base with shorter leases.
- Market conditions: 89 active listings in the ZIP; 5 comparable units currently listed for rent nearby; rentals leasing fast (median 2d on market — plan ~1-2 weeks tenant-placement turnaround); 55 units permitted in Genesee County in 2024 (0 in 5+ unit buildings).
Forward outlook
- Local home prices are declining (-3.0%/yr); year-one equity from $484 of loan paydown is wiped out by about $2k of value loss. Plan a longer hold.
- Genesee County population projected at -22% by 2050 — secular population decline; favor cash flow + early exit over multi-decade hold.
- At projected returns (-3.0% appreciation + 3.0% rent growth), your $20k cash investment doubles in ~4 years — after that, you're playing with house money.
Negotiation context
- Only 14 days on market — expect competitive offers; lowballing is unlikely to land.
Risks & watch-outs
- Watch-outs: property tax is 2.9% of price; built in 1938 — expect roof / HVAC / electrical / plumbing capex.
Questions for the listing agent
- Built in 1938 — when were the roof, HVAC, electrical panel, plumbing, and water heater last replaced?
- Property tax is high relative to price — has the assessment been appealed recently, and will the sale trigger a re-assessment?
- Is there a deadline driving the sale (1031 exchange, divorce, estate, relocation)? That informs how much negotiation room exists.
- Schools are B-rated — typically a magnet for longer-tenancy family renters. What's the average tenant stay here, and is there a school-zone premium baked into asking?
- Crime grade is D in this area — have there been break-ins, vandalism, or insurance claims at this property in the last 3 years? What carrier currently insures it and at what premium?
- What's the average days-on-market for RENTAL listings here right now (not sales)? A rising rental-DOM trend means longer vacancies and softer asking-rent achievability than the comps imply.
- What's the recent tenant-quality profile in this submarket — average credit score on applications, eviction rate, late-payment / NSF rate, and stable-employment percentage? A property-management company in the area should have these aggregated.
- How much new for-sale + rental construction is in the pipeline within 1–3 miles? Heavy new supply typically softens prices + rents 12–24 months out; constrained supply supports both.
Investment metrics
- 1% rule
- 1.96% ✓
- Cap rate
- 15.25%
- Cash-on-cash
- 32.00%
- DSCR
- 2.42
- GRM
- 4.2
CMA / ARV
- ARV (on-the-fly)
- $149,481
- Comps found
- 12
Show comp detail 12 sales within ~0.75 mi
| Address | Dist | Beds/Ba | Sqft | Sold | Price | $/sf | Match |
|---|---|---|---|---|---|---|---|
| 16 Chandler Ave | 0.36mi | 3/1.0 | 954 (-2%) | 1mo | $225,000 | $236 | 78 |
| 286 Bank St | 0.27mi | 3/1.0 | 944 (-3%) | 22mo | $185,000 | $196 | 64 |
| 132 Tracy Ave | 0.23mi | 3/1.0 | 1,076 (+10%) | 15mo | $135,000 | $125 | 60 |
| 282 Ross St | 0.37mi | 3/1.5 | 1,076 (+10%) | 6mo | $195,000 | $181 | 59 |
| 175 Summit St | 0.38mi | 3/1.0 | 1,078 (+10%) | 10mo | $165,000 | $153 | 57 |
| 56 Columbia Ave | 0.57mi | 2/1.0 (-1) | 936 (-4%) | 8mo | $137,000 | $146 | 55 |
| 229 Bank St | 0.18mi | 3/1.5 | 1,120 (+15%) | 18mo | $149,350 | $133 | 51 |
| 42 Porter Ave | 0.63mi | 3/1.0 | 1,100 (+13%) | 2mo | $120,000 | $109 | 48 |
| 211 North St | 0.41mi | 3/1.5 | 1,077 (+10%) | 19mo | $187,000 | $174 | 46 |
| 55 Columbia Ave | 0.56mi | 3/1.0 | 1,120 (+15%) | 11mo | $85,000 | $76 | 40 |
| 65 Columbia Ave | 0.54mi | 2/1.0 (-1) | 864 (-12%) | 19mo | $142,000 | $164 | 35 |
| 21 Manhattan Ave | 0.54mi | 4/1.5 (+1) | 1,107 (+13%) | 21mo | $139,900 | $126 | 28 |
Match score weights: distance 35% · size 25% · config 20% · recency 20%. Top-matched comps best support the ARV.
Projected returns pro-forma
-3.0% appreciation · 3.0% rent growth · sell at horizon
- IRR
- 27.0%
- Equity multiple
- 2.12×
- Total profit
- $22,016
- Equity at exit
- $10,437
- IRR
- 34.6%
- Equity multiple
- 4.18×
- Total profit
- $62,318
- Equity at exit
- $6,052
Cash invested: $19,600 (down + closing). Projections, not guarantees.
Landlord ↔ Tenant lean methodology
- Overall (STATE)
- 15 Strongly Tenant-Friendly
- State New York
- 15 Strongly Tenant-Friendly · D+10
- County
- — inherits STATE
- City
- — inherits STATE
ZIP-level market 14020
- Home prices YoY
- -10.4%
- Active inventory
- 89
- Price-to-rent
- 4.2×
Monthly cashflow live
- Estimated rent
- $1,374 high interval (Pro) →
- Mortgage (P&I)
- −$367
- Tax from tax record
- −$166 /mo · $1,996/yr
- Insurance
- −$29
- HOA
- −$0
- Vacancy / Maint / Mgmt
- −$288
- Net cashflow
- $523
Break-even live
UW: 25.0% down · 7.5% · 30yr · 1.5% tax · 5.0% vac · 8.0% maint · 8.0% mgmt
Financing live
Cash to close
- Down payment
- $17,500
- Closing costs
- $2,100
- Reserves months
- —
- Total cash needed
- —
Loan-product check · same deal, 3 products live
Conventional
25% down · 7.5% · 30yr
- Down + closing
- —
- Monthly P&I
- —
- Monthly cashflow
- —
- DSCR
- —
- Eligible?
- —
Personal DTI + credit; lowest rate.
DSCR
20% down · 8.5% · 30yr
- Down + closing
- —
- Monthly P&I
- —
- Monthly cashflow
- —
- DSCR
- —
- Eligible?
- —
No personal income docs; deal must DSCR.
Hard money
10% down · 12.0% · 12mo
- Down + closing
- —
- Monthly P&I
- —
- Monthly cashflow
- —
- DSCR
- —
- Eligible?
- —
Short-term bridge; refi at stabilization.
Rent comps 5 comps
| Address | Beds | Baths | Sqft | Rent | $/sqft | DOM | Units | Dist |
|---|---|---|---|---|---|---|---|---|
| 224 State St Batavia, NY | 2.0 | 1.0 | 1000 | $1,150 | $1.15 | 1d | 1 | 0.16mi |
| 219 N Spruce St Batavia, NY | 2.0 | 1.0 | 1007 | $1,230 | $1.22 | 43d | 1 | 0.70mi |
| 10 Woodstock Gdns Unit 10 Batavia, NY | 2.0 | 1.0 | 1007 | $1,230 | $1.22 | 1d | 1 | 0.71mi |
| 115 Woodstock Gdns Unit 115 Batavia, NY | 2.0 | 1.0 | 1007 | $1,230 | $1.22 | 10d | 1 | 0.74mi |
| 105 Main St Unit 2 Batavia, NY | 2.0 | 2.0 | 950 | $2,100 | $2.21 | 1d | 1 | 0.81mi |
Listing history 11 events
-
2026-06-16status $70,000 Pending 14 DOM
-
2026-06-15days on market $70,000 Active 14 DOM
-
2026-06-14days on market $70,000 Active 12 DOM
-
2026-06-12days on market $70,000 Active 11 DOM
-
2026-06-09days on market $70,000 Active 8 DOM
-
2026-06-08days on market $70,000 Active 7 DOM
-
2026-06-07days on market $70,000 Active 6 DOM
-
2026-06-07days on market $70,000 Active 5 DOM
-
2026-06-04days on market $70,000 Active 2 DOM
-
2026-06-01remarks 489-char remark
-
2026-06-01$70,000 Active 1 DOM
ⓘ Source: listings_history table (triggers on properties + properties_extension) + one-shot
backfill from property_details.listing_events for pre-trigger history.
Tax reassessment forecast NY · Partial reset (capped growth)
- Current annual tax
- $1,996 · $166/mo
- Projected year-2 tax
- $1,996 · $166/mo
- Expected delta
- $0/yr ($0/mo · 0.0%)
ⓘ Screening estimate from a state-policy table — verify with the county assessor before closing.
Climate risk First Street
- Flood 1/10 Low FEMA zone X · 0% chance over 30 yrs
- Wildfire 3/10 Moderate
- Heat 2/10 Low 7 d/yr ≥95°F today · 16 d/yr by 30 yrs out
- Wind 1/10 Low
- Air quality 2/10 Low 1 unhealthy d/yr today · 2 by 30 yrs out
Nearby sold comps map
Loading sold comps map…
Walkable amenities ~0.75 mi
Loading nearby amenities…
Taxation est. · year 1
- Rental income
- $16,485
- − Mortgage interest
- −$3,921
- − Property taxes
- −$1,996
- − Insurance
- −$350
- − Repairs & maintenance
- −$1,319
- − Management
- −$1,319
- − Depreciation
- −$2,036
- Taxable income
- $5,544
- Est. tax owed @ 24.0%
- −$1,331
- After-tax cash flow
- $4,942/yr
For passive investors: Depreciation is non-cash, so a rental often shows a tax loss while cash-flowing — sheltering income. Rental losses are passive: they offset passive income freely, and up to $25,000/yr can offset ordinary (W-2) income if you actively participate and your MAGI is under $100k (phasing out to $0 by $150k); unused losses carry forward. On sale, claimed depreciation is recaptured at up to 25%, and gains may owe capital-gains tax (a 1031 exchange can defer both). Figures are a year-1 estimate at your 24.0% rate — not tax advice; consult a CPA.
Schools (NCES district)
- District
- Batavia City School District
- NCES district ID
- 3603990
- Math proficiency
- 38% ▼ -13.00%
- Reading proficiency
- 50% ▲ 4.00%
- Median HH income
- $43,288
- Composite
- 37.13/100
- National rank
- #4490
- State rank
- #477 of 590 in NY
Livability — Batavia
- Score
- 68/100
- State rank
- #536
- US rank
- #9660
Category grades
Schools grade is shown separately in the Schools card above.
Census & demographics
- Census place
- Batavia, NY
- County
- Genesee County · 22,002 people
- City population
- 22,002
- Metro
- Batavia, NY
- Population (ZIP)
- 22,002
- Household income
- $62,655
- Rent vs Own
- Severe rent burden
- 817.0
Population outlook (Genesee County) Hauer SSP2
- Today (2025)
- 56,113 people
- By 2030
- 54,140 · -3.5%
- By 2040
- 49,368 · -12.0%
- By 2050
- 43,911 · -21.7%
- By 2075
- 32,511 · -42.1%
- By 2100
- 21,695 · -61.3%
Race, ethnicity, and origin ACS 2023
- Neighborhood character
- Predominantly White (87%)
- Race & ethnicity
- White 87% Two or more races 6% Hispanic / Latino 4% Black 3% Asian 1%
- Common ancestry
- Romanian 11% Lithuanian 2% Slovak 2%
- Foreign-born
- 4% · Canada, China
- Languages at home
- 95% English-only · Spanish 3% Chinese 1%
Political lean MEDSL · Genesee
- 2024 margin
- Solid R (+34.0) · D 33.0% · R 67.0%
- 2008→2024 swing
- -15.6pp toward R · 2008: -18.4pp · 2024: -34.0pp
- All cycles
- 2024: R+34.0 2020: R+31.7 2016: R+37.0 2012: R+20.9 2008: R+18.4
Not yet ingested
- Civics
- —
Market trends
- HPI YoY
- ▼ -30.58%
- Current HPI
- 263.2147
- Rent YoY
- —
- Metro
- Batavia, NY
- State GDP YoY
- ▲ 2.60%
- F500 in state
- 92
Industry mix (Fortune 500 HQ in NY)
| Industry | F500 HQs | Revenue |
|---|---|---|
| Financial Services | 10 | $950B |
|
||
| Consumer Goods | 9 | $162B |
|
||
| Insurance | 4 | $225B |
|
||
| Telecommunications | 2 | $144B |
|
||
| Pharmaceuticals | 2 | $112B |
|
||
| Media / Entertainment | 2 | $69B |
|
||
Price history
1 event — show timeline
- 2026-06-01 Listed $70,000 WNYREIS
Property tax history
-3.6%/yrLatest (2025): $1,996 · -46.2% YoY. Source: county tax records.
Cash-flow waterfall
monthlySold comps — $/sqft
last 12 mo · ≤1 miLoading sold comps…