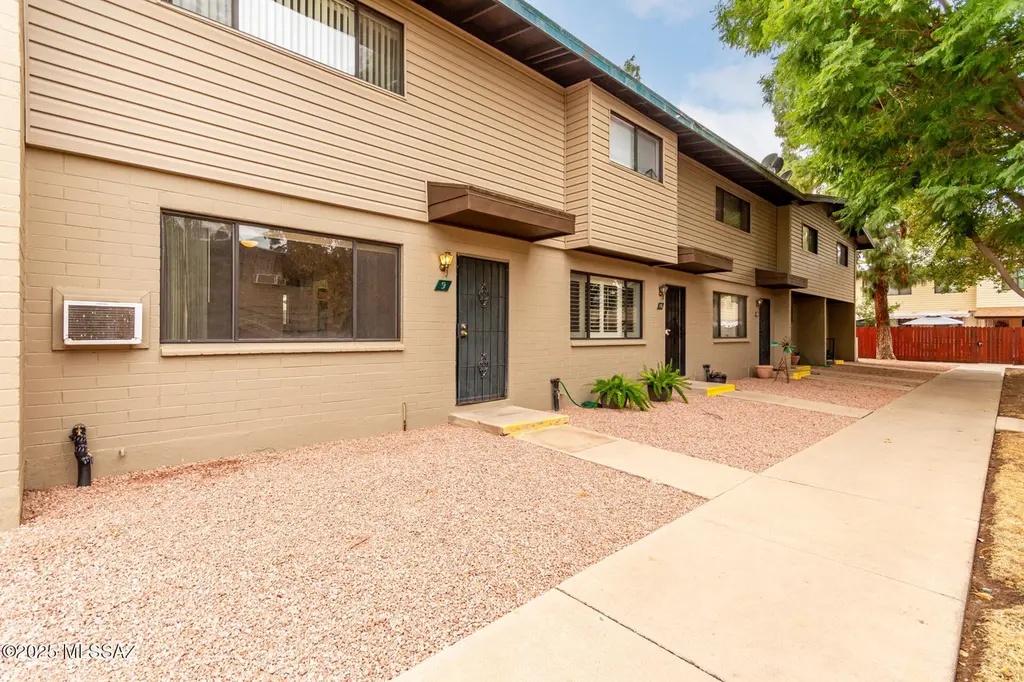
1330 S Avenida Polar Unit E-9 · Tucson, AZ
Flood risk 1/10 · Minimal
- FEMA flood zone
- X (unshaded)
- Chance of flooding over 30 yrs
- 0.0%
- Est. flood insurance / yr
- $507 – $1,088
Fire risk 1/10 · Minimal
- Est. fire insurance / yr
- $610 – $1,132
Heat risk 7/10 · Major
- Hot days now (above 105°F)
- 4 days/yr
- Hot days in 30 yrs
- 11 days/yr
Wind risk 1/10 · Minimal
- Chance of severe wind over 30 yrs
- —
Air-quality risk 1/10 · Minimal
- Unhealthy air days now
- 0 days/yr
- Unhealthy air days in 30 yrs
- 0 days/yr
Risk factors via First Street. Map © Google.
Why this score? — see what drove the B+ grade
The composite is a weighted blend of 9 inputs, each scored 0–100. Each bar is that input's sub-score; the figure is the points it added to the 100-point composite (weight × sub-score).
- Cash flow +30.0/30.0
- ARV discount +15.0/15.0
- 1% rule +10.0/10.0
- DSCR +10.0/10.0
- Livability +3.7/5.0
- Rent growth +2.9/5.0
- Condition / age +2.5/5.0
- Schools +1.6/10.0
- Appreciation +0.0/10.0
$99,000
🖨 Deal sheet 📄 Offer letter ✓ Due diligence
Listing remarks
Charming 3 bedroom, 2 bath in lovely community setting boasts a spacious kitchen with dining area, an accessible bathroom with roll-in shower, private backyard with patio cover. Bedrooms are located on the upper level with an additional full bath that features a jacuzzi style tub for relaxation. Community amenities include a sparkling swimming pool, spa, basketball courts, and clubhouse for special events. Low monthly fee covers property tax, water, gas, trash/sewer, and much more. .. .Priced just right and ready to move in and update to your personal style! Sold AS-IS, Cash Sales Only ( no financing ) & No Rentals ( owner occupied only ).
Key facts
- Roll-in shower
- Private backyard
- Spacious kitchen
Tags
Property features AI
Finance
- Other: Community features include basketball court (lighted), paved streets, sidewalks, parks, and street lights
- HOA & community: Part of Oxford Homes HOA; HOA amenities include clubhouse, laundry, park, pool, and spa/hot tub; HOA fee paid monthly; HOA fee covers common area maintenance, exterior maintenance of unit, front yard maintenance, gas, pest control, roof repair and replacement, sewer, and water
Exterior
- Parking: Shared driveway
- Security: Wrought iron security door; Smoke detectors
- Utilities: Public water (water company); Sewer connected
- Home design: Townhouse; Two stories; Faces north
- Construction: Slump block construction; Built-up reflective roof
- Exterior features: Covered patio with slab and paver surfaces; Wood and shared fencing; Decorative gravel landscaping; Borders common area; North/South exposure; Paved roads and county road responsibility; Community pool and spa
Interior
- Kitchen: Disposal; Refrigerator; Electric range
- Bedrooms: Two levels (townhouse layout)
- Flooring: Carpet; Ceramic tile; Laminate
- Bathrooms: 2 full bathrooms
- Heating & cooling: Forced air heating (natural gas); Evaporative cooling
- Interior features: Walk-in closets; Roll-in shower; Smoke detectors; Wrought iron security door
- Laundry & utility: Laundry area outside with electric dryer hookup
Neighborhood map
What this means for you Summary
Snapshot
- This is a 3-bed/2.0-bath townhouse listed at $99k.
Deal economics
- At list price, monthly cash flow is $511 ($6k/yr) — positive.
- The deal already cash-flows at list — no discount required.
- Meets the 1% rule at list price ($2k rent vs $99k).
- Cap rate 12.5% vs local median 3.7% in Tucson — top-decile yield for the area; either an underpriced asset or a hidden risk that comps aren't pricing in. Stress-test before assuming the spread holds.
Location & tenants
- Location reads 74/100 on livability (#17 in AZ, #4,502 nationally) — a middle-class / working-renter tenant base. Strengths: commute A+, cost of living A+, housing A+; Watch: health & safety C-, crime F, employment D-.
- Tucson Unified District (4403) (urban): math 14% / reading 23% proficiency, ranked #190 of 249 in AZ (top 76%) — low school quality limits family demand, transient renter base, plan for 1-2y turnover.
- Zoned schools: Wheeler Elementary School (math 22% / reading 32%, grade F, #600 of 1,109 statewide, top 56%, 416 students, 73% FRL); Palo Verde High Magnet School (math 8% / reading 12%, grade F, #343 of 381 statewide, top 93%, 691 students, 65% FRL).
- Market conditions: Rents rising (+1.6%/yr); 210 active listings in the ZIP; 40 comparable units currently listed for rent nearby; rentals at typical pace (median 24d on market — plan ~3-4 weeks tenant-placement turnaround); 40% of comp listings sitting > 30 days — soft ceiling on asking rent; 5,268 units permitted in Pima County in 2024 (996 in 5+ unit buildings).
- This rent runs 32% of the median local income ($57k/yr) — at the standard rent-burdened threshold; future hikes will face affordability resistance.
Forward outlook
- Local home prices are declining (-3.0%/yr); year-one equity from $684 of loan paydown is wiped out by about $3k of value loss. Plan a longer hold.
- Pima County population projected at +8% by 2050 — modest demand growth; plan on rents tracking national, not racing it.
- At projected returns (-3.0% appreciation + 1.6% rent growth), your $28k cash investment doubles in ~6 years — after that, you're playing with house money.
Negotiation context
- Only 8 days on market — expect competitive offers; lowballing is unlikely to land.
- 7 sale attempts since 21y ago with the ask held roughly flat each time — persistent listings suggest the price (not the market) is what's stuck; bring a comps-based counter.
- Current owner paid $69k; 43% above their basis — modest negotiation headroom, anchor on the comps not their cost.
Risks & watch-outs
- Climate carrying-cost: extreme-heat days projected 4→11/yr by 2055 (HVAC capex compounding) — expect insurance premiums to compound above CPI over the hold.
Questions for the listing agent
- Built in 1964 — when were the roof, HVAC, electrical panel, plumbing, and water heater last replaced?
- Is there a deadline driving the sale (1031 exchange, divorce, estate, relocation)? That informs how much negotiation room exists.
- Schools are D-rated, which usually means shorter tenancies and higher turnover. Who's the typical renter profile here, and what's been the actual vacancy rate?
- Crime grade is F in this area — have there been break-ins, vandalism, or insurance claims at this property in the last 3 years? What carrier currently insures it and at what premium?
- What's the average days-on-market for RENTAL listings here right now (not sales)? A rising rental-DOM trend means longer vacancies and softer asking-rent achievability than the comps imply.
- What's the recent tenant-quality profile in this submarket — average credit score on applications, eviction rate, late-payment / NSF rate, and stable-employment percentage? A property-management company in the area should have these aggregated.
- How much new for-sale + rental construction is in the pipeline within 1–3 miles? Heavy new supply typically softens prices + rents 12–24 months out; constrained supply supports both.
Investment metrics
- 1% rule
- 1.53% ✓
- Cap rate
- 12.48%
- Cash-on-cash
- 22.10%
- DSCR
- 1.98
- GRM
- 5.5
CMA / ARV
- ARV (median comp)
- $154,426
- List price
- $99,000
- Delta
- -35.89%
- Verdict
- UNDERPRICED
- Comps
- 20 within 1.0 mi
Show comp detail 7 sales within ~0.75 mi
| Address | Dist | Beds/Ba | Sqft | Sold | Price | $/sf | Match |
|---|---|---|---|---|---|---|---|
| 1354 S Avenida Polar Unit H8 | 0.00mi | 3/2.0 | 1,150 (0%) | 7mo | $148,000 | $129 | 94 |
| 1354 S Avenida Polar Unit H5 | 0.05mi | 3/1.5 | 1,150 (0%) | 15mo | $157,230 | $137 | 83 |
| 1330 S Avenida Polar Unit E-4 | 0.00mi | 3/1.5 | 1,050 (-9%) | 13mo | $138,000 | $131 | 72 |
| 1330 S Avenida Polar Unit E12 | 0.00mi | 2/1.5 (-1) | 985 (-14%) | 4mo | $132,000 | $134 | 66 |
| 1306 S Avenida Polar Unit B2 | 0.08mi | 2/2.0 (-1) | 985 (-14%) | 3mo | $155,000 | $157 | 65 |
| 1250 S Sahuara Ave | 0.65mi | 2/2.0 (-1) | 986 (-14%) | 10mo | $220,000 | $223 | 33 |
| 1258 S Sahuara Ave | 0.65mi | 2/1.0 (-1) | 999 (-13%) | 16mo | $165,000 | $165 | 25 |
Match score weights: distance 35% · size 25% · config 20% · recency 20%. Top-matched comps best support the ARV.
Projected returns pro-forma
-3.0% appreciation · 1.61% rent growth · sell at horizon
- IRR
- 13.3%
- Equity multiple
- 1.52×
- Total profit
- $14,410
- Equity at exit
- $14,761
- IRR
- 21.0%
- Equity multiple
- 2.67×
- Total profit
- $46,185
- Equity at exit
- $8,560
Cash invested: $27,720 (down + closing). Projections, not guarantees.
Landlord ↔ Tenant lean methodology
- Overall (STATE)
- 87 Strongly Landlord-Friendly
- State Arizona
- 87 Strongly Landlord-Friendly · R+3
- County
- — inherits STATE
- City
- — inherits STATE
ZIP-level market 85710
- Rents YoY
- 1.6%
- Active inventory
- 210
- Price-to-rent
- 5.5×
Monthly cashflow live
- Estimated rent
- $1,512 high interval (Pro) →
- Mortgage (P&I)
- −$519
- Tax est. 1.5%
- −$124 /mo · $1,485/yr
- Insurance
- −$41
- HOA
- −$0
- Vacancy / Maint / Mgmt
- −$318
- Net cashflow
- $511
Break-even live
UW: 25.0% down · 7.5% · 30yr · 1.5% tax · 5.0% vac · 8.0% maint · 8.0% mgmt
Financing live
Cash to close
- Down payment
- $24,750
- Closing costs
- $2,970
- Reserves months
- —
- Total cash needed
- —
Loan-product check · same deal, 3 products live
Conventional
25% down · 7.5% · 30yr
- Down + closing
- —
- Monthly P&I
- —
- Monthly cashflow
- —
- DSCR
- —
- Eligible?
- —
Personal DTI + credit; lowest rate.
DSCR
20% down · 8.5% · 30yr
- Down + closing
- —
- Monthly P&I
- —
- Monthly cashflow
- —
- DSCR
- —
- Eligible?
- —
No personal income docs; deal must DSCR.
Hard money
10% down · 12.0% · 12mo
- Down + closing
- —
- Monthly P&I
- —
- Monthly cashflow
- —
- DSCR
- —
- Eligible?
- —
Short-term bridge; refi at stabilization.
Rent comps 40 comps
| Address | Beds | Baths | Sqft | Rent | $/sqft | DOM | Units | Dist |
|---|---|---|---|---|---|---|---|---|
| 6402 E Calle Altair Tucson, AZ | 4.0 | 2.0 | 1170 | $1,850 | $1.58 | 43d | 1 | 0.09mi |
| 1051 S Duke Dr Tucson, AZ | 3.0 | 1.0 | 1400 | $1,595 | $1.14 | 20d | 1 | 0.30mi |
| 6508 E Calle Dened Tucson, AZ | 3.0 | 2.0 | 1066 | $1,741 | $1.63 | 11d | 1 | 0.38mi |
| 6122 E Sylvane St Tucson, AZ | 3.0 | 1.0 | 1007 | $1,560 | $1.55 | 3d | 1 | 0.42mi |
| 1733 S Avenida Regulo Tucson, AZ | 3.0 | 2.0 | 1215 | $1,620 | $1.33 | 43d | 1 | 0.48mi |
| 6225 E Calle Aurora Tucson, AZ | 3.0 | 2.0 | 1144 | $1,595 | $1.39 | 43d | 1 | 0.50mi |
| 6158 E 31st St Tucson, AZ | 3.0 | 2.0 | 1414 | $1,800 | $1.27 | 43d | 1 | 0.60mi |
| 1833 S Poetry Ln Tucson, AZ | 3.0 | 2.0 | 1500 | $1,850 | $1.23 | 43d | 1 | 0.63mi |
| 1312 S Sahuara Ave Tucson, AZ | 2.0 | 1.0 | 730 | $1,290 | $1.77 | 3d | 1 | 0.63mi |
| 1266 S Sahuara Ave Tucson, AZ | 2.0 | 1.0 | 986 | $1,195 | $1.21 | 23d | 1 | 0.64mi |
| 5758 E 24th St Tucson, AZ | 2.0 | 1.0 | 860 | $1,175 | $1.37 | 43d | 1 | 0.77mi |
| 822 S Langley Ave #207 Tucson, AZ | 2.0 | 2.0 | 948 | $1,050 | $1.11 | 3d | 1 | 0.79mi |
| 822 S Langley Ave #207 Tucson, AZ | 2.0 | 2.0 | 948 | $1,175 | $1.24 | 23d | 1 | 0.79mi |
| 834 S Langley Ave #201 Tucson, AZ | 2.0 | 2.0 | 970 | $1,200 | $1.24 | 43d | 1 | 0.80mi |
| 5737 E 24th St Tucson, AZ | 2.0 | 1.0 | 873 | $1,200 | $1.37 | 43d | 1 | 0.80mi |
| 820 S Langley Ave Unit 204 Tucson, AZ | 2.0 | 2.0 | 945 | $1,100 | $1.16 | 11d | 1 | 0.83mi |
| 5711 E 26th St Apt B Tucson, AZ | 2.0 | 1.0 | 700 | $800 | $1.14 | 43d | 1 | 0.84mi |
| 2020 S Avenida Ursa Tucson, AZ | 4.0 | 2.0 | 1500 | $1,795 | $1.20 | 43d | 1 | 0.84mi |
| 808 S Langley Ave Unit 201 Tucson, AZ | 2.0 | 2.0 | 945 | $1,050 | $1.11 | 23d | 1 | 0.84mi |
| 808 S Langley Ave Unit 106 Tucson, AZ | 2.0 | 2.0 | 945 | $1,175 | $1.24 | 2d | 1 | 0.84mi |
| 5706 E 24th St Tucson, AZ | 2.0 | 1.0 | 784 | $1,250 | $1.59 | 11d | 1 | 0.84mi |
| 816 S Langley Ave #204 Tucson, AZ | 2.0 | 2.0 | 945 | $1,800 | $1.90 | 43d | 1 | 0.88mi |
| 816 S Langley Ave #203 Tucson, AZ | 2.0 | 1.0 | 945 | $1,050 | $1.11 | 23d | 1 | 0.88mi |
| 1809 S Van Buren Ave Tucson, AZ | 2.0 | 1.0 | 816 | $995 | $1.22 | 16d | 1 | 0.90mi |
| 6625 E Golf Links Rd #2 Tucson, AZ | 2.0 | 2.0 | 849 | $995 | $1.17 | 11d | 1 | 0.91mi |
| 810 S Kolb Rd Unit 4 Tucson, AZ | 2.0 | 1.0 | 850 | $995 | $1.17 | 43d | 1 | 0.92mi |
| 6091 E Golf Links Rd Unit 6121-14 Tucson, AZ | 2.0 | 1.0 | 810 | $1,139 | $1.41 | 23d | 1 | 0.92mi |
| 6091 E Golf Links Rd Unit 6141-06 Tucson, AZ | 2.0 | 1.0 | 900 | $1,270 | $1.41 | 23d | 1 | 0.92mi |
| 6502 E Golf Links Rd Tucson, AZ | 2.0 | 1.0 | 550 | $1,009 | $1.83 | 10d | 12 | 0.97mi |
| 5723 E 19th St Tucson, AZ | 3.0 | 2.0 | 1211 | $2,350 | $1.94 | 43d | 1 | 0.97mi |
| 5674 E Eastland St Tucson, AZ | 3.0 | 2.0 | 1431 | $1,645 | $1.15 | 43d | 1 | 1.02mi |
| 1345 S Kolb Rd Tucson, AZ | 2.0 | 1.5 | 1050 | $1,399 | $1.33 | 43d | 1 | 1.05mi |
| 5828 E 35th St Tucson, AZ | 3.0 | 1.0 | 949 | $1,650 | $1.74 | 14d | 1 | 1.05mi |
| 6940 E Julia St Tucson, AZ | 3.0 | 2.0 | 1457 | $1,950 | $1.34 | 3d | 1 | 1.06mi |
| 7237 E Pierce Pl Tucson, AZ | 3.0 | 2.0 | 1161 | $2,055 | $1.77 | 16d | 1 | 1.07mi |
| 1704 S Jefferson Ave Unit WI1710-6 Tucson, AZ | 2.0 | 1.0 | 750 | $995 | $1.33 | 43d | 1 | 1.07mi |
| 5547 E 29th St Unit 1 Tucson, AZ | 3.0 | 1.5 | 1175 | $995 | $0.85 | 10d | 1 | 1.10mi |
| 5624 E 18th St Tucson, AZ | 3.0 | 2.0 | 1458 | $2,300 | $1.58 | 20d | 1 | 1.12mi |
| 7001 E Golf Links Rd Tucson, AZ | 2.0–3.0 | 1.0–2.0 | 885 | $1,371 | $1.55 | 2d | 9 | 1.16mi |
| 1401 S Woodland Ave Unit 1401 Tucson, AZ | 2.0 | 1.0 | 830 | $700 | $0.84 | 23d | 1 | 1.18mi |
Listing history 21 events
-
2026-06-18days on market $99,000 Active 8 DOM
-
2026-06-17days on market $99,000 Active 7 DOM
-
2026-06-16days on market $99,000 Active 6 DOM
-
2026-06-15days on market $99,000 Active 5 DOM
-
2026-06-13statusdays on market $99,000 Active 3 DOM
-
2026-05-06price $99,000 652-char remark
-
2026-05-02price $105,000 652-char remark
-
2026-05-01$99,000 Active 652-char remark
-
2026-05-01historical
-
2026-03-26price $105,000
-
2026-03-13status Active
-
2026-03-11historical Active Contingent
-
2026-02-12price $117,000
-
2026-01-01price $121,500
-
2025-12-01$123,500 Active
-
2006-05-23soldstatus $69,000
-
2006-01-23$72,900
-
2005-12-27historical
-
2005-10-15$73,900
-
2005-09-26historical
-
2005-08-02$81,900
ⓘ Source: listings_history table (triggers on properties + properties_extension) + one-shot
backfill from property_details.listing_events for pre-trigger history.
Climate risk First Street
- Flood 1/10 Low FEMA zone X (unshaded) · 0% chance over 30 yrs
- Wildfire 1/10 Low
- Heat 7/10 Severe 4 d/yr ≥105°F today · 11 d/yr by 30 yrs out
- Wind 1/10 Low
- Air quality 1/10 Low 0 unhealthy d/yr today · 0 by 30 yrs out
Nearby sold comps map
Loading sold comps map…
Walkable amenities ~0.75 mi
Loading nearby amenities…
Taxation est. · year 1
- Rental income
- $18,147
- − Mortgage interest
- −$5,546
- − Property taxes
- −$1,485
- − Insurance
- −$495
- − Repairs & maintenance
- −$1,452
- − Management
- −$1,452
- − Depreciation
- −$2,880
- Taxable income
- $4,838
- Est. tax owed @ 24.0%
- −$1,161
- After-tax cash flow
- $4,965/yr
For passive investors: Depreciation is non-cash, so a rental often shows a tax loss while cash-flowing — sheltering income. Rental losses are passive: they offset passive income freely, and up to $25,000/yr can offset ordinary (W-2) income if you actively participate and your MAGI is under $100k (phasing out to $0 by $150k); unused losses carry forward. On sale, claimed depreciation is recaptured at up to 25%, and gains may owe capital-gains tax (a 1031 exchange can defer both). Figures are a year-1 estimate at your 24.0% rate — not tax advice; consult a CPA.
Schools (NCES district)
- District
- Tucson Unified District (4403)
- NCES district ID
- 0408800
- Math proficiency
- 14% ▼ -17.00%
- Reading proficiency
- 23% ▼ -11.00%
- Median HH income
- $40,962
- Composite
- 15.78/100
- National rank
- #9270
- State rank
- #190 of 249 in AZ
Livability — Tucson
- Score
- 74/100
- State rank
- #17
- US rank
- #4502
Category grades
Schools grade is shown separately in the Schools card above.
Census & demographics
- Census place
- Tucson, AZ
- County
- Pima County · 1,012,107 people
- City population
- 839,336
- Metro
- Tucson, AZ
- Population (ZIP)
- 56,125
- Household income
- $57,175
- Rent vs Own
- Severe rent burden
- 3888.0
Population outlook (Pima County) Hauer SSP2
- Today (2025)
- 1,066,056 people
- By 2030
- 1,086,684 · +1.9%
- By 2040
- 1,117,160 · +4.8%
- By 2050
- 1,149,778 · +7.9%
- By 2075
- 1,271,480 · +19.3%
- By 2100
- 1,321,160 · +23.9%
Race, ethnicity, and origin ACS 2023
- Neighborhood character
- Diverse neighborhood (Simpson 0.56)
- Race & ethnicity
- White 62% Hispanic / Latino 25% Two or more races 13% Black 5% Asian 2% Native American 1%
- Hispanic origin (detail)
- Mexican 22%
- Common ancestry
- Lithuanian 3% Romanian 2% Italian 2%
- Foreign-born
- 9% · Canada, South Korea
- Languages at home
- 83% English-only · Spanish 11% Arabic 1% Other Indo-European 1%
Political lean MEDSL · Pima
- 2024 margin
- D (+15.2) · D 57.0% · R 41.8% · Other 1.2%
- 2008→2024 swing
- +9.1pp toward D · 2008: 6.1pp · 2024: 15.2pp
- All cycles
- 2024: D+15.2 2020: D+18.7 2016: D+13.5 2012: D+5.8 2008: D+6.1
Not yet ingested
- Civics
- —
Market trends
- HPI YoY
- ▼ -287.68%
- Current HPI
- 291.8039
- Rent YoY
- ▲ 1.61%
- Metro
- Tucson, AZ
- State GDP YoY
- ▲ 4.54%
- F500 in state
- 20
Industry mix (Fortune 500 HQ in AZ)
| Industry | F500 HQs | Revenue |
|---|---|---|
| Technology | 2 | $13B |
|
||
| Mining / Metals | 1 | $23B |
|
||
| Environmental Services | 1 | $16B |
|
||
| Metals / Steel | 1 | $14B |
|
||
| Technology Distribution | 1 | $9B |
|
||
| Homebuilding | 1 | $8B |
|
||
Price history
+20.9% since first listed18 events — show timeline
- 2026-06-10 Listed $99,000 MLSSAZ
- 2026-05-21 Listing Removed — MLSSAZ
- 2026-05-06 Price Changed $99,000 MLSSAZ
- 2026-05-02 Price Changed $105,000 MLSSAZ
- 2026-05-01 Listing Removed — MLSSAZ
- 2026-05-01 Listed $99,000 MLSSAZ
- 2026-03-26 Price Changed $105,000 MLSSAZ
- 2026-03-13 Relisted — MLSSAZ
- 2026-03-11 Contingent — MLSSAZ
- 2026-02-12 Price Changed $117,000 MLSSAZ
- 2026-01-01 Price Changed $121,500 MLSSAZ
- 2025-12-01 Listed $123,500 MLSSAZ
- 2006-05-23 Sold (MLS) $69,000 MLSSAZ
- 2006-01-23 Listed $72,900 MLSSAZ
- 2005-12-27 Listing Removed — MLSSAZ
- 2005-10-15 Listed $73,900 MLSSAZ
- 2005-09-26 Listing Removed — MLSSAZ
- 2005-08-02 Listed $81,900 MLSSAZ
Cash-flow waterfall
monthlySold comps — $/sqft
last 12 mo · ≤1 miLoading sold comps…