 🏗️ New Construction
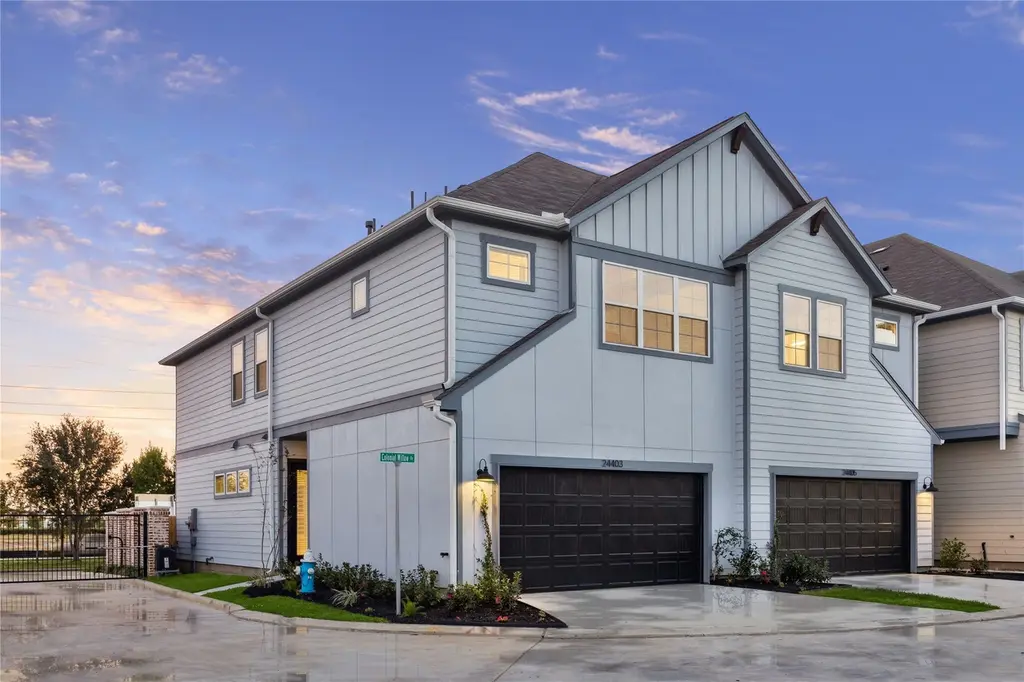
24405 Colonial Willow Dr · Houston, TX
Flood risk No data
- FEMA flood zone
- —
- Chance of flooding over 30 yrs
- —
- Est. flood insurance / yr
- —
Fire risk No data
- Est. fire insurance / yr
- —
Heat risk No data
- Hot days now (above threshold)
- —
- Hot days in 30 yrs
- —
Wind risk No data
- Chance of severe wind over 30 yrs
- —
Air-quality risk No data
- Unhealthy air days now
- —
- Unhealthy air days in 30 yrs
- —
Risk factors via First Street. Map © Google.
Why this score? — see what drove the F grade
The composite is a weighted blend of 9 inputs, each scored 0–100. Each bar is that input's sub-score; the figure is the points it added to the 100-point composite (weight × sub-score).
- Cash flow +7.8/30.0
- ARV discount +7.5/15.0
- Schools +5.7/10.0
- Livability +3.7/5.0
- Condition / age +2.5/5.0
- Rent growth +2.3/5.0
- 1% rule +1.9/10.0
- DSCR +1.9/10.0
- Appreciation +0.0/10.0
$324,900
🖨 Deal sheet (PDF) 📄 Offer letter ✓ Due diligence
Listing remarks
Tucked within a gated Katy community, this 4-bedroom home offers a thoughtful blend of modern comfort and everyday function. Designed with first-floor living, the layout flows effortlessly for both quiet nights at home and entertaining guests. At the heart of the home, the kitchen stands out with a prominent island that provides the perfect gathering space for cooking, dining, and conversation. The primary suite is designed as a relaxing retreat, complete with a spacious walk-in closet and a bath featuring dual vanities, a floating tub, and a separate shower. Conveniently located near I-10 and Highway 99, the home is also just moments from Katy Asiatown, Memorial Hermann Katy Hospital, and
Key facts
- Gated community
- Dual vanities
- Walk-in closet
Tags
Property features AI
Finance
- HOA & community: Managed by Beacon Residential Management; Annual association fee of $990; Association covers common areas, recreation facilities, sewer, trash and water
Exterior
- Parking: Attached garage; 2 garage spaces
- Utilities: Public water; Public sewer
- Home design: Residential property; New construction (2026); 2 stories; Full ownership; Slab foundation
- Construction: Cement siding; Wood siding; Built in 2026
- Exterior features: Composition roof
Interior
- Kitchen: Dishwasher; Gas cooktop; Gas oven; Microwave; Garbage disposal
- Bedrooms: 5 rooms total (includes bedrooms and living spaces)
- Flooring: Carpet; Engineered hardwood; Tile
- Bathrooms: 2 full bathrooms; 1 half bathroom
- Heating & cooling: Central heating (gas); Central air conditioning (electric)
- Interior features: Breakfast bar; Double vanity; Kitchen island; Kitchen/open family room layout; Primary bedroom with private bath; Pantry; Quartz countertops; Soaking tub; Separate shower; Tub/shower; Vanity; Ceiling fans; Programmable thermostat; Low emissivity windows; Ventilation for improved indoor air quality; Energy-efficient HVAC, insulation and windows
- Laundry & utility: Laundry/utility area (washer/dryer hookups assumed)
Neighborhood map
What this means for you Summary
Snapshot
- This is a 3-bed/2.5-bath townhouse listed at $325k.
Deal economics
- At list price, monthly cash flow is $-388 ($-5k/yr) — negative.
- To cash-flow at today's rent, offer at most $281k (13.4% below list).
- To meet the 1% rule (rent ≥ 1% of price), the offer needs to be $240k (26.0% below list).
- Recommended offer: $240k (26.0% below list) — sets the bar for 1% rule.
- Cap rate 5.0% vs local median 3.2% in Houston — top-decile yield for the area; either an underpriced asset or a hidden risk that comps aren't pricing in. Stress-test before assuming the spread holds.
Location & tenants
- Location reads 74/100 on livability (#184 in TX, #4,771 nationally) — a middle-class / working-renter tenant base. Strengths: amenities A+, cost of living A+, housing A+; Watch: crime F.
- Katy ISD (suburban): math 61% / reading 63% proficiency, ranked #29 of 826 in TX (top 4%) — acceptable for families but not a draw, mixed tenant base, ~2y average lease.
- Zoned schools: Morton Ranch H S (math 31% / reading 55%, grade F, #713 of 1,632 statewide, top 44%, 2,718 students, 72% FRL) — zoned schools average 72% FRL vs 27% district-wide (45 pts higher); higher-poverty schools than district average — tighter screening recommended.
- Zoned-school proficiency averages 43% at this address vs 62% district-wide (-19 pts) — the specific schools serving this property underperform the Katy ISD average; the district grade overstates school quality for this exact location.
- Market conditions: Rents soft (-0.8%/yr); 2728 active listings in the ZIP; 39 comparable units currently listed for rent nearby; rentals leasing fast (median 4d on market — plan ~1-2 weeks tenant-placement turnaround); high-income renter base; 29,883 units permitted in Harris County in 2024 (8,621 in 5+ unit buildings).
Forward outlook
- Local home prices are declining (-3.0%/yr); year-one equity from $2k of loan paydown is wiped out by about $10k of value loss. Plan a longer hold.
- Harris County population projected at +47% by 2050 — long-run rental-demand tailwind backs the buy-and-hold thesis.
Negotiation context
- Only 10 days on market — expect competitive offers; lowballing is unlikely to land.
Questions for the listing agent
- What do current leases actually rent for vs. the listed asking? Can we see a recent rent roll and the last 12 months of T-12 income?
- What does the HOA fee cover, when was the last increase, and are there any pending special assessments or reserve-fund shortfalls?
- Is there a deadline driving the sale (1031 exchange, divorce, estate, relocation)? That informs how much negotiation room exists.
- Schools are D-rated, which usually means shorter tenancies and higher turnover. Who's the typical renter profile here, and what's been the actual vacancy rate?
- Crime grade is F in this area — have there been break-ins, vandalism, or insurance claims at this property in the last 3 years? What carrier currently insures it and at what premium?
- The area grade is low — what's the realistic commute time and amenity access for the typical tenant pool here? Any planned neighborhood developments (good or bad) we should know about?
- What's the average days-on-market for RENTAL listings here right now (not sales)? A rising rental-DOM trend means longer vacancies and softer asking-rent achievability than the comps imply.
- What's the recent tenant-quality profile in this submarket — average credit score on applications, eviction rate, late-payment / NSF rate, and stable-employment percentage? A property-management company in the area should have these aggregated.
- How much new for-sale + rental construction is in the pipeline within 1–3 miles? Heavy new supply typically softens prices + rents 12–24 months out; constrained supply supports both.
Investment metrics
- 1% rule
- 0.69% ✗
- Cap rate
- 4.96%
- Cash-on-cash
- -4.75%
- DSCR
- 0.79
- GRM
- 12.1
CMA / ARV
- ARV (on-the-fly)
- $349,929
- Comps found
- 2
Show comp detail 2 sales within ~0.75 mi
| Address | Dist | Beds/Ba | Sqft | Sold | Price | $/sf | Match |
|---|---|---|---|---|---|---|---|
| 1514 Colonial Gorge Dr | 0.04mi | 4/2.5 (+1) | 1,925 (-3%) | 0mo | $324,900 | $169 | 88 |
| 24404 Colonial Mound Dr | 0.04mi | 3/2.5 | 1,809 (-8%) | 0mo | $319,900 | $177 | 84 |
Match score weights: distance 35% · size 25% · config 20% · recency 20%. Top-matched comps best support the ARV.
Projected returns pro-forma
-3.0% appreciation · 0.0% rent growth · sell at horizon
- IRR
- -27.6%
- Equity multiple
- 0.10×
- Total profit
- $-88,514
- Equity at exit
- $52,176
- IRR
- -40.4%
- Equity multiple
- -0.39×
- Total profit
- $-136,317
- Equity at exit
- $30,255
Cash invested: $97,980 (down + closing). Projections, not guarantees.
Landlord ↔ Tenant lean methodology
- Overall (STATE)
- 87 Strongly Landlord-Friendly
- State Texas
- 87 Strongly Landlord-Friendly · R+5
- County
- — inherits STATE
- City
- — inherits STATE
ZIP-level market 77493
- Rents YoY
- -0.8%
- Active inventory
- 2728
- Price-to-rent
- 11.3×
Monthly cashflow live
- Estimated rent
- $2,404 high interval (Pro) →
- Mortgage (P&I)
- −$1,835
- Tax from tax record
- −$224 /mo · $2,685/yr
- Insurance
- −$146
- HOA
- −$83
- Vacancy / Maint / Mgmt
- −$505
- Net cashflow
- $-388
Break-even live
Sensitivity live
| Price | -10% $-190 | -5% $-289 | +0% $-388 | +5% $-487 | +10% $-586 |
|---|---|---|---|---|---|
| Rent | -10% $-578 | -5% $-483 | +0% $-388 | +5% $-293 | +10% $-198 |
| Rate | -1.0pp $-212 | -0.5pp $-299 | base $-388 | +0.5pp $-479 | +1.0pp $-571 |
UW: 25.0% down · 7.5% · 30yr · 1.5% tax · 5.0% vac · 8.0% maint · 8.0% mgmt
Financing live
Cash to close
- Down payment
- $87,482
- Closing costs
- $10,498
- Reserves months
- —
- Total cash needed
- —
Loan-product check · same deal, 3 products live
Conventional
25% down · 7.5% · 30yr
- Down + closing
- —
- Monthly P&I
- —
- Monthly cashflow
- —
- DSCR
- —
- Eligible?
- —
Personal DTI + credit; lowest rate.
DSCR
20% down · 8.5% · 30yr
- Down + closing
- —
- Monthly P&I
- —
- Monthly cashflow
- —
- DSCR
- —
- Eligible?
- —
No personal income docs; deal must DSCR.
Hard money
10% down · 12.0% · 12mo
- Down + closing
- —
- Monthly P&I
- —
- Monthly cashflow
- —
- DSCR
- —
- Eligible?
- —
Short-term bridge; refi at stabilization.
Rent comps 39 comps
| Address | Beds | Baths | Sqft | Rent | $/sqft | DOM | Units | Dist |
|---|---|---|---|---|---|---|---|---|
| 1508 Colonial Gorge Dr Katy, TX | 4.0 | 2.5 | 1904 | $2,650 | $1.39 | 18d | 1 | 0.02mi |
| 1330 W Park Green Dr Katy, TX | 1.0–3.0 | 1.0–2.0 | 1058 | $2,222 | $2.10 | 45d | 16 | 0.18mi |
| 1330 W Park Green Dr Katy, TX | 1.0–3.0 | 1.0–2.0 | 1058 | $2,297 | $2.17 | 0d | 15 | 0.18mi |
| 1330 Park West Green Dr Unit 1363 Katy, TX | 3.0 | 2.0 | 1451 | $2,212 | $1.52 | 16d | 1 | 0.21mi |
| 24002 Colonial Pkwy Katy, TX | 1.0–3.0 | 1.0–2.0 | 1072 | $2,262 | $2.11 | 3d | 32 | 0.23mi |
| 1700 Katy Fort Bend Rd Katy, TX | 1.0–3.0 | 1.0–2.0 | 1094 | $2,415 | $2.21 | 3d | 33 | 0.56mi |
| 24414 Leachwood Dr Katy, TX | 4.0 | 2.0 | 1701 | $2,195 | $1.29 | 20d | 1 | 0.65mi |
| 24929 Katy Ranch Rd Katy, TX | 1.0–3.0 | 1.0–2.0 | 1096 | $1,767 | $1.61 | 0d | 22 | 0.72mi |
| 24982 Katy Ranch Rd Unit 24982 Katy, TX | 3.0 | 2.0 | 1378 | $2,124 | $1.54 | 45d | 1 | 0.73mi |
| 24151 Bella Dolce Ln Unit 24184 Katy, TX | 3.0 | 2.0 | 1509 | $2,496 | $1.65 | 45d | 1 | 0.74mi |
| 24151 Bella Dolce Ln Unit 3112 Katy, TX | 3.0 | 2.0 | 1509 | $2,214 | $1.47 | 0d | 1 | 0.74mi |
| 24151 Bella Dolce Ln Unit 1 Katy, TX | 3.0 | 2.5 | 1509 | $2,313 | $1.53 | 45d | 1 | 0.74mi |
| 24151 Bella Dolce Ln Unit 3174 Katy, TX | 3.0 | 2.0 | 1509 | $2,254 | $1.49 | 11d | 1 | 0.74mi |
| 24117 Bella Dolce Ln Katy, TX | 2.0 | 1.0–2.0 | 896 | $2,010 | $2.24 | 0d | 27 | 0.77mi |
| 24949 Katy Ranch Rd Unit 3174 Katy, TX | 3.0 | 2.0 | 1378 | $2,124 | $1.54 | 0d | 1 | 0.79mi |
| 24949 Katy Ranch Rd Unit 3187 Katy, TX | 3.0 | 2.0 | 1378 | $2,073 | $1.50 | 0d | 1 | 0.79mi |
| 24949 Katy Ranch Rd Katy, TX | 3.0 | 2.0 | 1378 | $2,275 | $1.65 | 45d | 1 | 0.82mi |
| 2031 Wigmaker Dr Katy, TX | 3.0 | 2.0 | 1430 | $1,800 | $1.26 | 6d | 1 | 0.83mi |
| 150 Cobia Dr Unit 183 Katy, TX | 3.0 | 2.0 | 1454 | $2,005 | $1.38 | 45d | 1 | 0.87mi |
| 150 Cobia Dr Unit 3187 Katy, TX | 3.0 | 2.0 | 1454 | $1,954 | $1.34 | 0d | 1 | 0.87mi |
| 150 Cobia Dr Unit 3174 Katy, TX | 3.0 | 2.0 | 1454 | $1,994 | $1.37 | 11d | 1 | 0.87mi |
| 2150 Katy Fort Bend Rd Unit 3174 Katy, TX | 3.0 | 2.0 | 1272 | $1,848 | $1.45 | 0d | 1 | 0.97mi |
| 2150 Katy Fort Bend Rd Unit 2183 Katy, TX | 3.0 | 2.0 | 1272 | $1,821 | $1.43 | 45d | 1 | 0.97mi |
| 24758 Grand Harbor Dr Unit 24791 Katy, TX | 3.0 | 2.0 | 1437 | $2,114 | $1.47 | 45d | 1 | 0.98mi |
| 24758 Grand Harbor Dr Unit 3174 Katy, TX | 3.0 | 2.0 | 1437 | $2,063 | $1.44 | 0d | 1 | 0.98mi |
| 24758 Grand Harbor Dr Unit 3047 Katy, TX | 3.0 | 2.0 | 1437 | $2,114 | $1.47 | 12d | 1 | 1.00mi |
| 302 Cobia Dr Katy, TX | 1.0–3.0 | 1.0–2.5 | 1217 | $2,469 | $2.03 | 0d | 23 | 1.06mi |
| 24764 Grand Harbor Dr Katy, TX | 3.0 | 2.0 | 1340 | $1,909 | $1.42 | 45d | 1 | 1.06mi |
| 24757 Grand Harbor Dr Katy, TX | 1.0–3.0 | 1.0–2.0 | 1009 | $1,889 | $1.87 | 4d | 22 | 1.08mi |
| 23615 Western Centre Dr Katy, TX | 1.0–3.0 | 1.0–2.0 | 1011 | $2,230 | $2.20 | 0d | 31 | 1.09mi |
| 1002 Katy Gap Rd Katy, TX | 1.0–3.0 | 1.0–2.0 | 996 | $2,104 | $2.11 | 0d | 115 | 1.14mi |
| 23414 W Fernhurst Dr Katy, TX | 1.0–3.0 | 1.0–3.0 | 1352 | $3,099 | $2.29 | 0d | 30 | 1.15mi |
| 1724 Partnership Way Katy, TX | 3.0 | 1.0–3.5 | 1536 | $3,340 | $2.17 | 0d | 86 | 1.17mi |
| 1646 Chilton Ln Katy, TX | 3.0 | 2.0 | 1442 | $2,000 | $1.39 | 6d | 1 | 1.19mi |
| 1616 Partnership Way Katy, TX | 3.0 | 1.0–3.0 | 1283 | $2,940 | $2.29 | 0d | 49 | 1.23mi |
| 10 Cobia Dr Katy, TX | 3.0 | 2.0 | 1454 | $2,275 | $1.56 | 45d | 1 | 1.27mi |
| 23400 Kingsland Blvd Katy, TX | 1.0–3.0 | 1.0–2.0 | 1062 | $2,314 | $2.18 | 0d | 22 | 1.42mi |
| 125 Prairie Ln Katy, TX | 3.0 | 1.0–3.0 | 1292 | $3,125 | $2.42 | 0d | 200 | 1.47mi |
| 23615 Kingsland Blvd Katy, TX | 1.0–2.0 | 1.0–2.0 | 979 | $2,349 | $2.40 | 0d | 12 | 1.49mi |
HOA detail
- Monthly dues
- $83 · $996/yr
- Likely covers
- security
Listing history 15 events
-
2026-06-21days on market $324,900 Active 10 DOM
-
2026-06-18days on market $324,900 Active 7 DOM
-
2026-06-17days on market $324,900 Active 6 DOM
-
2026-06-16days on market $324,900 Active 5 DOM
-
2026-06-15days on market $324,900 Active 4 DOM
-
2026-06-13days on market $324,900 Active 2 DOM
-
2026-06-09days on market $324,900 Active 12 DOM
-
2026-06-08days on market $324,900 Active 11 DOM
-
2026-06-07days on market $324,900 Active 10 DOM
-
2026-06-04days on market $324,900 Active 7 DOM
-
2026-06-03days on market $324,900 Active 6 DOM
-
2026-06-02days on market $324,900 Active 5 DOM
-
2026-06-01days on market $324,900 Active 4 DOM
-
2026-05-31days on market $324,900 Active 3 DOM
-
2026-05-28$324,900 Active
ⓘ Source: listings_history table (triggers on properties + properties_extension) + one-shot
backfill from property_details.listing_events for pre-trigger history.
Tax reassessment forecast TX · Resets to sale price
- Current annual tax
- $2,685 · $224/mo
- Projected year-2 tax
- $5,946 · $495/mo
- Expected delta
- +$3,261/yr (+$272/mo · 121.5%)
ⓘ Screening estimate from a state-policy table — verify with the county assessor before closing.
Nearby sold comps map
Loading sold comps map…
Walkable amenities ~0.75 mi
Loading nearby amenities…
Taxation est. · year 1
- Rental income
- $28,852
- − Mortgage interest
- −$19,601
- − Property taxes
- −$2,685
- − Insurance
- −$1,750
- − Repairs & maintenance
- −$2,308
- − Management
- −$2,308
- − HOA
- −$996
- − Depreciation
- −$10,180
- Taxable loss
- −$10,975
- Est. tax savings @ 24.0%
- +$2,634
- After-tax cash flow
- $-2,023/yr
For passive investors: Depreciation is non-cash, so a rental often shows a tax loss while cash-flowing — sheltering income. Rental losses are passive: they offset passive income freely, and up to $25,000/yr can offset ordinary (W-2) income if you actively participate and your MAGI is under $100k (phasing out to $0 by $150k); unused losses carry forward. On sale, claimed depreciation is recaptured at up to 25%, and gains may owe capital-gains tax (a 1031 exchange can defer both). Figures are a year-1 estimate at your 24.0% rate — not tax advice; consult a CPA.
Schools (NCES district)
- District
- Katy ISD
- NCES district ID
- 4825170
- Math proficiency
- 61% ▼ -7.00%
- Reading proficiency
- 63% ▼ -3.00%
- Median HH income
- $90,312
- Composite
- 56.59/100
- National rank
- #1146
- State rank
- #29 of 826 in TX
Livability — Houston
- Score
- 74/100
- State rank
- #184
- US rank
- #4771
Category grades
Schools grade is shown separately in the Schools card above.
Census & demographics
- County
- Harris County · 4,702,590 people
- City population
- 3,226,434
- Metro
- Houston-The Woodlands-Sugar Land, TX
- Population (ZIP)
- 71,484
- Household income
- $118,464
- Rent vs Own
- Severe rent burden
- 913.0
Population outlook (Harris County) Hauer SSP2
- Today (2025)
- 5,571,493 people
- By 2030
- 6,089,821 · +9.3%
- By 2040
- 7,142,806 · +28.2%
- By 2050
- 8,185,864 · +46.9%
- By 2075
- 10,574,329 · +89.8%
- By 2100
- 12,109,958 · +117.4%
Race, ethnicity, and origin ACS 2023
- Neighborhood character
- Highly diverse neighborhood (Simpson 0.73)
- Race & ethnicity
- White 36% Hispanic / Latino 33% Two or more races 16% Black 15% Asian 12%
- Hispanic origin (detail)
- Mexican 20%
- Common ancestry
- Lithuanian 2% Slovak 1% Italian 1%
- Foreign-born
- 21% · Canada, Vietnam, Jamaica
- Languages at home
- 64% English-only · Spanish 22% Vietnamese 5% French/Haitian/Cajun 4%
Political lean MEDSL · Harris
- 2024 margin
- Lean D (+5.5) · D 52.0% · R 46.4% · Other 1.6%
- 2008→2024 swing
- +3.9pp toward D · 2008: 1.6pp · 2024: 5.5pp
- All cycles
- 2024: D+5.5 2020: D+13.3 2016: D+12.4 2012: D+0.1 2008: D+1.6
Not yet ingested
- Civics
- —
Market trends
- HPI YoY
- ▼ -140.65%
- Current HPI
- 233.1683
- Rent YoY
- ▼ -0.80%
- Metro
- Houston-The Woodlands-Sugar Land, TX
- State GDP YoY
- ▲ 3.95%
- F500 in state
- 110
Industry mix (Fortune 500 HQ in TX)
| Industry | F500 HQs | Revenue |
|---|---|---|
| Energy | 16 | $1,198B |
|
||
| Technology | 5 | $198B |
|
||
| Engineering / Construction | 4 | $72B |
|
||
| Energy Services | 3 | $60B |
|
||
| Utilities | 3 | $41B |
|
||
| Healthcare | 2 | $330B |
|
||
Price history
1 event — show timeline
- 2026-05-28 Listed $324,900 HARMLS
Cash-flow waterfall
monthlySold comps — $/sqft
last 12 mo · ≤1 miLoading sold comps…