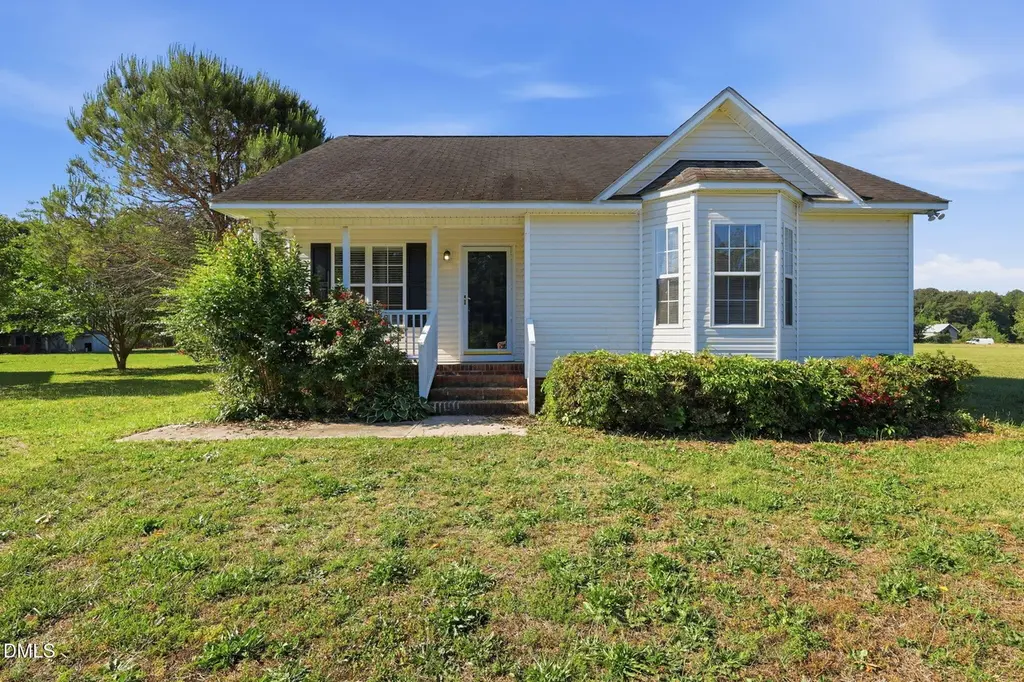
64 Winesap Ln · Wendell, NC
Flood risk 1/10 · Minimal
- FEMA flood zone
- X (unshaded)
- Chance of flooding over 30 yrs
- 0.0%
- Est. flood insurance / yr
- $507 – $1,088
Fire risk 3/10 · Minor
- Est. fire insurance / yr
- $906 – $1,684
Heat risk 6/10 · Moderate
- Hot days now (above 105°F)
- 7 days/yr
- Hot days in 30 yrs
- 17 days/yr
Wind risk 6/10 · Moderate
- Chance of severe wind over 30 yrs
- 68.0%
Air-quality risk 2/10 · Minimal
- Unhealthy air days now
- 2 days/yr
- Unhealthy air days in 30 yrs
- 2 days/yr
Risk factors via First Street. Map © Google.
Why this score? — see what drove the D grade
The composite is a weighted blend of 9 inputs, each scored 0–100. Each bar is that input's sub-score; the figure is the points it added to the 100-point composite (weight × sub-score).
- Cash flow +12.7/30.0
- ARV discount +7.5/15.0
- Livability +3.9/5.0
- DSCR +3.8/10.0
- Schools +3.5/10.0
- Rent growth +3.4/5.0
- 1% rule +2.9/10.0
- Condition / age +2.5/5.0
- Appreciation +0.0/10.0
$254,900
🖨 Deal sheet (PDF) 📄 Offer letter ✓ Due diligence
Listing remarks MLS
SPACIOUS COUNTRY RANCH IN NEW HOME SUBDIVISION CATHEDRAL CEILING IN FAMILY ROOM AND BAY WINDOW IN MASTER SUITE. COME MAKE THIS HOME YOURS.
Key facts
- Cozy fireplace
- 0.61 acre lot
- Built 2002
Tags
Property features AI
Finance
- Other: Living area reported as 1,109; Lot size reported as 26,571 sq ft
- HOA & community: Community association (Flowers Plantation); Association dues $40 per month
Exterior
- Utilities: Water: Other; Sewer: Other
- Home design: Site-built single-story home; One level
- Construction: Vinyl siding; Composition roof; Slab foundation; Built as site-built construction
- Exterior features: 0.61-acre lot; Publicly maintained road access; Zoned RAG
Interior
- Bedrooms: 3 bedrooms (all on the main level)
- Flooring: Vinyl
- Heating & cooling: Central heating (listed also as None); Central air conditioning
- Interior features: Vinyl flooring
Neighborhood map
What this means for you Summary
Snapshot
- This is a 3-bed/2.0-bath single-family listed at $255k.
Deal economics
- At list price, monthly cash flow is $-26 ($-308/yr) — negative.
- To cash-flow at today's rent, offer at most $250k (1.8% below list).
- To meet the 1% rule (rent ≥ 1% of price), the offer needs to be $201k (21.2% below list).
- Recommended offer: $201k (21.2% below list) — sets the bar for 1% rule.
- Cap rate 6.2% vs local median 3.7% in Wendell — top-decile yield for the area; either an underpriced asset or a hidden risk that comps aren't pricing in. Stress-test before assuming the spread holds.
Location & tenants
- Location reads 78/100 on livability (#25 in NC, #2,391 nationally) — a middle-class / working-renter tenant base. Strengths: housing A+, health & safety A+, crime A; Watch: amenities D.
- Johnston County Public Schools (rural): math 39% / reading 42% proficiency, ranked #105 of 178 in NC (top 59%) — families likely to look elsewhere, expect single-tenant / working-renter base with shorter leases.
- Zoned schools: Corinth-Holders Elementary (math 31% / reading 33%, grade F, #908 of 1,410 statewide, top 67%, 550 students, 60% FRL); Archer Lodge Middle (math 43% / reading 47%, grade D, #160 of 475 statewide, top 35%, 1,219 students, 40% FRL); Corinth Holders High (math 50% / reading 61%, grade C, #265 of 535 statewide, top 50%, 2,219 students, 32% FRL) — zoned schools at 44% FRL track the district average.
- Market conditions: Rents rising (+3.4%/yr); 827 active listings in the ZIP; solid renter incomes; 2,783 units permitted in Johnston County in 2024 (6 in 5+ unit buildings).
Forward outlook
- Local home prices are declining (-3.0%/yr); year-one equity from $2k of loan paydown is wiped out by about $8k of value loss. Plan a longer hold.
- Johnston County population projected at +37% by 2050 — long-run rental-demand tailwind backs the buy-and-hold thesis.
Negotiation context
- Only 13 days on market — expect competitive offers; lowballing is unlikely to land.
- 8 sale attempts since 24y ago with the ask held roughly flat each time — persistent listings suggest the price (not the market) is what's stuck; bring a comps-based counter.
- Current owner paid $205k; 24% above their basis — modest negotiation headroom, anchor on the comps not their cost.
Risks & watch-outs
- Climate carrying-cost: major wind risk, 68% chance of damaging wind over 30y; extreme-heat days projected 7→17/yr by 2055 (HVAC capex compounding) — expect insurance premiums to compound above CPI over the hold.
Questions for the listing agent
- What do current leases actually rent for vs. the listed asking? Can we see a recent rent roll and the last 12 months of T-12 income?
- What does the HOA fee cover, when was the last increase, and are there any pending special assessments or reserve-fund shortfalls?
- Is there a deadline driving the sale (1031 exchange, divorce, estate, relocation)? That informs how much negotiation room exists.
- Schools are D-rated, which usually means shorter tenancies and higher turnover. Who's the typical renter profile here, and what's been the actual vacancy rate?
- The area grade is low — what's the realistic commute time and amenity access for the typical tenant pool here? Any planned neighborhood developments (good or bad) we should know about?
- What's the average days-on-market for RENTAL listings here right now (not sales)? A rising rental-DOM trend means longer vacancies and softer asking-rent achievability than the comps imply.
- What's the recent tenant-quality profile in this submarket — average credit score on applications, eviction rate, late-payment / NSF rate, and stable-employment percentage? A property-management company in the area should have these aggregated.
- How much new for-sale + rental construction is in the pipeline within 1–3 miles? Heavy new supply typically softens prices + rents 12–24 months out; constrained supply supports both.
Investment metrics
- 1% rule
- 0.79% ✗
- Cap rate
- 6.17%
- Cash-on-cash
- -0.43%
- DSCR
- 0.98
- GRM
- 10.6
CMA / ARV
No comps found within radius.
Projected returns pro-forma
-3.0% appreciation · 3.4% rent growth · sell at horizon
- IRR
- -16.6%
- Equity multiple
- 0.41×
- Total profit
- $-42,190
- Equity at exit
- $38,006
- IRR
- -7.8%
- Equity multiple
- 0.50×
- Total profit
- $-35,735
- Equity at exit
- $22,039
Cash invested: $71,372 (down + closing). Projections, not guarantees.
Landlord ↔ Tenant lean methodology
- Overall (STATE)
- 85 Strongly Landlord-Friendly
- State North Carolina
- 85 Strongly Landlord-Friendly · R+3
- County
- — inherits STATE
- City
- — inherits STATE
ZIP-level market 27591
- Home prices YoY
- -28.3%
- Rents YoY
- 3.4%
- Active inventory
- 827
- Price-to-rent
- 10.6×
Monthly cashflow live
- Estimated rent
- $2,009 medium interval (Pro) →
- Mortgage (P&I)
- −$1,337
- Tax from tax record
- −$130 /mo · $1,556/yr
- Insurance
- −$106
- HOA
- −$40
- Vacancy / Maint / Mgmt
- −$422
- Net cashflow
- $-26
Break-even live
Sensitivity live
| Price | -10% $119 | -5% $46 | +0% $-26 | +5% $-98 | +10% $-170 |
|---|---|---|---|---|---|
| Rent | -10% $-184 | -5% $-105 | +0% $-26 | +5% $54 | +10% $133 |
| Rate | -1.0pp $103 | -0.5pp $39 | base $-26 | +0.5pp $-92 | +1.0pp $-159 |
UW: 25.0% down · 7.5% · 30yr · 1.5% tax · 5.0% vac · 8.0% maint · 8.0% mgmt
Financing live
Cash to close
- Down payment
- $63,725
- Closing costs
- $7,647
- Reserves months
- —
- Total cash needed
- —
Loan-product check · same deal, 3 products live
Conventional
25% down · 7.5% · 30yr
- Down + closing
- —
- Monthly P&I
- —
- Monthly cashflow
- —
- DSCR
- —
- Eligible?
- —
Personal DTI + credit; lowest rate.
DSCR
20% down · 8.5% · 30yr
- Down + closing
- —
- Monthly P&I
- —
- Monthly cashflow
- —
- DSCR
- —
- Eligible?
- —
No personal income docs; deal must DSCR.
Hard money
10% down · 12.0% · 12mo
- Down + closing
- —
- Monthly P&I
- —
- Monthly cashflow
- —
- DSCR
- —
- Eligible?
- —
Short-term bridge; refi at stabilization.
HOA detail
- Monthly dues
- $40 · $480/yr
Listing history 9 events
-
2026-06-21days on market $254,900 Active 13 DOM
-
2026-06-18days on market $254,900 Active 10 DOM
-
2026-06-17days on market $254,900 Active 9 DOM
-
2026-06-16days on market $254,900 Active 8 DOM
-
2026-06-15days on market $254,900 Active 7 DOM
-
2026-06-13days on market $254,900 Active 5 DOM
-
2026-06-13days on market $254,900 Active 4 DOM
-
2026-06-09remarks 699-char remark
-
2026-06-09$254,900 Active 1 DOM
ⓘ Source: listings_history table (triggers on properties + properties_extension) + one-shot
backfill from property_details.listing_events for pre-trigger history.
Tax reassessment forecast NC · Resets to sale price
- Current annual tax
- $1,556 · $130/mo
- Projected year-2 tax
- $2,090 · $174/mo
- Expected delta
- +$534/yr (+$45/mo · 34.4%)
ⓘ Screening estimate from a state-policy table — verify with the county assessor before closing.
Climate risk First Street
- Flood 1/10 Low FEMA zone X (unshaded) · 0% chance over 30 yrs
- Wildfire 3/10 Moderate
- Heat 6/10 Major 7 d/yr ≥105°F today · 17 d/yr by 30 yrs out
- Wind 6/10 Major 68% chance of damaging wind over 30 yrs
- Air quality 2/10 Low 2 unhealthy d/yr today · 2 by 30 yrs out
Nearby sold comps map
Loading sold comps map…
Walkable amenities ~0.75 mi
Loading nearby amenities…
Taxation est. · year 1
- Rental income
- $24,105
- − Mortgage interest
- −$14,278
- − Property taxes
- −$1,556
- − Insurance
- −$1,274
- − Repairs & maintenance
- −$1,928
- − Management
- −$1,928
- − HOA
- −$480
- − Depreciation
- −$7,415
- Taxable loss
- −$4,756
- Est. tax savings @ 24.0%
- +$1,141
- After-tax cash flow
- $833/yr
For passive investors: Depreciation is non-cash, so a rental often shows a tax loss while cash-flowing — sheltering income. Rental losses are passive: they offset passive income freely, and up to $25,000/yr can offset ordinary (W-2) income if you actively participate and your MAGI is under $100k (phasing out to $0 by $150k); unused losses carry forward. On sale, claimed depreciation is recaptured at up to 25%, and gains may owe capital-gains tax (a 1031 exchange can defer both). Figures are a year-1 estimate at your 24.0% rate — not tax advice; consult a CPA.
Schools (NCES district)
- District
- Johnston County Public Schools
- NCES district ID
- 3702370
- Math proficiency
- 39% ▲ 4.00%
- Reading proficiency
- 42% ▲ 2.00%
- Median HH income
- $50,912
- Composite
- 34.99/100
- National rank
- #5052
- State rank
- #105 of 178 in NC
Livability — Wendell
- Score
- 78/100
- State rank
- #25
- US rank
- #2391
Category grades
Schools grade is shown separately in the Schools card above.
Census & demographics
- County
- Wake County · 1,216,256 people
- City population
- 29,838
- Metro
- Raleigh-Cary, NC
- Population (ZIP)
- 29,838
- Household income
- $85,224
- Rent vs Own
- Severe rent burden
- 369.0
Population outlook (Johnston County) Hauer SSP2
- Today (2025)
- 222,440 people
- By 2030
- 240,227 · +8.0%
- By 2040
- 274,616 · +23.5%
- By 2050
- 304,915 · +37.1%
- By 2075
- 369,507 · +66.1%
- By 2100
- 406,280 · +82.6%
Race, ethnicity, and origin ACS 2023
- Neighborhood character
- Diverse neighborhood (Simpson 0.66)
- Race & ethnicity
- White 46% Hispanic / Latino 27% Black 22% Two or more races 11%
- Hispanic origin (detail)
- Mexican 14% Puerto Rican 4% Dominican 1%
- Common ancestry
- Slovak 2% Serbian 2% Lithuanian 1%
- Foreign-born
- 14% · Canada, Jamaica
- Languages at home
- 79% English-only · Spanish 18% Tagalog/Filipino 1%
Political lean MEDSL · Johnston
- 2024 margin
- Strong R (+21.5) · D 38.7% · R 60.2% · Other 1.1%
- 2008→2024 swing
- +2.2pp toward D · 2008: -23.7pp · 2024: -21.5pp
- All cycles
- 2024: R+21.5 2020: R+24.3 2016: R+30.7 2012: R+27.8 2008: R+23.7
Not yet ingested
- Civics
- —
Market trends
- HPI YoY
- ▼ -92.20%
- Current HPI
- 233.2846
- Rent YoY
- ▲ 3.40%
- Metro
- Raleigh-Cary, NC
- State GDP YoY
- ▲ 3.28%
- F500 in state
- 26
Industry mix (Fortune 500 HQ in NC)
| Industry | F500 HQs | Revenue |
|---|---|---|
| Financial Services | 2 | $213B |
|
||
| Retail | 2 | $95B |
|
||
| Industrial Conglomerate | 1 | $38B |
|
||
| Metals / Steel | 1 | $35B |
|
||
| Utilities | 1 | $30B |
|
||
| Industrial Machinery | 1 | $19B |
|
||
Price history
+1174.5% since first listed29 events — show timeline
- 2026-06-08 Listed $254,900 TMLS
- 2026-01-23 Listing Removed — TMLS
- 2025-11-19 Price Changed $270,000 TMLS
- 2025-09-18 Price Changed $275,000 TMLS
- 2025-09-05 Price Changed $289,900 TMLS
- 2025-08-08 Listed $295,800 TMLS
- 2023-12-11 Price Changed $89,900 TMLS
- 2021-03-15 Sold (Public Records) $205,000 Public Records
- 2021-03-15 Sold (MLS) $205,000 AMLSNC
- 2021-03-15 Sold (MLS) $205,000 TMLS
- 2021-02-11 Pending — TMLS
- 2021-01-15 Listed $205,000 AMLSNC
- 2021-01-15 Listed $205,000 TMLS
- 2021-01-13 Sold (Public Records) $184,500 Public Records
- 2019-03-18 Sold (Public Records) $159,000 Public Records
- 2019-03-18 Sold (MLS) $159,000 AMLSNC
- 2019-03-18 Sold (MLS) $159,000 TMLS
- 2019-02-11 Pending — TMLS
- 2019-01-17 Listed $161,000 AMLSNC
- 2019-01-17 Listed $161,000 TMLS
- 2018-12-20 Sold (Public Records) $149,500 Public Records
- 2002-11-04 Sold (MLS) $91,900 AMLSNC
- 2002-11-04 Sold (MLS) $91,900 TMLS
- 2002-10-01 Sold (Public Records) $92,000 Public Records
- 2002-08-19 Price Changed $189,900 TMLS
- 2002-08-19 Listing Removed — TMLS
- 2002-06-17 Listed $89,900 AMLSNC
- 2002-06-17 Listed $89,900 TMLS
- 2002-03-01 Sold (Public Records) $20,000 Public Records
Property tax history
+4.2%/yrLatest (2025): $1,556 · +40.6% YoY. Source: county tax records.
Cash-flow waterfall
monthlySold comps — $/sqft
last 12 mo · ≤1 miLoading sold comps…