27160 Vista Rd #39 · Silver Lakes, CA
Flood risk 2/10 · Minimal
- FEMA flood zone
- X (unshaded)
- Chance of flooding over 30 yrs
- 0.05%
- Est. flood insurance / yr
- $507 – $1,088
Fire risk 3/10 · Minor
- Est. fire insurance / yr
- $659 – $1,223
Heat risk 8/10 · Major
- Hot days now (above 102°F)
- 7 days/yr
- Hot days in 30 yrs
- 18 days/yr
Wind risk 1/10 · Minimal
- Chance of severe wind over 30 yrs
- —
Air-quality risk 8/10 · Major
- Unhealthy air days now
- 18 days/yr
- Unhealthy air days in 30 yrs
- 22 days/yr
Risk factors via First Street. Map © Google.
Why this score? — see what drove the D grade
The composite is a weighted blend of 9 inputs, each scored 0–100. Each bar is that input's sub-score; the figure is the points it added to the 100-point composite (weight × sub-score).
- Cash flow +10.5/30.0
- ARV discount +7.5/15.0
- Appreciation +5.2/10.0
- 1% rule +4.7/10.0
- Condition / age +4.0/5.0
- DSCR +3.0/10.0
- Livability +2.8/5.0
- Rent growth +2.5/5.0
- Schools +2.2/10.0
$190,000
🖨 Deal sheet (PDF) 📄 Offer letter ✓ Due diligence
Listing remarks
WELCOME TO SILVER LAKES! This charming 2- bedroom, 2-bath condo, offers an incredible opportunity to enjoy resort-style living in one of the High Desert's most sought-after communities. This home is perfect for those seeking a relaxed lifestyle, a weekend retreat or a great investment. Silver Lakes residents enjoy an abundance of amenities, including two private lakes for boating and fishing, a private beach for swimming and barbequing, a championship golf course, club house with an Olympic size pool and Jacuzzi, community activities and social events. Whether you're looking to stay active, connect with neighbors or simply enjoy the peaceful surroundings, Silver Lakes has something for eve
Key facts
- Private beach
- Private lakes
- Jacuzzi
Tags
Property features AI
Finance
- Other: Community features include curbs, sidewalks, biking, hiking, fishing, and a lake; Total units in community: 46 (39 units in community listing noted)
- HOA & community: Part of Silver Lakes Association; Monthly association fee of $235; Association amenities: spa, pool, tennis, golf, gym/exercise room, multipurpose/recreational room, outdoor cooking/barbecue, hiking and horse trails, onsite property management
Exterior
- Parking: Attached carport
- Utilities: Public/district water; Public sewer; Standard electric; Telephone available in street; Cable connected; Electricity connected; Sewer connected
- Home design: Attached condominium; Single-story (1 story); House structure type; Flat roof; Updated/remodeled condition; Entry level: 1
- Construction: Drywall walls; No foundation details listed
- Exterior features: Concrete patio; Community/association pool; Across the road from lake/ocean (water view); Paved road frontage; 0–1 unit per acre lot density
Interior
- Kitchen: Refrigerator; Gas oven; Dishwasher; Breakfast counter/bar; Breakfast nook; Granite countertops
- Bedrooms: 2 main-level bedrooms
- Flooring: Tile flooring
- Bathrooms: 2 full bathrooms with bathtub and shower
- Heating & cooling: Central heating (central furnace); Central cooling
- Interior features: Updated/remodeled interior; Granite counters; One-level home; Association/community spa
- Laundry & utility: No in-unit laundry listed
Neighborhood map
What this means for you Summary
Snapshot
- This is a 2-bed/2.0-bath condo listed at $190k. Condition is rated good.
Deal economics
- At list price, monthly cash flow is $-97 ($-1k/yr) — negative.
- To cash-flow at today's rent, offer at most $176k (7.4% below list).
- To meet the 1% rule (rent ≥ 1% of price), the offer needs to be $184k (3.3% below list).
- Recommended offer: $176k (7.4% below list) — sets the bar for cash-flow.
- Cap rate 5.7% vs local median 4.0% in Silver Lakes — top-decile yield for the area; either an underpriced asset or a hidden risk that comps aren't pricing in. Stress-test before assuming the spread holds.
Location & tenants
- Location reads 56/100 on livability (#822 in CA) — a working-class tenant base; expect higher turnover. Strengths: employment A+, housing A+; Watch: schools C-, crime D-, amenities F.
- Victor Valley Union High (urban): math 25% / reading 25% proficiency, ranked #407 of 517 in CA (top 79%) — low school quality limits family demand, transient renter base, plan for 1-2y turnover; 72% free/reduced lunch — lower-income household profile, screen leases tightly.
- Market conditions: 229 active listings in the ZIP; 3 comparable units currently listed for rent nearby; rentals leasing fast (median 0d on market — plan ~1-2 weeks tenant-placement turnaround); 5,458 units permitted in San Bernardino County in 2024 (1,500 in 5+ unit buildings).
Forward outlook
- In year one you build about $2k of equity ($1k loan paydown + $733 appreciation (0.4% local appreciation)).
- San Bernardino County population projected at +15% by 2050 — modest demand growth; plan on rents tracking national, not racing it.
Negotiation context
- It's been on market 26 days — a 2% lower offer ($187k) is reasonable based on typical stale-listing flexibility.
Risks & watch-outs
- Climate carrying-cost: extreme-heat days projected 7→18/yr by 2055 (HVAC capex compounding) — expect insurance premiums to compound above CPI over the hold.
Questions for the listing agent
- What do current leases actually rent for vs. the listed asking? Can we see a recent rent roll and the last 12 months of T-12 income?
- What does the HOA fee cover, when was the last increase, and are there any pending special assessments or reserve-fund shortfalls?
- Any open or pending special assessments — roof, HVAC, plumbing, elevator, façade? What's the per-unit balance and payoff schedule, and is the seller paying it off at close or rolling it to the buyer?
- Is there a deadline driving the sale (1031 exchange, divorce, estate, relocation)? That informs how much negotiation room exists.
- Crime grade is D in this area — have there been break-ins, vandalism, or insurance claims at this property in the last 3 years? What carrier currently insures it and at what premium?
- The area grade is low — what's the realistic commute time and amenity access for the typical tenant pool here? Any planned neighborhood developments (good or bad) we should know about?
- What's the average days-on-market for RENTAL listings here right now (not sales)? A rising rental-DOM trend means longer vacancies and softer asking-rent achievability than the comps imply.
- What's the recent tenant-quality profile in this submarket — average credit score on applications, eviction rate, late-payment / NSF rate, and stable-employment percentage? A property-management company in the area should have these aggregated.
- How much new apartment / multifamily construction is in the pipeline within 1–3 miles? Heavy new supply (>2% of stock underway) typically softens rents 12–24 months out; light construction supports rent growth.
Investment metrics
- 1% rule
- 0.97% ✗
- Cap rate
- 5.68%
- Cash-on-cash
- -2.19%
- DSCR
- 0.90
- GRM
- 8.6
CMA / ARV
No comps found within radius.
Projected returns pro-forma
0.39% appreciation · 3.0% rent growth · sell at horizon
- IRR
- -3.1%
- Equity multiple
- 0.85×
- Total profit
- $-8,106
- Equity at exit
- $58,865
- IRR
- 2.4%
- Equity multiple
- 1.27×
- Total profit
- $14,581
- Equity at exit
- $73,778
Cash invested: $53,200 (down + closing). Projections, not guarantees.
Landlord ↔ Tenant lean methodology
- Overall (STATE)
- 18 Strongly Tenant-Friendly
- State California
- 18 Strongly Tenant-Friendly · D+13
- County
- — inherits STATE
- City
- — inherits STATE
ZIP-level market 92342
- Home prices YoY
- 0.1%
- Active inventory
- 229
- Price-to-rent
- 8.6×
Monthly cashflow live
- Estimated rent
- $1,836 medium interval (Pro) →
- Mortgage (P&I)
- −$996
- Tax est. 1.5%
- −$238 /mo · $2,850/yr
- Insurance
- −$79
- HOA
- −$235
- Vacancy / Maint / Mgmt
- −$386
- Net cashflow
- $-97
Break-even live
Sensitivity live
| Price | -10% $34 | -5% $-32 | +0% $-97 | +5% $-163 | +10% $-229 |
|---|---|---|---|---|---|
| Rent | -10% $-242 | -5% $-170 | +0% $-97 | +5% $-25 | +10% $48 |
| Rate | -1.0pp $-2 | -0.5pp $-49 | base $-97 | +0.5pp $-146 | +1.0pp $-197 |
UW: 25.0% down · 7.5% · 30yr · 1.5% tax · 5.0% vac · 8.0% maint · 8.0% mgmt
Financing live
Cash to close
- Down payment
- $47,500
- Closing costs
- $5,700
- Reserves months
- —
- Total cash needed
- —
Loan-product check · same deal, 3 products live
Conventional
25% down · 7.5% · 30yr
- Down + closing
- —
- Monthly P&I
- —
- Monthly cashflow
- —
- DSCR
- —
- Eligible?
- —
Personal DTI + credit; lowest rate.
DSCR
20% down · 8.5% · 30yr
- Down + closing
- —
- Monthly P&I
- —
- Monthly cashflow
- —
- DSCR
- —
- Eligible?
- —
No personal income docs; deal must DSCR.
Hard money
10% down · 12.0% · 12mo
- Down + closing
- —
- Monthly P&I
- —
- Monthly cashflow
- —
- DSCR
- —
- Eligible?
- —
Short-term bridge; refi at stabilization.
Rent comps 3 comps
| Address | Beds | Baths | Sqft | Rent | $/sqft | DOM | Units | Dist |
|---|---|---|---|---|---|---|---|---|
| 27160 Vista Rd Unit 19 Helendale, CA | 2.0 | 2.5 | 1060 | $1,800 | $1.70 | 0d | 1 | 0.02mi |
| 27535 Lakeview Dr #70 Helendale, CA | 2.0 | 1.0 | 930 | $1,725 | $1.85 | 0d | 1 | 0.53mi |
| 26272 Jordan Rd Helendale, CA | 2.0 | 1.0 | 1024 | $2,500 | $2.44 | 0d | 1 | 1.13mi |
HOA detail condo
- Monthly dues
- $235 · $2,820/yr
- Likely covers
- pool
- Assessments
- None detected in remarks — confirm with the listing agent.
Listing history 16 events
-
2026-06-21days on market $190,000 Active 26 DOM
-
2026-06-18days on market $190,000 Active 23 DOM
-
2026-06-17days on market $190,000 Active 22 DOM
-
2026-06-16days on market $190,000 Active 21 DOM
-
2026-06-15days on market $190,000 Active 20 DOM
-
2026-06-13days on market $190,000 Active 18 DOM
-
2026-06-13days on market $190,000 Active 17 DOM
-
2026-06-09days on market $190,000 Active 14 DOM
-
2026-06-08days on market $190,000 Active 13 DOM
-
2026-06-07days on market $190,000 Active 12 DOM
-
2026-06-04days on market $190,000 Active 9 DOM
-
2026-06-03days on market $190,000 Active 8 DOM
-
2026-06-02days on market $190,000 Active 7 DOM
-
2026-06-01days on market $190,000 Active 6 DOM
-
2026-05-31days on market $190,000 Active 5 DOM
-
2026-05-26$190,000 Active
ⓘ Source: listings_history table (triggers on properties + properties_extension) + one-shot
backfill from property_details.listing_events for pre-trigger history.
Climate risk First Street
- Flood 2/10 Low FEMA zone X (unshaded) · 5% chance over 30 yrs
- Wildfire 3/10 Moderate
- Heat 8/10 Severe 7 d/yr ≥102°F today · 18 d/yr by 30 yrs out
- Wind 1/10 Low
- Air quality 8/10 Severe 18 unhealthy d/yr today · 22 by 30 yrs out
Nearby sold comps map
Loading sold comps map…
Walkable amenities ~0.75 mi
Loading nearby amenities…
Taxation est. · year 1
- Rental income
- $22,038
- − Mortgage interest
- −$10,643
- − Property taxes
- −$2,850
- − Insurance
- −$950
- − Repairs & maintenance
- −$1,763
- − Management
- −$1,763
- − HOA
- −$2,820
- − Depreciation
- −$5,527
- Taxable loss
- −$4,279
- Est. tax savings @ 24.0%
- +$1,027
- After-tax cash flow
- $-140/yr
For passive investors: Depreciation is non-cash, so a rental often shows a tax loss while cash-flowing — sheltering income. Rental losses are passive: they offset passive income freely, and up to $25,000/yr can offset ordinary (W-2) income if you actively participate and your MAGI is under $100k (phasing out to $0 by $150k); unused losses carry forward. On sale, claimed depreciation is recaptured at up to 25%, and gains may owe capital-gains tax (a 1031 exchange can defer both). Figures are a year-1 estimate at your 24.0% rate — not tax advice; consult a CPA.
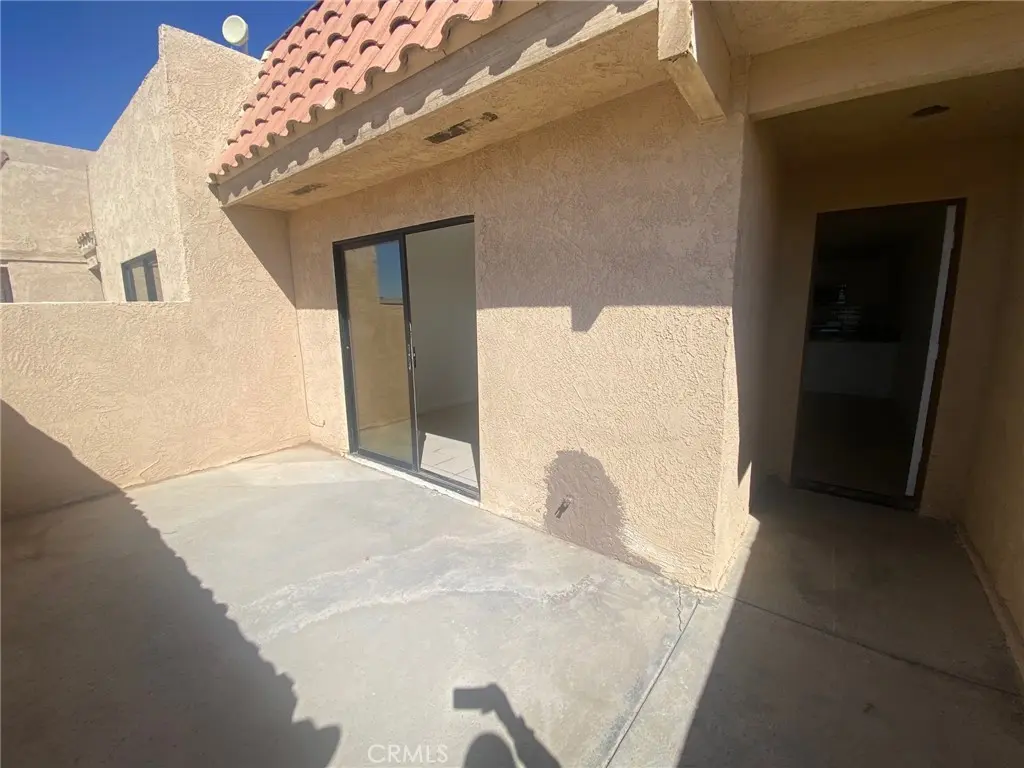
Condition & rehab AI · 1 photo
This Silver Lakes condo is in good condition with a good exterior and interior. A fresh coat of paint and some landscaping would significantly enhance its curb appeal and value.
Value-add opportunities
- Both Paint exterior walls — Enhances curb appeal and can increase both resale and rental value
- Both Landscaping — Improves curb appeal and can increase both resale and rental value
Renovation cost estimate screening
Value-add ROI direction
- Both Paint exterior walls — Enhances curb appeal and can increase both resale and rental value ↑
- Both Landscaping — Improves curb appeal and can increase both resale and rental value ↑
ⓘ Cost ranges are severity-bucket heuristics (US national rule-of-thumb). Get contractor quotes + a written scope before underwriting a rehab budget.
Schools (NCES district)
- District
- Victor Valley Union High
- NCES district ID
- 0636972
- Math proficiency
- 25% ▲ 6.00%
- Reading proficiency
- 25% ▼ -12.00%
- Median HH income
- $45,112
- Composite
- 21.6/100
- National rank
- #8296
- State rank
- #407 of 517 in CA
Livability — Silver Lakes
- Score
- 56/100
- State rank
- #822
- US rank
- #23053
Category grades
Schools grade is shown separately in the Schools card above.
Census & demographics
- Census place
- Silver Lakes, CA
- City population
- 6,677
- Population (ZIP)
- 6,677
Population outlook (San Bernardino County) Hauer SSP2
- Today (2025)
- 2,300,329 people
- By 2030
- 2,378,907 · +3.4%
- By 2040
- 2,523,137 · +9.7%
- By 2050
- 2,642,388 · +14.9%
- By 2075
- 2,880,769 · +25.2%
- By 2100
- 2,909,436 · +26.5%
Race, ethnicity, and origin ACS 2023
- Neighborhood character
- Highly diverse neighborhood (Simpson 0.71)
- Race & ethnicity
- White 49% Hispanic / Latino 22% Two or more races 22% Asian 5% Black 4% Pacific Islander 4%
- Hispanic origin (detail)
- Mexican 19% Puerto Rican 3%
- Common ancestry
- Lithuanian 2% Italian 2% Slovak 1%
- Foreign-born
- 9% · Canada, China, South Korea
- Languages at home
- 82% English-only · Spanish 13% Chinese 2% Other Indo-European 1%
Political lean MEDSL · San Bernardino
- 2024 margin
- Toss-up / Even · D 47.5% · R 49.7% · Other 2.8%
- 2008→2024 swing
- -8.5pp toward R · 2008: 6.3pp · 2024: -2.1pp
- All cycles
- 2024: R+2.1 2020: D+10.7 2016: D+9.8 2012: D+5.4 2008: D+6.3
Not yet ingested
- Civics
- —
Market trends
- HPI YoY
- ▲ 0.39%
- Current HPI
- 309.2904
- Rent YoY
- —
- Metro
- —
- State GDP YoY
- ▲ 3.21%
- F500 in state
- 116
Industry mix (Fortune 500 HQ in CA)
| Industry | F500 HQs | Revenue |
|---|---|---|
| Technology | 27 | $1,492B |
|
||
| Financial Services | 3 | $174B |
|
||
| Retail | 3 | $44B |
|
||
| Insurance | 3 | $26B |
|
||
| Media / Entertainment | 2 | $115B |
|
||
| Pharmaceuticals / Biotech | 2 | $62B |
|
||
Price history
1 event — show timeline
- 2026-05-26 Listed $190,000 CRMLS
Cash-flow waterfall
monthlySold comps — $/sqft
last 12 mo · ≤1 miLoading sold comps…