1055 Journey St NE · Crescent, GA
Flood risk 7/10 · Major
- FEMA flood zone
- X (shaded)
- Chance of flooding over 30 yrs
- 0.87%
- Est. flood insurance / yr
- $507 – $1,088
Fire risk 4/10 · Minor
- Est. fire insurance / yr
- $963 – $1,789
Heat risk 10/10 · Severe
- Hot days now (above 107°F)
- 7 days/yr
- Hot days in 30 yrs
- 19 days/yr
Wind risk 9/10 · Severe
- Chance of severe wind over 30 yrs
- 99.0%
Air-quality risk 2/10 · Minimal
- Unhealthy air days now
- 2 days/yr
- Unhealthy air days in 30 yrs
- 2 days/yr
Risk factors via First Street. Map © Google.
Why this score? — see what drove the B grade
The composite is a weighted blend of 9 inputs, each scored 0–100. Each bar is that input's sub-score; the figure is the points it added to the 100-point composite (weight × sub-score).
- Cash flow +28.2/30.0
- DSCR +10.0/10.0
- Appreciation +10.0/10.0
- 1% rule +7.8/10.0
- ARV discount +7.5/15.0
- Rent growth +2.5/5.0
- Livability +2.5/5.0
- Schools +2.2/10.0
- Condition / age +1.0/5.0
$72,900
🖨 Deal sheet (PDF) 📄 Offer letter ✓ Due diligence
Listing remarks
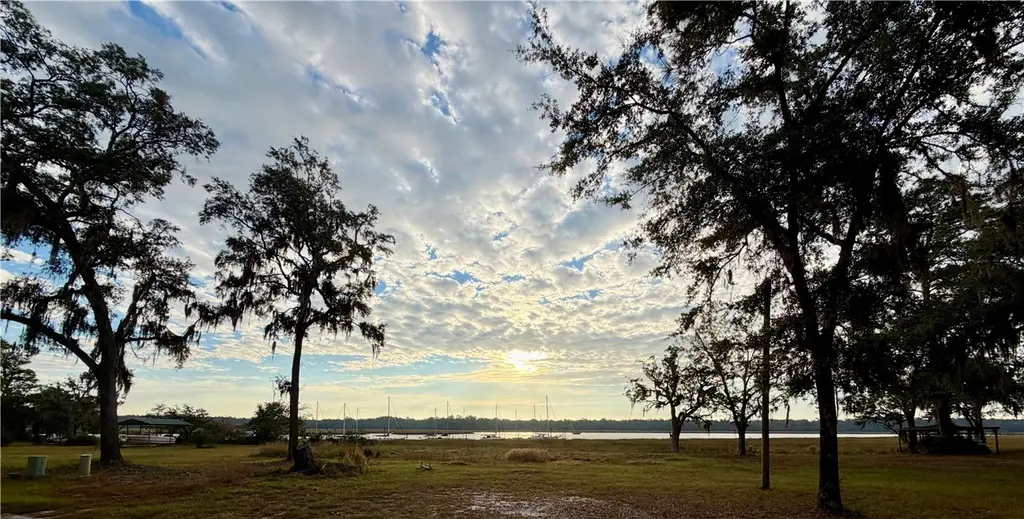
AFFOR-DA-BILITY at the COAST!!! Beautiful marsh and Julienton river view from this property located at Dallas Bluff Marina in Shellman Bluff. 2-bedroom 2-bath mobile home with screened in front porch, car/boat port and utility shed. This is the perfect fisherman's get-away place. There is a monthly land rental of $400, to include water and grounds. You only pay taxes on the dwelling.
Key facts
- Julienton river view
- Utility shed
- Marsh view
Tags
Property features AI
Finance
- Financial info: Land lease of $400 per month
Exterior
- Parking: Carport with 2 spaces
- Utilities: Distances to electric, gas, sewer, and water utilities measured in feet
- Exterior features: Dirt road surface; Waterfront property on Julienton River
Interior
- Bedrooms: 2 bedrooms on the main level
- Bathrooms: 2 full bathrooms
- Interior features: Total of 4 rooms
Neighborhood map
What this means for you Summary
Snapshot
- This is a 2-bed/2.0-bath manufactured listed at $73k. Condition is rated poor.
Deal economics
- At list price, monthly cash flow is $165 ($2k/yr) — positive.
- The deal already cash-flows at list — no discount required.
- Meets the 1% rule at list price ($930 rent vs $73k).
- Recommended offer: $72k (1.5% below list) — sets the bar for market timing.
- Cap rate 10.1% vs local median 1.0% in Crescent — top-decile yield for the area; either an underpriced asset or a hidden risk that comps aren't pricing in. Stress-test before assuming the spread holds.
Location & tenants
- Location reads: area grade B — affects rentability + tenant quality, not the cash-flow math above.
- Mcintosh County (town): math 23% / reading 29% proficiency, ranked #118 of 174 in GA (top 68%) — low school quality limits family demand, transient renter base, plan for 1-2y turnover; 73% free/reduced lunch — lower-income household profile, screen leases tightly.
- Market conditions: 293 active listings in the ZIP; 127 units permitted in McIntosh County in 2024 (0 in 5+ unit buildings).
Forward outlook
- In year one you build about $8k of equity ($504 loan paydown + $7k appreciation (10.0% local appreciation)).
- McIntosh County population projected at -34% by 2050 — secular population decline; favor cash flow + early exit over multi-decade hold.
- At projected returns (10.0% appreciation + 3.0% rent growth), your $20k cash investment doubles in ~2 years — after that, you're playing with house money.
- By year 5, paydown + projected appreciation supports a ~$36k cash-out refi (75% LTV) — recoverable capital for the next deal without selling this one.
Negotiation context
- It's been on market 26 days — a 2% lower offer ($72k) is reasonable based on typical stale-listing flexibility.
Risks & watch-outs
- Watch-outs: flood insurance adds $66/mo.
- Climate carrying-cost: major flood risk; severe wind risk, 99% chance of damaging wind over 30y; extreme-heat days projected 7→19/yr by 2055 (HVAC capex compounding) — expect insurance premiums to compound above CPI over the hold.
Questions for the listing agent
- Have any recent inspections been done? Can we get a copy of the seller's disclosures and any deferred-maintenance estimates?
- What's the actual annual flood-insurance premium (NFIP or private), and is the property in a SFHA with mandatory coverage?
- Is there a deadline driving the sale (1031 exchange, divorce, estate, relocation)? That informs how much negotiation room exists.
- What's the average days-on-market for RENTAL listings here right now (not sales)? A rising rental-DOM trend means longer vacancies and softer asking-rent achievability than the comps imply.
- What's the recent tenant-quality profile in this submarket — average credit score on applications, eviction rate, late-payment / NSF rate, and stable-employment percentage? A property-management company in the area should have these aggregated.
- How much new for-sale + rental construction is in the pipeline within 1–3 miles? Heavy new supply typically softens prices + rents 12–24 months out; constrained supply supports both.
Investment metrics
- 1% rule
- 1.28% ✓
- Cap rate
- 10.10%
- Cash-on-cash
- 13.59%
- DSCR
- 1.60
- GRM
- 6.5
CMA / ARV
- ARV (median comp)
- $164,337
- List price
- $72,900
- Delta
- -55.64%
- Verdict
- UNDERPRICED
- Comps
- 4 within 2.0 mi
Projected returns pro-forma
10.0% appreciation · 3.0% rent growth · sell at horizon
- IRR
- 31.4%
- Equity multiple
- 3.46×
- Total profit
- $50,245
- Equity at exit
- $65,674
- IRR
- 27.2%
- Equity multiple
- 7.85×
- Total profit
- $139,826
- Equity at exit
- $141,629
Cash invested: $20,412 (down + closing). Projections, not guarantees.
Landlord ↔ Tenant lean methodology
- Overall (STATE)
- 90 Strongly Landlord-Friendly
- State Georgia
- 90 Strongly Landlord-Friendly · R+3
- County
- — inherits STATE
- City
- — inherits STATE
ZIP-level market 31331
- Active inventory
- 293
- Price-to-rent
- 6.5×
Monthly cashflow live
- Estimated rent
- $930 medium interval (Pro) →
- Mortgage (P&I)
- −$382
- Tax est. 1.5%
- −$91 /mo · $1,094/yr
- Insurance
- −$30
- Flood insurance flood zone
- −$66 /mo · $798/yr
- HOA
- −$0
- Vacancy / Maint / Mgmt
- −$195
- Net cashflow
- $165
Break-even live
Sensitivity live
| Price | -10% $215 | -5% $190 | +0% $165 | +5% $139 | +10% $114 |
|---|---|---|---|---|---|
| Rent | -10% $91 | -5% $128 | +0% $165 | +5% $201 | +10% $238 |
| Rate | -1.0pp $201 | -0.5pp $183 | base $165 | +0.5pp $146 | +1.0pp $127 |
UW: 25.0% down · 7.5% · 30yr · 1.5% tax · 5.0% vac · 8.0% maint · 8.0% mgmt
Financing live
Cash to close
- Down payment
- $18,225
- Closing costs
- $2,187
- Reserves months
- —
- Total cash needed
- —
Loan-product check · same deal, 3 products live
Conventional
25% down · 7.5% · 30yr
- Down + closing
- —
- Monthly P&I
- —
- Monthly cashflow
- —
- DSCR
- —
- Eligible?
- —
Personal DTI + credit; lowest rate.
DSCR
20% down · 8.5% · 30yr
- Down + closing
- —
- Monthly P&I
- —
- Monthly cashflow
- —
- DSCR
- —
- Eligible?
- —
No personal income docs; deal must DSCR.
Hard money
10% down · 12.0% · 12mo
- Down + closing
- —
- Monthly P&I
- —
- Monthly cashflow
- —
- DSCR
- —
- Eligible?
- —
Short-term bridge; refi at stabilization.
Listing history 19 events
-
2026-06-21days on market $72,900 Active 26 DOM
-
2026-06-19days on market $72,900 Active 24 DOM
-
2026-06-18days on market $72,900 Active 23 DOM
-
2026-06-17days on market $72,900 Active 22 DOM
-
2026-06-16days on market $72,900 Active 21 DOM
-
2026-06-15days on market $72,900 Active 20 DOM
-
2026-06-14days on market $72,900 Active 18 DOM
-
2026-06-13days on market $72,900 Active 17 DOM
-
2026-06-10days on market $72,900 Active 15 DOM
-
2026-06-09days on market $72,900 Active 14 DOM
-
2026-06-08days on market $72,900 Active 13 DOM
-
2026-06-07days on market $72,900 Active 12 DOM
-
2026-06-05days on market $72,900 Active 9 DOM
-
2026-06-03days on market $72,900 Active 8 DOM
-
2026-06-02days on market $72,900 Active 7 DOM
-
2026-06-01days on market $72,900 Active 6 DOM
-
2026-05-31days on market $72,900 Active 5 DOM
-
2026-05-30days on market $72,900 Active 4 DOM
-
2025-11-26$72,900 Active 386-char remark
ⓘ Source: listings_history table (triggers on properties + properties_extension) + one-shot
backfill from property_details.listing_events for pre-trigger history.
Climate risk First Street
- Flood 7/10 Severe FEMA zone X (shaded) · 87% chance over 30 yrs
- Wildfire 4/10 Moderate
- Heat 10/10 Extreme 7 d/yr ≥107°F today · 19 d/yr by 30 yrs out
- Wind 9/10 Extreme 99% chance of damaging wind over 30 yrs
- Air quality 2/10 Low 2 unhealthy d/yr today · 2 by 30 yrs out
Nearby sold comps map
Loading sold comps map…
Walkable amenities ~0.75 mi
Loading nearby amenities…
Taxation est. · year 1
- Rental income
- $11,163
- − Mortgage interest
- −$4,084
- − Property taxes
- −$1,094
- − Insurance
- −$1,162
- − Repairs & maintenance
- −$893
- − Management
- −$893
- − Depreciation
- −$2,121
- Taxable income
- $917
- Est. tax owed @ 24.0%
- −$220
- After-tax cash flow
- $1,756/yr
For passive investors: Depreciation is non-cash, so a rental often shows a tax loss while cash-flowing — sheltering income. Rental losses are passive: they offset passive income freely, and up to $25,000/yr can offset ordinary (W-2) income if you actively participate and your MAGI is under $100k (phasing out to $0 by $150k); unused losses carry forward. On sale, claimed depreciation is recaptured at up to 25%, and gains may owe capital-gains tax (a 1031 exchange can defer both). Figures are a year-1 estimate at your 24.0% rate — not tax advice; consult a CPA.
Condition & rehab AI · 1 photo
This mobile home requires extensive repairs and updates to its roof, exterior, interior walls/paint, HVAC system, and landscaping to improve its condition and value.
Repairs flagged
- Major roof — No photos of the roof
- Major exterior — No photos of the exterior
- Major interior walls/paint — No photos of the interior walls/paint
- Major HVAC/mechanicals — No photos of the HVAC/mechanicals
- Major landscaping/curb appeal — No photos of the landscaping/curb appeal
Value-add opportunities
- Both roof replacement — A new roof would significantly improve the home's appearance and value
- Both exterior painting — Fresh paint would enhance curb appeal and home value
- Both HVAC system upgrade — A new HVAC system would improve comfort and energy efficiency
- Both landscaping and curb appeal — A well-maintained yard and curb appeal would attract more buyers/renters
Renovation cost estimate screening
| Repair item | Severity | Est. cost |
|---|---|---|
| roof · No photos of the roof | Major | $15,000–50,000 |
| exterior · No photos of the exterior | Major | $15,000–50,000 |
| interior walls/paint · No photos of the interior walls/paint | Major | $15,000–50,000 |
| HVAC/mechanicals · No photos of the HVAC/mechanicals | Major | $15,000–50,000 |
| landscaping/curb appeal · No photos of the landscaping/curb appeal | Major | $15,000–50,000 |
| Total estimated repair cost · 5 items | $75,000–250,000 |
Value-add ROI direction
- Both roof replacement — A new roof would significantly improve the home's appearance and value ↑
- Both exterior painting — Fresh paint would enhance curb appeal and home value ↑
- Both HVAC system upgrade — A new HVAC system would improve comfort and energy efficiency ↑
- Both landscaping and curb appeal — A well-maintained yard and curb appeal would attract more buyers/renters ↑
ⓘ Cost ranges are severity-bucket heuristics (US national rule-of-thumb). Get contractor quotes + a written scope before underwriting a rehab budget.
Schools (NCES district)
- District
- Mcintosh County
- NCES district ID
- 1303600
- Math proficiency
- 23% ▬ 0.00%
- Reading proficiency
- 29% ▼ -1.00%
- Median HH income
- $41,742
- Composite
- 22.08/100
- National rank
- #8188
- State rank
- #118 of 174 in GA
Livability — Crescent
No livability data for this city. (Only ~50 U.S. cities are tracked.)
Census & demographics
- Population (ZIP)
- 5,997
Population outlook (McIntosh County) Hauer SSP2
- Today (2025)
- 12,922 people
- By 2030
- 12,156 · -5.9%
- By 2040
- 10,332 · -20.0%
- By 2050
- 8,526 · -34.0%
- By 2075
- 5,506 · -57.4%
- By 2100
- 3,635 · -71.9%
Race, ethnicity, and origin ACS 2023
- Neighborhood character
- Majority White (64%)
- Race & ethnicity
- White 64% Black 28% Two or more races 6%
- Common ancestry
- Italian 1% French 1% Serbian 1%
- Foreign-born
- 0%
- Languages at home
- 99% English-only · German/W. Germanic 1%
Political lean MEDSL · McIntosh
- 2024 margin
- Strong R (+28.6) · D 35.5% · R 64.1%
- 2008→2024 swing
- -22.6pp toward R · 2008: -6.0pp · 2024: -28.6pp
- All cycles
- 2024: R+28.6 2020: R+21.0 2016: R+20.1 2012: R+8.6 2008: R+6.0
Not yet ingested
- Civics
- —
Market trends
- HPI YoY
- ▲ 85.75%
- Current HPI
- 329.1351
- Rent YoY
- —
- Metro
- —
- State GDP YoY
- ▲ 2.66%
- F500 in state
- 28
Industry mix (Fortune 500 HQ in GA)
| Industry | F500 HQs | Revenue |
|---|---|---|
| Paper / Packaging | 2 | $29B |
|
||
| Retail | 1 | $160B |
|
||
| Transportation / Logistics | 1 | $91B |
|
||
| Airlines | 1 | $62B |
|
||
| Consumer Goods | 1 | $47B |
|
||
| Utilities | 1 | $25B |
|
||
Price history
1 event — show timeline
- 2026-05-26 Listed $72,900 GIAR
Cash-flow waterfall
monthlySold comps — $/sqft
last 12 mo · ≤1 miLoading sold comps…