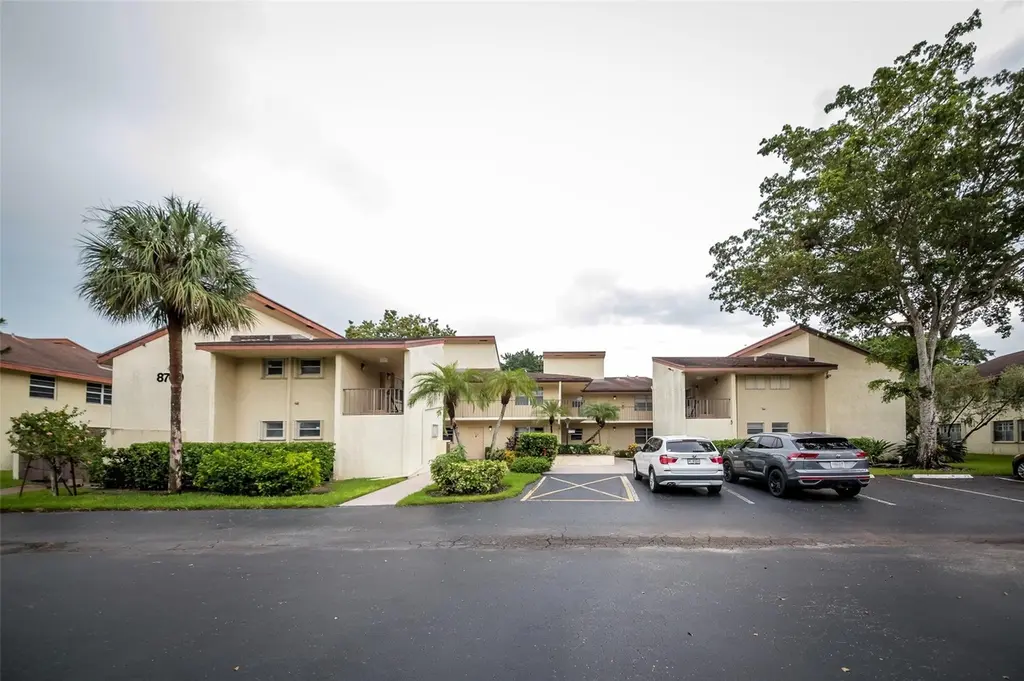
8760 Holly Ct #104 · Tamarac, FL
Flood risk 1/10 · Minimal
- FEMA flood zone
- AH
- Chance of flooding over 30 yrs
- 0.0%
- Est. flood insurance / yr
- $1,142 – $2,507
Fire risk 3/10 · Minor
- Est. fire insurance / yr
- $947 – $1,759
Heat risk 9/10 · Severe
- Hot days now (above 106°F)
- 7 days/yr
- Hot days in 30 yrs
- 24 days/yr
Wind risk 10/10 · Severe
- Chance of severe wind over 30 yrs
- 99.0%
Air-quality risk 3/10 · Minor
- Unhealthy air days now
- 2 days/yr
- Unhealthy air days in 30 yrs
- 3 days/yr
Risk factors via First Street. Map © Google.
Why this score? — see what drove the C grade
The composite is a weighted blend of 9 inputs, each scored 0–100. Each bar is that input's sub-score; the figure is the points it added to the 100-point composite (weight × sub-score).
- Cash flow +19.6/30.0
- 1% rule +10.0/10.0
- ARV discount +7.5/15.0
- DSCR +6.2/10.0
- Schools +4.1/10.0
- Livability +3.8/5.0
- Condition / age +2.5/5.0
- Rent growth +2.0/5.0
- Appreciation +0.0/10.0
$185,000
🖨 Deal sheet 📄 Offer letter ✓ Due diligence
Listing remarks
Spacious 2-Bedroom, 2-Bath Unit with Serene Golf Course Views! This generously sized condo offers a bright and open living/dining area, oversized bedrooms, and a screened balcony perfect for enjoying the peaceful surroundings. The unit is in overall fair condition and offers great potential with your personal touch. Conveniently located near schools, shopping, Coral Springs, and the Tamarac Sports Complex. Buyer requirements include a minimum 680 credit score and placing one year of maintenance fees in escrow for 36 months. Property is being sold AS IS. Buyer is solely responsible for verifying any assessments, HOA fees. Cash offers only, since the HOA does not have proper coverage on their
Key facts
- $565 HOA
- 2 parking spots
- Community pool
Property features AI
Finance
- Financial info: Pets allowed with breed restrictions
- HOA & community: HOA with monthly fee of $565; HOA includes insurance, grounds and structure maintenance, sewer, trash, water, pool service; Community amenities: clubhouse, golf course, parking, pool, maintenance
Exterior
- Parking: 2 total parking spaces; Assigned parking; Guest parking
- Security: Other security features
- Utilities: Public water; Public sewer; Sewer connected; Water available
- Home design: Condominium; 2 stories; Resale; Faces north
- Construction: CBS construction
- Exterior features: Non-waterfront property; Shingle roof
Interior
- Kitchen: Disposal; Electric range
- Bedrooms: 2 bedrooms on the main level
- Flooring: Carpet; Tile
- Bathrooms: 2 full bathrooms
- Heating & cooling: Central heating; Central air conditioning
- Interior features: Entrance foyer
- Laundry & utility: Washer hookup
Neighborhood map
What this means for you Summary
Snapshot
- This is a 3-bed/2.0-bath condo listed at $185k.
Deal economics
- At list price, monthly cash flow is $61 ($734/yr) — positive.
- The deal already cash-flows at list — no discount required.
- Meets the 1% rule at list price ($3k rent vs $185k).
- Cap rate 7.7% vs local median 3.9% in Tamarac — top-decile yield for the area; either an underpriced asset or a hidden risk that comps aren't pricing in. Stress-test before assuming the spread holds.
Location & tenants
- Location reads 76/100 on livability (#239 in FL, #3,785 nationally) — a middle-class / working-renter tenant base. Strengths: housing A+, health & safety A+, cost of living A-; Watch: employment C-, amenities F, commute F.
- Broward (suburban): math 42% / reading 53% proficiency, ranked #46 of 73 in FL (top 63%) — families likely to look elsewhere, expect single-tenant / working-renter base with shorter leases.
- Zoned schools: Tamarac Elementary School (math 25% / reading 45%, grade F, #1,697 of 2,144 statewide, top 80%, 626 students, 75% FRL); J. P. Taravella High School (math 19% / reading 45%, grade F, #415 of 667 statewide, top 63%, 2,586 students, 54% FRL).
- Zoned-school proficiency averages 34% at this address vs 48% district-wide (-14 pts) — the specific schools serving this property underperform the Broward average; the district grade overstates school quality for this exact location.
- Market conditions: Rents soft (-1.9%/yr); 588 active listings in the ZIP; 40 comparable units currently listed for rent nearby; rentals at typical pace (median 25d on market — plan ~3-4 weeks tenant-placement turnaround); 2,111 units permitted in Broward County in 2024 (1,265 in 5+ unit buildings).
- At $2,994/mo this rent would consume 58% of the median local household income ($62k/yr) (locally 1394% of renters already pay >50% of income on rent) — very limited rent-growth headroom before tenants either downsize or default.
Forward outlook
- Local home prices are declining (-3.0%/yr); year-one equity from $1k of loan paydown is wiped out by about $6k of value loss. Plan a longer hold.
- Broward County population projected at +34% by 2050 — long-run rental-demand tailwind backs the buy-and-hold thesis.
Negotiation context
- Only 14 days on market — expect competitive offers; lowballing is unlikely to land.
- 2 sale attempts with the ask held roughly flat each time — persistent listings suggest the price (not the market) is what's stuck; bring a comps-based counter.
- Current owner paid $102k; list at $185k implies a 81% gain — meaningful room to come down on a strong offer.
Risks & watch-outs
- Watch-outs: property tax is 3.5% of price; flood insurance adds $152/mo.
- Climate carrying-cost: in FEMA flood zone AH (mandatory federal flood insurance); severe wind risk, 99% chance of damaging wind over 30y; extreme-heat days projected 7→24/yr by 2055 (HVAC capex compounding) — expect insurance premiums to compound above CPI over the hold.
Questions for the listing agent
- Built in 1979 — when were the roof, HVAC, electrical panel, plumbing, and water heater last replaced?
- Property tax is high relative to price — has the assessment been appealed recently, and will the sale trigger a re-assessment?
- What's the actual annual flood-insurance premium (NFIP or private), and is the property in a SFHA with mandatory coverage?
- What does the HOA fee cover, when was the last increase, and are there any pending special assessments or reserve-fund shortfalls?
- Any open or pending special assessments — roof, HVAC, plumbing, elevator, façade? What's the per-unit balance and payoff schedule, and is the seller paying it off at close or rolling it to the buyer?
- Is there a deadline driving the sale (1031 exchange, divorce, estate, relocation)? That informs how much negotiation room exists.
- Schools are B-rated — typically a magnet for longer-tenancy family renters. What's the average tenant stay here, and is there a school-zone premium baked into asking?
- What's the average days-on-market for RENTAL listings here right now (not sales)? A rising rental-DOM trend means longer vacancies and softer asking-rent achievability than the comps imply.
- What's the recent tenant-quality profile in this submarket — average credit score on applications, eviction rate, late-payment / NSF rate, and stable-employment percentage? A property-management company in the area should have these aggregated.
- How much new apartment / multifamily construction is in the pipeline within 1–3 miles? Heavy new supply (>2% of stock underway) typically softens rents 12–24 months out; light construction supports rent growth.
Investment metrics
- 1% rule
- 1.62% ✓
- Cap rate
- 7.68%
- Cash-on-cash
- 4.94%
- DSCR
- 1.22
- GRM
- 5.1
CMA / ARV
No comps found within radius.
Projected returns pro-forma
-3.0% appreciation · 0.0% rent growth · sell at horizon
- IRR
- -19.8%
- Equity multiple
- 0.34×
- Total profit
- $-34,182
- Equity at exit
- $27,584
- IRR
- -34.0%
- Equity multiple
- -0.08×
- Total profit
- $-55,918
- Equity at exit
- $15,995
Cash invested: $51,800 (down + closing). Projections, not guarantees.
Landlord ↔ Tenant lean methodology
- Overall (STATE)
- 87 Strongly Landlord-Friendly
- State Florida
- 87 Strongly Landlord-Friendly · R+3
- County
- — inherits STATE
- City
- — inherits STATE
ZIP-level market 33321
- Home prices YoY
- -30.4%
- Rents YoY
- -1.9%
- Active inventory
- 588
- Price-to-rent
- 5.1×
Monthly cashflow live
- Estimated rent
- $2,994 high interval (Pro) →
- Mortgage (P&I)
- −$970
- Tax from tax record
- −$540 /mo · $6,481/yr
- Insurance
- −$77
- Flood insurance flood zone
- −$152 /mo · $1,824/yr
- HOA
- −$565
- Vacancy / Maint / Mgmt
- −$629
- Net cashflow
- $61
Break-even live
UW: 25.0% down · 7.5% · 30yr · 1.5% tax · 5.0% vac · 8.0% maint · 8.0% mgmt
Financing live
Cash to close
- Down payment
- $46,250
- Closing costs
- $5,550
- Reserves months
- —
- Total cash needed
- —
Loan-product check · same deal, 3 products live
Conventional
25% down · 7.5% · 30yr
- Down + closing
- —
- Monthly P&I
- —
- Monthly cashflow
- —
- DSCR
- —
- Eligible?
- —
Personal DTI + credit; lowest rate.
DSCR
20% down · 8.5% · 30yr
- Down + closing
- —
- Monthly P&I
- —
- Monthly cashflow
- —
- DSCR
- —
- Eligible?
- —
No personal income docs; deal must DSCR.
Hard money
10% down · 12.0% · 12mo
- Down + closing
- —
- Monthly P&I
- —
- Monthly cashflow
- —
- DSCR
- —
- Eligible?
- —
Short-term bridge; refi at stabilization.
Rent comps 40 comps
| Address | Beds | Baths | Sqft | Rent | $/sqft | DOM | Units | Dist |
|---|---|---|---|---|---|---|---|---|
| 8770 Azalea Ct #203 Tamarac, FL | 2.0 | 2.0 | 1306 | $2,600 | $1.99 | 2d | 1 | 0.13mi |
| 7561 NW 88th Ter Tamarac, FL | 3.0 | 2.5 | 1358 | $2,995 | $2.21 | 24d | 2 | 0.21mi |
| 7640 Westwood Dr Tamarac, FL | 2.0–3.0 | 2.0 | 1169 | $2,600 | $2.22 | 17d | 2 | 0.41mi |
| 9507 NW 80th Ct Tamarac, FL | 3.0 | 2.0 | 1629 | $2,900 | $1.78 | 24d | 1 | 0.45mi |
| 7304 Westwood Dr Unit 7304 Tamarac, FL | 3.0 | 2.0 | 1524 | $3,900 | $2.56 | 24d | 1 | 0.64mi |
| 9485 N Belfort Cir #308 Tamarac, FL | 2.0 | 2.0 | 1228 | $2,100 | $1.71 | 14d | 1 | 0.64mi |
| 7765 Yardley Dr #107 Fort Lauderdale, FL | 2.0 | 2.0 | 1469 | $2,200 | $1.50 | 12d | 1 | 0.66mi |
| 8660 S Southgate Shores Cir Tamarac, FL | 2.0 | 2.5 | 1230 | $2,625 | $2.13 | 24d | 1 | 0.66mi |
| 8090 NW 96th Ter Tamarac, FL | 1.0–3.0 | 1.0–2.0 | 1154 | $2,840 | $2.46 | 2d | 19 | 0.67mi |
| 7755 Yardley Dr #112 Fort Lauderdale, FL | 2.0 | 2.0 | 1229 | $2,400 | $1.95 | 24d | 1 | 0.67mi |
| 8108 Prestige Commons Dr Tamarac, FL | 3.0 | 2.5 | 1478 | $3,200 | $2.17 | 24d | 1 | 0.76mi |
| 8601 W McNab Rd Tamarac, FL | 3.0 | 1.0–2.0 | 993 | $2,961 | $2.98 | 4d | 11 | 0.77mi |
| 8731 Cypress Walk Ct Tamarac, FL | 3.0 | 2.5 | 1700 | $2,800 | $1.65 | 24d | 1 | 0.85mi |
| 6716 Cypress Walk Ter Unit 6716 Tamarac, FL | 3.0 | 2.5 | 1272 | $2,550 | $2.00 | 24d | 1 | 0.88mi |
| 8033 NW 71st Ct #8033 Tamarac, FL | 3.0 | 3.0 | 1417 | $3,100 | $2.19 | 24d | 1 | 1.03mi |
| 8009 NW 71st Ct Tamarac, FL | 3.0 | 3.0 | 1621 | $2,999 | $1.85 | 24d | 1 | 1.07mi |
| 7835 NW 78th Ave Tamarac, FL | 3.0 | 2.5 | 2084 | $3,900 | $1.87 | 20d | 1 | 1.07mi |
| 7835 NW 78th Ave Tamarac, FL | 3.0 | 2.5 | 2084 | $3,900 | $1.87 | 4d | 1 | 1.07mi |
| 7835 NW 78th Ave Tamarac, FL | 3.0 | 2.5 | 2084 | $4,200 | $2.02 | 24d | 1 | 1.07mi |
| 10630 NW 2nd Pl Coral Springs, FL | 4.0 | 2.0 | 1907 | $3,900 | $2.05 | 24d | 1 | 1.07mi |
| 6311 NW 90th Ave Tamarac, FL | 2.0 | 2.0 | 1784 | $2,700 | $1.51 | 24d | 1 | 1.13mi |
| 7842 Exeter Blvd E Tamarac, FL | 3.0 | 2.0 | 2016 | $2,750 | $1.36 | 20d | 1 | 1.16mi |
| 7801 NW 70th Ct Tamarac, FL | 4.0 | 2.0 | 2000 | $3,800 | $1.90 | 24d | 1 | 1.22mi |
| 10426 E Clairmont Cir #212 Tamarac, FL | 2.0 | 2.0 | 1294 | $2,100 | $1.62 | 24d | 1 | 1.22mi |
| 8171 N University Dr Tamarac, FL | 1.0–2.0 | 1.0–2.5 | 1117 | $2,748 | $2.46 | 2d | 9 | 1.24mi |
| 8027 Lagos de Campo Blvd Unit A4 Tamarac, FL | 3.0 | 2.5 | 1230 | $3,000 | $2.44 | 24d | 1 | 1.25mi |
| 10350 E Clairmont Cir #312 Tamarac, FL | 2.0 | 2.0 | 1294 | $2,300 | $1.78 | 24d | 1 | 1.27mi |
| 8205 NW 106th Ave Tamarac, FL | 3.0 | 2.0 | 1587 | $3,500 | $2.21 | 5d | 1 | 1.33mi |
| 8105 NW 74th Ter Tamarac, FL | 4.0 | 3.0 | 1794 | $4,700 | $2.62 | 17d | 1 | 1.36mi |
| 8109 NW 74th Ter Tamarac, FL | 4.0 | 2.0 | 2243 | $3,950 | $1.76 | 24d | 1 | 1.36mi |
| 9481 Stanley Ln #9481 Tamarac, FL | 3.0 | 2.5 | 1636 | $3,200 | $1.96 | 24d | 1 | 1.37mi |
| 11526 NW 5th St Coral Springs, FL | 4.0 | 3.0 | 2044 | $4,500 | $2.20 | 24d | 1 | 1.37mi |
| 9787 Riverside Dr Unit 62-4 Coral Springs, FL | 3.0 | 2.5 | 1400 | $2,799 | $2.00 | 24d | 1 | 1.40mi |
| 7214 S Devon Dr #211 Tamarac, FL | 2.0 | 2.0 | 1292 | $2,400 | $1.86 | 24d | 1 | 1.40mi |
| 9606 SW 1st Ct Unit 16S Coral Springs, FL | 3.0 | 2.0 | 1396 | $2,950 | $2.11 | 7d | 1 | 1.41mi |
| 5955 London Ln Tamarac, FL | 3.0 | 2.5 | 1418 | $2,800 | $1.97 | 17d | 1 | 1.41mi |
| 9788 NW 3rd Mnr Coral Springs, FL | 4.0 | 3.0 | 1941 | $4,850 | $2.50 | 3d | 1 | 1.41mi |
| 9788 NW 3rd Mnr Coral Springs, FL | 4.0 | 3.0 | 1941 | $5,000 | $2.58 | 11d | 1 | 1.41mi |
| 5870 S Golden Beauty Ln Tamarac, FL | 2.0 | 2.5 | 1381 | $2,400 | $1.74 | 24d | 1 | 1.42mi |
| 11236 NW 7th St Coral Springs, FL | 4.0 | 2.0 | 1888 | $3,885 | $2.06 | 17d | 1 | 1.43mi |
HOA detail condo
- Monthly dues
- $565 · $6,780/yr
- Assessments
- None detected in remarks — confirm with the listing agent.
Listing history 12 events
-
2026-06-07status $185,000 Pending 14 DOM
-
2026-06-04days on market $185,000 Active 14 DOM
-
2026-06-03days on market $185,000 Active 13 DOM
-
2026-06-02days on market $185,000 Active 12 DOM
-
2026-06-01days on market $185,000 Active 11 DOM
-
2026-05-31days on market $185,000 Active 10 DOM
-
2026-05-21$185,000 Active
-
2026-04-04status Pending
-
2026-04-03historical
-
2026-03-18price $185,000
-
2025-12-08$225,000 Active
-
1979-09-01soldstatus $102,000
ⓘ Source: listings_history table (triggers on properties + properties_extension) + one-shot
backfill from property_details.listing_events for pre-trigger history.
Tax reassessment forecast FL · Resets to sale price
- Current annual tax
- $6,481 · $540/mo
- Projected year-2 tax
- $6,481 · $540/mo
- Expected delta
- $0/yr ($0/mo · 0.0%)
ⓘ Screening estimate from a state-policy table — verify with the county assessor before closing.
Climate risk First Street
- Flood 1/10 Low FEMA zone AH · 0% chance over 30 yrs
- Wildfire 3/10 Moderate
- Heat 9/10 Extreme 7 d/yr ≥106°F today · 24 d/yr by 30 yrs out
- Wind 10/10 Extreme 99% chance of damaging wind over 30 yrs
- Air quality 3/10 Moderate 2 unhealthy d/yr today · 3 by 30 yrs out
Nearby sold comps map
Loading sold comps map…
Walkable amenities ~0.75 mi
Loading nearby amenities…
Taxation est. · year 1
- Rental income
- $35,932
- − Mortgage interest
- −$10,363
- − Property taxes
- −$6,481
- − Insurance
- −$2,750
- − Repairs & maintenance
- −$2,875
- − Management
- −$2,875
- − HOA
- −$6,780
- − Depreciation
- −$5,382
- Taxable loss
- −$1,572
- Est. tax savings @ 24.0%
- +$377
- After-tax cash flow
- $1,111/yr
For passive investors: Depreciation is non-cash, so a rental often shows a tax loss while cash-flowing — sheltering income. Rental losses are passive: they offset passive income freely, and up to $25,000/yr can offset ordinary (W-2) income if you actively participate and your MAGI is under $100k (phasing out to $0 by $150k); unused losses carry forward. On sale, claimed depreciation is recaptured at up to 25%, and gains may owe capital-gains tax (a 1031 exchange can defer both). Figures are a year-1 estimate at your 24.0% rate — not tax advice; consult a CPA.
Schools (NCES district)
- District
- Broward
- NCES district ID
- 1200180
- Math proficiency
- 42% ▼ -18.00%
- Reading proficiency
- 53% ▼ -5.00%
- Median HH income
- $52,139
- Composite
- 40.88/100
- National rank
- #3621
- State rank
- #46 of 73 in FL
Livability — Tamarac
- Score
- 76/100
- State rank
- #239
- US rank
- #3785
Category grades
Schools grade is shown separately in the Schools card above.
Census & demographics
- Census place
- Tamarac, FL
- County
- Broward County · 1,963,430 people
- City population
- 105,666
- Metro
- Miami-Fort Lauderdale-Pompano Beach, FL
- Population (ZIP)
- 51,216
- Household income
- $62,066
- Rent vs Own
- Severe rent burden
- 1394.0
Population outlook (Broward County) Hauer SSP2
- Today (2025)
- 2,207,033 people
- By 2030
- 2,360,704 · +7.0%
- By 2040
- 2,661,208 · +20.6%
- By 2050
- 2,946,698 · +33.5%
- By 2075
- 3,602,273 · +63.2%
- By 2100
- 3,970,984 · +79.9%
Race, ethnicity, and origin ACS 2023
- Neighborhood character
- Highly diverse neighborhood (Simpson 0.70)
- Race & ethnicity
- Hispanic / Latino 34% White 33% Black 27% Two or more races 20% Asian 3%
- Hispanic origin (detail)
- Mexican 2% Puerto Rican 5% Cuban 5% Dominican 3%
- Common ancestry
- Romanian 3% Hispanic 3% Scotch-Irish 2%
- Foreign-born
- 38% · Canada, Jamaica, Dominican Republic
- Languages at home
- 63% English-only · Spanish 29% French/Haitian/Cajun 4% Other Indo-European 1%
Political lean MEDSL · Broward
- 2024 margin
- D (+17.0) · D 58.0% · R 41.0%
- 2008→2024 swing
- -17.8pp toward R · 2008: 34.7pp · 2024: 17.0pp
- All cycles
- 2024: D+17.0 2020: D+29.8 2016: D+35.0 2012: D+34.9 2008: D+34.7
Not yet ingested
- Civics
- —
Market trends
- HPI YoY
- ▼ -158.63%
- Current HPI
- 362.2989
- Rent YoY
- ▼ -1.86%
- Metro
- Miami-Fort Lauderdale-Pompano Beach, FL
- State GDP YoY
- ▲ 3.28%
- F500 in state
- 36
Industry mix (Fortune 500 HQ in FL)
| Industry | F500 HQs | Revenue |
|---|---|---|
| Industrial Technology | 2 | $29B |
|
||
| Insurance | 2 | $17B |
|
||
| Retail | 1 | $60B |
|
||
| Technology Distribution | 1 | $58B |
|
||
| Homebuilding | 1 | $35B |
|
||
| Technology Manufacturing | 1 | $35B |
|
||
Price history
+81.4% since first listed6 events — show timeline
- 2026-05-21 Listed $185,000 Beaches MLS
- 2026-04-04 Pending — Beaches MLS
- 2026-04-03 Listing Removed — Beaches MLS
- 2026-03-18 Price Changed $185,000 Beaches MLS
- 2025-12-08 Listed $225,000 Beaches MLS
- 1979-09-01 Sold (Public Records) $102,000 Public Records
Property tax history
+15.4%/yrLatest (2025): $6,481 · +608.5% YoY. Source: county tax records.
Cash-flow waterfall
monthlySold comps — $/sqft
last 12 mo · ≤1 miLoading sold comps…