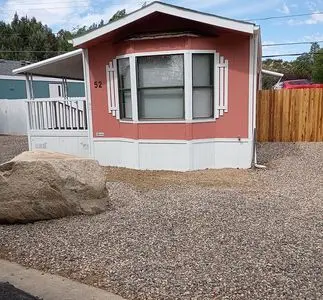
960 Peace Ln · Prescott, AZ
Flood risk 6/10 · Moderate
- FEMA flood zone
- AE
- Chance of flooding over 30 yrs
- 0.73%
- Est. flood insurance / yr
- $1,737 – $8,500
Fire risk 6/10 · Moderate
- Est. fire insurance / yr
- $610 – $1,132
Heat risk 3/10 · Minor
- Hot days now (above 91°F)
- 7 days/yr
- Hot days in 30 yrs
- 18 days/yr
Wind risk 1/10 · Minimal
- Chance of severe wind over 30 yrs
- —
Air-quality risk 1/10 · Minimal
- Unhealthy air days now
- 0 days/yr
- Unhealthy air days in 30 yrs
- 0 days/yr
Risk factors via First Street. Map © Google.
Why this score? — see what drove the C grade
The composite is a weighted blend of 9 inputs, each scored 0–100. Each bar is that input's sub-score; the figure is the points it added to the 100-point composite (weight × sub-score).
- Cash flow +22.6/30.0
- 1% rule +8.0/10.0
- ARV discount +7.5/15.0
- DSCR +7.2/10.0
- Livability +3.7/5.0
- Schools +3.3/10.0
- Rent growth +2.8/5.0
- Condition / age +2.5/5.0
- Appreciation +0.0/10.0
$125,000
🖨 Deal sheet 📄 Offer letter ✓ Due diligence
Listing remarks MLS
New paint, water heater, washer & dryer, in great location in quiet neighborhood. Must see before it's gone.
Key facts
- Parking
- Built 2005
- Listed 43 days
Property features AI
Finance
- HOA & community: Not a senior community; Land lease (yes)
Exterior
- Parking: Carport attached (1 parking space)
- Utilities: Electricity available; City sewer; Natural gas water heater
- Home design: Manufactured single-wide home; One story; EnerGmiser plan type; Handicap access to exterior; Facing direction not specified
- Construction: Steel frame construction; Foam roof
- Exterior features: Covered patio/porch; Shed(s); Storm gutters; Back yard fencing; Privacy fencing; Level lot; City-maintained road frontage
Interior
- Kitchen: Gas range; Microwave; Dishwasher; Disposal; Refrigerator
- Bedrooms: Master bedroom on main level
- Flooring: Laminate
- Bathrooms: 2 total bathrooms (1 full, 1 three-quarter)
- Heating & cooling: Natural gas heating; Central air conditioning
- Interior features: Bar; Ceiling fan(s); Eat-in kitchen; Laminate counters; Vaulted ceiling(s); Walk-in closet(s); Handicap bathroom features; Live on one level; Pantry
- Laundry & utility: Washer; Dryer; Natural gas water heater
Neighborhood map
What this means for you Summary
Snapshot
- This is a 2-bed/2.0-bath land listed at $125k.
Deal economics
- At list price, monthly cash flow is $-214 ($-3k/yr) — negative.
- To cash-flow at today's rent, offer at most $87k (30.3% below list).
- Meets the 1% rule at list price ($2k rent vs $125k).
- Recommended offer: $87k (30.3% below list) — sets the bar for cash-flow.
- Cap rate 8.3% vs local median 2.4% in Prescott — top-decile yield for the area; either an underpriced asset or a hidden risk that comps aren't pricing in. Stress-test before assuming the spread holds.
Location & tenants
- Location reads 73/100 on livability (#22 in AZ) — a middle-class / working-renter tenant base. Strengths: health & safety A+, amenities A, schools A-; Watch: cost of living D, commute F.
- Prescott Unified District (4466) (urban): math 34% / reading 44% proficiency, ranked #70 of 249 in AZ (top 28%) — families likely to look elsewhere, expect single-tenant / working-renter base with shorter leases.
- Market conditions: Rents rising (+1.0%/yr); 707 active listings in the ZIP; 23 comparable units currently listed for rent nearby; rentals lingering (median 44d on market — plan ~5-8 weeks vacancy on turnover, expect pricing pressure); 57% of comp listings sitting > 30 days — soft ceiling on asking rent; solid renter incomes; 2,062 units permitted in Yavapai County in 2024 (98 in 5+ unit buildings).
Forward outlook
- Local home prices are declining (-3.0%/yr); year-one equity from $864 of loan paydown is wiped out by about $4k of value loss. Plan a longer hold.
- Yavapai County population projected at +10% by 2050 — modest demand growth; plan on rents tracking national, not racing it.
Negotiation context
- It's been on market 43 days — a 3% lower offer ($121k) is reasonable based on typical stale-listing flexibility.
- 2 sale attempts; this cycle's ask is 47% above the opening price — seller raised mid-cycle; expect resistance to lowballs.
- Current owner paid $46k; list at $125k implies a 169% gain — meaningful room to come down on a strong offer.
Risks & watch-outs
- Watch-outs: property tax is 3.5% of price; flood insurance adds $427/mo.
- Climate carrying-cost: in FEMA flood zone AE (mandatory federal flood insurance); major wildfire risk — expect insurance premiums to compound above CPI over the hold.
Questions for the listing agent
- What do current leases actually rent for vs. the listed asking? Can we see a recent rent roll and the last 12 months of T-12 income?
- It's been on market 43 days. Have you received any prior offers? Is the seller open to a 30% concession, seller financing, or rate buy-down credit?
- Property tax is high relative to price — has the assessment been appealed recently, and will the sale trigger a re-assessment?
- What's the actual annual flood-insurance premium (NFIP or private), and is the property in a SFHA with mandatory coverage?
- Is there a deadline driving the sale (1031 exchange, divorce, estate, relocation)? That informs how much negotiation room exists.
- Schools are A-rated — typically a magnet for longer-tenancy family renters. What's the average tenant stay here, and is there a school-zone premium baked into asking?
- What's the average days-on-market for RENTAL listings here right now (not sales)? A rising rental-DOM trend means longer vacancies and softer asking-rent achievability than the comps imply.
- What's the recent tenant-quality profile in this submarket — average credit score on applications, eviction rate, late-payment / NSF rate, and stable-employment percentage? A property-management company in the area should have these aggregated.
- How much new for-sale + rental construction is in the pipeline within 1–3 miles? Heavy new supply typically softens prices + rents 12–24 months out; constrained supply supports both.
Investment metrics
- 1% rule
- 1.30% ✓
- Cap rate
- 8.33%
- Cash-on-cash
- 7.28%
- DSCR
- 1.32
- GRM
- 6.4
CMA / ARV
- ARV (median comp)
- $331,755
- List price
- $125,000
- Delta
- -62.32%
- Verdict
- UNDERPRICED
- Comps
- 20 within 1.0 mi
Projected returns pro-forma
-3.0% appreciation · 1.01% rent growth · sell at horizon
- IRR
- -33.0%
- Equity multiple
- -0.05×
- Total profit
- $-36,663
- Equity at exit
- $18,638
- IRR
- -67.4%
- Equity multiple
- -0.72×
- Total profit
- $-60,356
- Equity at exit
- $10,808
Cash invested: $35,000 (down + closing). Projections, not guarantees.
Landlord ↔ Tenant lean methodology
- Overall (STATE)
- 87 Strongly Landlord-Friendly
- State Arizona
- 87 Strongly Landlord-Friendly · R+3
- County
- — inherits STATE
- City
- — inherits STATE
ZIP-level market 86305
- Home prices YoY
- -18.7%
- Rents YoY
- 1.0%
- Active inventory
- 707
- Price-to-rent
- 6.4×
Monthly cashflow live
- Estimated rent
- $1,620 high interval (Pro) →
- Mortgage (P&I)
- −$656
- Tax from tax record
- −$360 /mo · $4,319/yr
- Insurance
- −$52
- Flood insurance flood zone
- −$427 /mo · $5,118/yr
- HOA
- −$0
- Vacancy / Maint / Mgmt
- −$340
- Net cashflow
- $-214
Break-even live
UW: 25.0% down · 7.5% · 30yr · 1.5% tax · 5.0% vac · 8.0% maint · 8.0% mgmt
Financing live
Cash to close
- Down payment
- $31,250
- Closing costs
- $3,750
- Reserves months
- —
- Total cash needed
- —
Loan-product check · same deal, 3 products live
Conventional
25% down · 7.5% · 30yr
- Down + closing
- —
- Monthly P&I
- —
- Monthly cashflow
- —
- DSCR
- —
- Eligible?
- —
Personal DTI + credit; lowest rate.
DSCR
20% down · 8.5% · 30yr
- Down + closing
- —
- Monthly P&I
- —
- Monthly cashflow
- —
- DSCR
- —
- Eligible?
- —
No personal income docs; deal must DSCR.
Hard money
10% down · 12.0% · 12mo
- Down + closing
- —
- Monthly P&I
- —
- Monthly cashflow
- —
- DSCR
- —
- Eligible?
- —
Short-term bridge; refi at stabilization.
Rent comps 23 comps
| Address | Beds | Baths | Sqft | Rent | $/sqft | DOM | Units | Dist |
|---|---|---|---|---|---|---|---|---|
| 780 Gail Gardner Way Unit 5 Prescott, AZ | 2.0 | 1.0 | 887 | $1,550 | $1.75 | 43d | 1 | 0.35mi |
| 720 N Walnut St Unit 15 Prescott, AZ | 2.0 | 2.0 | 1082 | $2,150 | $1.99 | 43d | 1 | 0.57mi |
| 635 Dameron Dr Apt 1 Prescott, AZ | 2.0 | 1.0 | 850 | $1,150 | $1.35 | 13d | 1 | 0.83mi |
| 301 W Merritt St Unit 303-A Prescott, AZ | 2.0 | 1.0 | 650 | $1,250 | $1.92 | 20d | 1 | 0.90mi |
| 1717 Cottonwood Ave Prescott, AZ | 1.0 | 1.0 | 600 | $1,300 | $2.17 | 13d | 1 | 0.90mi |
| 1668 W Iron Springs Rd Prescott, AZ | 1.0–2.0 | 1.0–2.0 | 719 | $1,700 | $2.36 | 13d | 4 | 0.93mi |
| 628 1st St Apt 2C Prescott, AZ | 1.0 | 1.0 | 840 | $1,100 | $1.31 | 43d | 1 | 0.96mi |
| 603 Campbell St Apt 01 Prescott, AZ | 2.0 | 1.0 | 720 | $1,000 | $1.39 | 43d | 1 | 0.97mi |
| 601 Campbell St Apt 3 Prescott, AZ | 2.0 | 1.0 | 720 | $1,000 | $1.39 | 43d | 1 | 0.98mi |
| 538 Lincoln Ave Unit 2A'VACATION Prescott, AZ | 2.0 | 1.0 | 850 | $1,850 | $2.18 | 43d | 1 | 0.98mi |
| 538 Lincoln Ave Unit 1A'VACATION Prescott, AZ | 3.0 | 2.0 | 1000 | $2,000 | $2.00 | 43d | 1 | 0.98mi |
| 538 Lincoln Ave Unit 2C'VACATION Prescott, AZ | 2.0 | 1.0 | 850 | $1,750 | $2.06 | 43d | 1 | 0.98mi |
| 570 1st St Apt C Prescott, AZ | 2.0 | 1.0 | 705 | $1,050 | $1.49 | 43d | 1 | 1.02mi |
| 410 Madison Ave Unit 3 Prescott, AZ | 2.0 | 1.0 | 680 | $1,200 | $1.76 | 43d | 1 | 1.07mi |
| 408 Madison Ave #4 Prescott, AZ | 2.0 | 1.0 | 680 | $1,200 | $1.76 | 20d | 1 | 1.08mi |
| 131 Whipple Ext Prescott, AZ | 2.0 | 1.0 | 865 | $1,500 | $1.73 | 13d | 1 | 1.11mi |
| 131 Whipple Extention Unit B Prescott, AZ | 2.0 | 1.0 | 865 | $1,400 | $1.62 | 43d | 1 | 1.11mi |
| 141 Whipple Ext Prescott, AZ | 2.0 | 1.0 | 865 | $1,400 | $1.62 | 43d | 1 | 1.12mi |
| 248 Vallejo St Apt B Prescott, AZ | 3.0 | 1.0 | 1000 | $1,795 | $1.79 | 13d | 1 | 1.14mi |
| 824 W Gurley St Prescott, AZ | 1.0–2.0 | 1.0 | 711 | $1,375 | $1.93 | 20d | 2 | 1.15mi |
| 1020 Heap Ave Prescott, AZ | 2.0 | 1.0 | 1035 | $2,000 | $1.93 | 20d | 1 | 1.29mi |
| 355 Country Club Cir Prescott, AZ | 2.0–3.0 | 1.5 | 972 | $1,400 | $1.44 | 13d | 5 | 1.43mi |
| 350 Rim Rock Cir #2 Prescott, AZ | 2.0 | 2.0 | 1014 | $1,750 | $1.73 | 43d | 1 | 1.49mi |
Listing history 20 events
-
2026-06-18days on market $125,000 Active 43 DOM
-
2026-06-17days on market $125,000 Active 42 DOM
-
2026-06-16days on market $125,000 Active 41 DOM
Show marketing remark (114 chars)
New paint, water heater, washer & dryer, in great location in quiet neighborhood. Must see before it's gone.
-
2026-06-15days on market $125,000 Active 40 DOM
-
2026-06-14days on market $125,000 Active 38 DOM
-
2026-06-13days on market $125,000 Active 37 DOM
-
2026-06-10days on market $125,000 Active 35 DOM
-
2026-06-09days on market $125,000 Active 34 DOM
-
2026-06-08days on market $125,000 Active 33 DOM
-
2026-06-07days on market $125,000 Active 32 DOM
-
2026-06-05days on market $125,000 Active 29 DOM
-
2026-06-02days on market $125,000 Active 27 DOM
-
2026-06-01days on market $125,000 Active 26 DOM
-
2026-05-31days on market $125,000 Active 25 DOM
-
2026-05-30days on market $125,000 Active 24 DOM
-
2026-05-15$85,000 Active 114-char remark
Show marketing remark (114 chars)
New paint, water heater, washer & dryer, in great location in quiet neighborhood. Must see before it's gone.
-
2026-04-27$125,000 Active 802-char remark
-
1998-08-25soldstatus $46,500
-
1997-05-01soldstatus $105,000
-
1977-11-03soldstatus $155,094
ⓘ Source: listings_history table (triggers on properties + properties_extension) + one-shot
backfill from property_details.listing_events for pre-trigger history.
Tax reassessment forecast AZ · Resets to sale price
- Current annual tax
- $4,319 · $360/mo
- Projected year-2 tax
- $4,319 · $360/mo
- Expected delta
- $0/yr ($0/mo · 0.0%)
ⓘ Screening estimate from a state-policy table — verify with the county assessor before closing.
Climate risk First Street
- Flood 6/10 Major FEMA zone AE · 73% chance over 30 yrs
- Wildfire 6/10 Major
- Heat 3/10 Moderate 7 d/yr ≥91°F today · 18 d/yr by 30 yrs out
- Wind 1/10 Low
- Air quality 1/10 Low 0 unhealthy d/yr today · 0 by 30 yrs out
Nearby sold comps map
Loading sold comps map…
Walkable amenities ~0.75 mi
Loading nearby amenities…
Taxation est. · year 1
- Rental income
- $19,442
- − Mortgage interest
- −$7,002
- − Property taxes
- −$4,319
- − Insurance
- −$5,744
- − Repairs & maintenance
- −$1,555
- − Management
- −$1,555
- − Depreciation
- −$3,636
- Taxable loss
- −$4,370
- Est. tax savings @ 24.0%
- +$1,049
- After-tax cash flow
- $-1,521/yr
For passive investors: Depreciation is non-cash, so a rental often shows a tax loss while cash-flowing — sheltering income. Rental losses are passive: they offset passive income freely, and up to $25,000/yr can offset ordinary (W-2) income if you actively participate and your MAGI is under $100k (phasing out to $0 by $150k); unused losses carry forward. On sale, claimed depreciation is recaptured at up to 25%, and gains may owe capital-gains tax (a 1031 exchange can defer both). Figures are a year-1 estimate at your 24.0% rate — not tax advice; consult a CPA.
Schools (NCES district)
- District
- Prescott Unified District (4466)
- NCES district ID
- 0406730
- Math proficiency
- 34% ▼ -16.00%
- Reading proficiency
- 44% ▼ -13.00%
- Median HH income
- $48,354
- Composite
- 33.47/100
- National rank
- #5450
- State rank
- #70 of 249 in AZ
Livability — Prescott
- Score
- 73/100
- State rank
- #22
- US rank
- #5579
Category grades
Schools grade is shown separately in the Schools card above.
Census & demographics
- Census place
- Prescott, AZ
- County
- Yavapai County · 190,406 people
- City population
- 66,312
- Metro
- Prescott Valley-Prescott, AZ
- Population (ZIP)
- 19,790
- Household income
- $80,436
- Rent vs Own
- Severe rent burden
- 380.0
Population outlook (Yavapai County) Hauer SSP2
- Today (2025)
- 241,389 people
- By 2030
- 249,523 · +3.4%
- By 2040
- 259,966 · +7.7%
- By 2050
- 264,736 · +9.7%
- By 2075
- 269,334 · +11.6%
- By 2100
- 256,505 · +6.3%
Race, ethnicity, and origin ACS 2023
- Neighborhood character
- Predominantly White (86%)
- Race & ethnicity
- White 86% Hispanic / Latino 8% Two or more races 6% Asian 1%
- Hispanic origin (detail)
- Mexican 5% Puerto Rican 2%
- Common ancestry
- Slovak 4% Italian 3% Lithuanian 3%
- Foreign-born
- 4% · Canada
- Languages at home
- 95% English-only · Spanish 3%
Political lean MEDSL · Yavapai
- 2024 margin
- Solid R (+33.9) · D 32.6% · R 66.5%
- 2008→2024 swing
- -9.5pp toward R · 2008: -24.4pp · 2024: -33.9pp
- All cycles
- 2024: R+33.9 2020: R+29.3 2016: R+31.4 2012: R+30.7 2008: R+24.4
Not yet ingested
- Civics
- —
Market trends
- HPI YoY
- ▼ -80.31%
- Current HPI
- 348.5199
- Rent YoY
- ▲ 1.01%
- Metro
- Prescott Valley-Prescott, AZ
- State GDP YoY
- ▲ 4.54%
- F500 in state
- 20
Industry mix (Fortune 500 HQ in AZ)
| Industry | F500 HQs | Revenue |
|---|---|---|
| Technology | 2 | $13B |
|
||
| Mining / Metals | 1 | $23B |
|
||
| Environmental Services | 1 | $16B |
|
||
| Metals / Steel | 1 | $14B |
|
||
| Technology Distribution | 1 | $9B |
|
||
| Homebuilding | 1 | $8B |
|
||
Price history
-48.4% since first listed6 events — show timeline
- 2026-06-16 Price Changed $80,000 FSBO.com
- 2026-05-15 Listed $85,000 FSBO.com
- 2026-04-27 Listed $125,000 PAARMLS as Distributed by MLS Grid
- 1998-08-25 Sold (Public Records) $46,500 Public Records
- 1997-05-01 Sold (Public Records) $105,000 Public Records
- 1977-11-03 Sold (Public Records) $155,094 Public Records
Property tax history
-7.0%/yrLatest (2025): $4,319 · +3.1% YoY. Source: county tax records.
Cash-flow waterfall
monthlySold comps — $/sqft
last 12 mo · ≤1 miLoading sold comps…