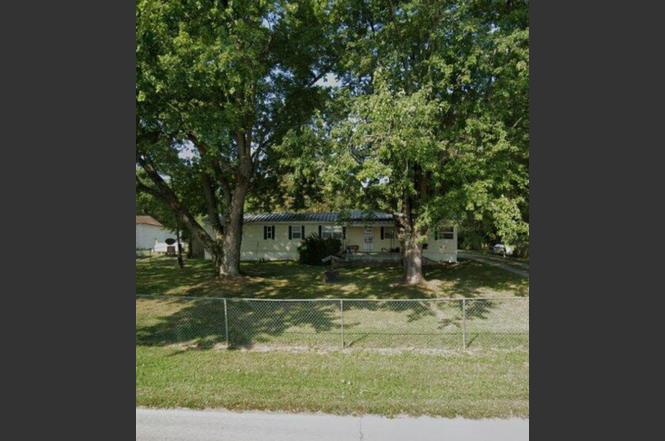
13601 NE Reid Rd NW · Jeffersonville, OH
Flood risk 1/10 · Minimal
- FEMA flood zone
- X
- Chance of flooding over 30 yrs
- 0.0%
- Est. flood insurance / yr
- $507 – $1,088
Fire risk 1/10 · Minimal
- Est. fire insurance / yr
- $713 – $1,323
Heat risk 3/10 · Minor
- Hot days now (above 100°F)
- 7 days/yr
- Hot days in 30 yrs
- 19 days/yr
Wind risk 2/10 · Minimal
- Chance of severe wind over 30 yrs
- 1.0%
Air-quality risk 2/10 · Minimal
- Unhealthy air days now
- 1 days/yr
- Unhealthy air days in 30 yrs
- 2 days/yr
Risk factors via First Street. Map © Google.
Why this score? — see what drove the C grade
The composite is a weighted blend of 9 inputs, each scored 0–100. Each bar is that input's sub-score; the figure is the points it added to the 100-point composite (weight × sub-score).
- Cash flow +24.6/30.0
- DSCR +8.0/10.0
- ARV discount +7.5/15.0
- 1% rule +6.0/10.0
- Schools +5.4/10.0
- Livability +3.2/5.0
- Rent growth +2.5/5.0
- Condition / age +2.5/5.0
- Appreciation +0.0/10.0
$99,900
🖨 Deal sheet (PDF) 📄 Offer letter ✓ Due diligence
Listing remarks
Peaceful country living with beautiful views bordering Paint Creek! This 3-bedroom, 1.5-bath modular-style home offers the perfect blend of privacy, space, and potential. Enjoy plenty of room for gardening, hobby farming, and even chickens! The detached 2-car garage includes an attached bonus room--ideal for a mechanic, woodworker, workshop, studio, or extra storage space. Whether you're looking for a quiet place to call home, a mini homestead, or an investment opportunity with great rental potential, this property has so much to offer!
Key facts
- Rental potential
- Room for chickens
- Attached bonus room
Tags
Property features AI
Exterior
- Parking: Detached garage with garage door opener; One garage space
- Utilities: Private sewer; Well water
- Home design: Single-family residence; One story; Built in 1970; No common walls
- Construction: Block foundation
- Exterior features: Patio; Shed(s) and outbuilding
Interior
- Bedrooms: Three main-level bedrooms
- Flooring: Laminate flooring; Carpet; Vinyl flooring
- Bathrooms: One full bathroom; One half bathroom
- Heating & cooling: Propane heating; Window and wall cooling units
- Interior features: Crawl space basement; Approximately 1,004 living area
Neighborhood map
What this means for you Summary
Snapshot
- This is a 3-bed/1.5-bath single-family listed at $100k.
Deal economics
- At list price, monthly cash flow is $208 ($2k/yr) — positive.
- The deal already cash-flows at list — no discount required.
- Meets the 1% rule at list price ($1k rent vs $100k).
- Recommended offer: $88k (12.0% below list) — sets the bar for market timing.
- Cap rate 8.8% vs local median 1.1% in Jeffersonville — top-decile yield for the area; either an underpriced asset or a hidden risk that comps aren't pricing in. Stress-test before assuming the spread holds.
Location & tenants
- Location reads 64/100 on livability (#768 in OH) — a middle-class / working-renter tenant base. Strengths: crime A+, cost of living A+, housing A+; Watch: schools F, amenities F, commute F.
- Miami Trace Local (rural): math 61% / reading 67% proficiency, ranked #235 of 656 in OH (top 36%) — acceptable for families but not a draw, mixed tenant base, ~2y average lease.
- Market conditions: 30 active listings in the ZIP; 71 units permitted in Fayette County in 2024 (0 in 5+ unit buildings).
Forward outlook
- Local home prices are declining (-3.0%/yr); year-one equity from $691 of loan paydown is wiped out by about $3k of value loss. Plan a longer hold.
- Fayette County population projected at -18% by 2050 — secular population decline; favor cash flow + early exit over multi-decade hold.
Negotiation context
- It's been on market 150 days — a 12% lower offer ($88k) is reasonable based on typical stale-listing flexibility.
- 3 sale attempts since 20y ago; this cycle's ask has dropped $10k (9%) from the opening price — seller is motivated, your offer sets the floor, not the list.
- Current owner paid $42k; list at $100k implies a 138% gain — meaningful room to come down on a strong offer.
Questions for the listing agent
- It's been on market 150 days. Have you received any prior offers? Is the seller open to a 12% concession, seller financing, or rate buy-down credit?
- Built in 1973 — when were the roof, HVAC, electrical panel, plumbing, and water heater last replaced?
- Why hasn't it sold? Are there any deal-killer items the seller is aware of (foundation, flood, title, zoning, code violations)?
- Is there a deadline driving the sale (1031 exchange, divorce, estate, relocation)? That informs how much negotiation room exists.
- Schools are F-rated, which usually means shorter tenancies and higher turnover. Who's the typical renter profile here, and what's been the actual vacancy rate?
- What's the average days-on-market for RENTAL listings here right now (not sales)? A rising rental-DOM trend means longer vacancies and softer asking-rent achievability than the comps imply.
- What's the recent tenant-quality profile in this submarket — average credit score on applications, eviction rate, late-payment / NSF rate, and stable-employment percentage? A property-management company in the area should have these aggregated.
- How much new for-sale + rental construction is in the pipeline within 1–3 miles? Heavy new supply typically softens prices + rents 12–24 months out; constrained supply supports both.
Investment metrics
- 1% rule
- 1.10% ✓
- Cap rate
- 8.79%
- Cash-on-cash
- 8.90%
- DSCR
- 1.40
- GRM
- 7.6
CMA / ARV
No comps found within radius.
Projected returns pro-forma
-3.0% appreciation · 3.0% rent growth · sell at horizon
- IRR
- -2.8%
- Equity multiple
- 0.89×
- Total profit
- $-2,973
- Equity at exit
- $14,895
- IRR
- 6.9%
- Equity multiple
- 1.52×
- Total profit
- $14,421
- Equity at exit
- $8,638
Cash invested: $27,972 (down + closing). Projections, not guarantees.
Landlord ↔ Tenant lean methodology
- Overall (STATE)
- 73 Landlord-Friendly
- State Ohio
- 73 Landlord-Friendly · R+6
- County
- — inherits STATE
- City
- — inherits STATE
ZIP-level market 43128
- Home prices YoY
- -5.7%
- Active inventory
- 30
- Price-to-rent
- 7.6×
Monthly cashflow live
- Estimated rent
- $1,098 medium interval (Pro) →
- Mortgage (P&I)
- −$524
- Tax from tax record
- −$95 /mo · $1,135/yr
- Insurance
- −$42
- HOA
- −$0
- Vacancy / Maint / Mgmt
- −$231
- Net cashflow
- $208
Break-even live
Sensitivity live
| Price | -10% $264 | -5% $236 | +0% $208 | +5% $179 | +10% $151 |
|---|---|---|---|---|---|
| Rent | -10% $121 | -5% $164 | +0% $208 | +5% $251 | +10% $294 |
| Rate | -1.0pp $258 | -0.5pp $233 | base $208 | +0.5pp $182 | +1.0pp $155 |
UW: 25.0% down · 7.5% · 30yr · 1.5% tax · 5.0% vac · 8.0% maint · 8.0% mgmt
Financing live
Cash to close
- Down payment
- $24,975
- Closing costs
- $2,997
- Reserves months
- —
- Total cash needed
- —
Loan-product check · same deal, 3 products live
Conventional
25% down · 7.5% · 30yr
- Down + closing
- —
- Monthly P&I
- —
- Monthly cashflow
- —
- DSCR
- —
- Eligible?
- —
Personal DTI + credit; lowest rate.
DSCR
20% down · 8.5% · 30yr
- Down + closing
- —
- Monthly P&I
- —
- Monthly cashflow
- —
- DSCR
- —
- Eligible?
- —
No personal income docs; deal must DSCR.
Hard money
10% down · 12.0% · 12mo
- Down + closing
- —
- Monthly P&I
- —
- Monthly cashflow
- —
- DSCR
- —
- Eligible?
- —
Short-term bridge; refi at stabilization.
Listing history 24 events
-
2026-06-21days on market $99,900 Active 150 DOM
-
2026-06-18days on market $99,900 Active 148 DOM
-
2026-06-17days on market $99,900 Active 147 DOM
-
2026-06-16days on market $99,900 Active 146 DOM
-
2026-06-15days on market $99,900 Active 145 DOM
-
2026-06-13days on market $99,900 Active 143 DOM
-
2026-06-12statusdays on market $99,900 Active 142 DOM
-
2026-06-09days on market $99,900 Contingent 139 DOM
-
2026-06-08days on market $99,900 Contingent 138 DOM
-
2026-06-08days on market $99,900 Contingent 137 DOM
-
2026-06-07days on market $99,900 Contingent 136 DOM
-
2026-06-04days on market $99,900 Contingent 133 DOM
-
2026-06-02days on market $99,900 Contingent 132 DOM
-
2026-06-01days on market $99,900 Contingent 131 DOM
-
2026-05-31days on market $99,900 Contingent 130 DOM
-
2026-05-31status $99,900 Contingent 129 DOM
-
2026-05-16status Active
-
2026-04-10historical Contingent
-
2026-04-07price $99,900
-
2026-01-21$110,000 Active
-
2006-11-04historical
-
2006-08-09$62,500
-
1995-12-07soldstatus $42,000
-
1991-04-08soldstatus $30,000
ⓘ Source: listings_history table (triggers on properties + properties_extension) + one-shot
backfill from property_details.listing_events for pre-trigger history.
Tax reassessment forecast OH · Partial reset (capped growth)
- Current annual tax
- $1,135 · $95/mo
- Projected year-2 tax
- $1,347 · $112/mo
- Expected delta
- +$212/yr (+$18/mo · 18.7%)
ⓘ Screening estimate from a state-policy table — verify with the county assessor before closing.
Climate risk First Street
- Flood 1/10 Low FEMA zone X · 0% chance over 30 yrs
- Wildfire 1/10 Low
- Heat 3/10 Moderate 7 d/yr ≥100°F today · 19 d/yr by 30 yrs out
- Wind 2/10 Low 100% chance of damaging wind over 30 yrs
- Air quality 2/10 Low 1 unhealthy d/yr today · 2 by 30 yrs out
Nearby sold comps map
Loading sold comps map…
Walkable amenities ~0.75 mi
Loading nearby amenities…
Taxation est. · year 1
- Rental income
- $13,178
- − Mortgage interest
- −$5,596
- − Property taxes
- −$1,135
- − Insurance
- −$500
- − Repairs & maintenance
- −$1,054
- − Management
- −$1,054
- − Depreciation
- −$2,906
- Taxable income
- $934
- Est. tax owed @ 24.0%
- −$224
- After-tax cash flow
- $2,266/yr
For passive investors: Depreciation is non-cash, so a rental often shows a tax loss while cash-flowing — sheltering income. Rental losses are passive: they offset passive income freely, and up to $25,000/yr can offset ordinary (W-2) income if you actively participate and your MAGI is under $100k (phasing out to $0 by $150k); unused losses carry forward. On sale, claimed depreciation is recaptured at up to 25%, and gains may owe capital-gains tax (a 1031 exchange can defer both). Figures are a year-1 estimate at your 24.0% rate — not tax advice; consult a CPA.
Schools (NCES district)
- District
- Miami Trace Local
- NCES district ID
- 3910010
- Math proficiency
- 61% ▼ -15.00%
- Reading proficiency
- 67% ▼ -5.00%
- Median HH income
- $45,826
- Composite
- 53.98/100
- National rank
- #1398
- State rank
- #235 of 656 in OH
Livability — Jeffersonville
- Score
- 64/100
- State rank
- #768
- US rank
- #13928
Category grades
Schools grade is shown separately in the Schools card above.
Census & demographics
- County
- Fayette · 25,566 people
- Population (ZIP)
- 2,038
- Household income
- $45,515
- Rent vs Own
- Severe rent burden
- 11.5
Population outlook (Fayette County) Hauer SSP2
- Today (2025)
- 27,616 people
- By 2030
- 26,760 · -3.1%
- By 2040
- 24,789 · -10.2%
- By 2050
- 22,550 · -18.3%
- By 2075
- 16,893 · -38.8%
- By 2100
- 11,246 · -59.3%
Race, ethnicity, and origin ACS 2023
- Neighborhood character
- Predominantly White (94%)
- Race & ethnicity
- White 94% Two or more races 4% Hispanic / Latino 2%
- Common ancestry
- Italian 1% Lithuanian 1%
- Foreign-born
- 1% · Canada
- Languages at home
- 99% English-only · Spanish 1%
Political lean MEDSL · Fayette
- 2024 margin
- Solid R (+55.1) · D 22.1% · R 77.2%
- 2008→2024 swing
- -32.0pp toward R · 2008: -23.1pp · 2024: -55.1pp
- All cycles
- 2024: R+55.1 2020: R+51.5 2016: R+47.1 2012: R+22.3 2008: R+23.1
Not yet ingested
- Civics
- —
Market trends
- HPI YoY
- ▼ -15.67%
- Current HPI
- 257.8161
- Rent YoY
- —
- Metro
- —
- State GDP YoY
- ▲ 1.98%
- F500 in state
- 48
Industry mix (Fortune 500 HQ in OH)
| Industry | F500 HQs | Revenue |
|---|---|---|
| Insurance | 3 | $145B |
|
||
| Industrial Machinery | 3 | $49B |
|
||
| Financial Services | 3 | $24B |
|
||
| Consumer Goods | 2 | $93B |
|
||
| Aerospace / Defense | 2 | $47B |
|
||
| Utilities | 2 | $33B |
|
||
Price history
+233.0% since first listed8 events — show timeline
- 2026-05-16 Relisted — CBRMLS
- 2026-04-10 Contingent — CBRMLS
- 2026-04-07 Price Changed $99,900 CBRMLS
- 2026-01-21 Listed $110,000 CBRMLS
- 2006-11-04 Listing Removed — CBRMLS
- 2006-08-09 Listed $62,500 CBRMLS
- 1995-12-07 Sold (Public Records) $42,000 Public Records
- 1991-04-08 Sold (Public Records) $30,000 Public Records
Property tax history
+11.9%/yrLatest (2025): $1,135 · -0.0% YoY. Source: county tax records.
Cash-flow waterfall
monthlySold comps — $/sqft
last 12 mo · ≤1 miLoading sold comps…