122 & 124 E Mill St · Bellevue, MI
Flood risk 1/10 · Minimal
- FEMA flood zone
- X (unshaded)
- Chance of flooding over 30 yrs
- 0.0%
- Est. flood insurance / yr
- $473 – $860
Fire risk 1/10 · Minimal
- Est. fire insurance / yr
- $784 – $1,456
Heat risk 2/10 · Minimal
- Hot days now (above 98°F)
- 7 days/yr
- Hot days in 30 yrs
- 16 days/yr
Wind risk 2/10 · Minimal
- Chance of severe wind over 30 yrs
- —
Air-quality risk 2/10 · Minimal
- Unhealthy air days now
- 0 days/yr
- Unhealthy air days in 30 yrs
- 1 days/yr
Risk factors via First Street. Map © Google.
Why this score? — see what drove the D- grade
The composite is a weighted blend of 9 inputs, each scored 0–100. Each bar is that input's sub-score; the figure is the points it added to the 100-point composite (weight × sub-score).
- ARV discount +12.0/15.0
- Cash flow +10.3/30.0
- Livability +3.5/5.0
- DSCR +2.9/10.0
- 1% rule +2.7/10.0
- Rent growth +2.5/5.0
- Condition / age +2.5/5.0
- Schools +2.0/10.0
- Appreciation +0.0/10.0
$149,900
🖨 Deal sheet 📄 Offer letter ✓ Due diligence
Listing remarks MLS
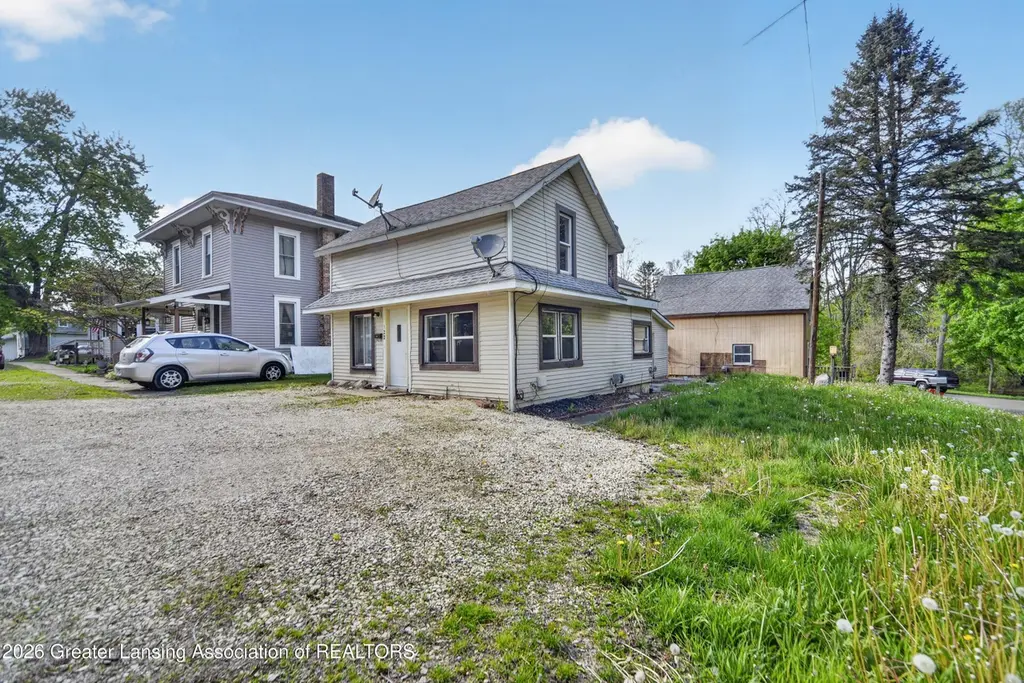
BUY ONE, GET ONE FREE! Two fully functional houses on one lot in downtown Bellevue. This is a rare opportunity to own two separate homes on the same property perfect for house hacking, rental income, multi-generational living, or expanding your investment portfolio. Live in one and rent the other, rent both, or create a flexible living setup right in the heart of town. Located in downtown Bellevue with convenient access to local shops, restaurants, and amenities.
Key facts
- Separate homes
- Convenient access
- Downtown bellevue
Tags
Property features AI
Exterior
- Parking: Driveway (no garage)
- Utilities: Public sewer
- Home design: Two levels; Built in 1890
- Construction: Vinyl siding; Hardboard exterior
- Exterior features: City lot; Paved road access; Guest house on the property; Shingle roof
Interior
- Kitchen: Kitchen(s) present; Refrigerator included
- Bedrooms: 5 bedrooms (includes primary bedrooms and additional bedrooms across the property)
- Flooring: Carpet; Vinyl
- Bathrooms: 3 full bathrooms
- Heating & cooling: Forced air heating; No cooling
- Interior features: 14 total rooms; Basement: Michigan; Laundry room; Dryer, Washer, Refrigerator
- Laundry & utility: Laundry room; Washer and Dryer included
Neighborhood map
What this means for you Summary
Snapshot
- This is a 3-bed/1.0-bath single-family listed at $150k.
Deal economics
- At list price, monthly cash flow is $-83 ($-1k/yr) — negative.
- To cash-flow at today's rent, offer at most $135k (9.8% below list).
- To meet the 1% rule (rent ≥ 1% of price), the offer needs to be $116k (22.9% below list).
- Recommended offer: $116k (22.9% below list) — sets the bar for 1% rule.
- Cap rate 5.6% vs local median 3.3% in Bellevue — top-decile yield for the area; either an underpriced asset or a hidden risk that comps aren't pricing in. Stress-test before assuming the spread holds.
Location & tenants
- Location reads 69/100 on livability (#355 in MI) — a middle-class / working-renter tenant base. Strengths: cost of living A+, housing A+, crime A; Watch: amenities F, commute F, health & safety D-.
- Bellevue Community Schools (rural): math 14% / reading 30% proficiency, ranked #445 of 540 in MI (top 82%) — low school quality limits family demand, transient renter base, plan for 1-2y turnover.
- Zoned schools: Bellevue Elementary School (math 17% / reading 27%, grade F, #1,035 of 1,397 statewide, top 77%, 317 students, 67% FRL) — zoned schools average 67% FRL vs 50% district-wide (16 pts higher); higher-poverty schools than district average — tighter screening recommended.
- Market conditions: 56 active listings in the ZIP; 98 units permitted in Eaton County in 2024 (0 in 5+ unit buildings).
Forward outlook
- Local home prices are declining (-3.0%/yr); year-one equity from $1k of loan paydown is wiped out by about $4k of value loss. Plan a longer hold.
- Eaton County population projected to shrink 5% by 2050 — rents likely to lag national; underwrite the cash flow, not the appreciation.
Negotiation context
- It's been on market 36 days — a 3% lower offer ($145k) is reasonable based on typical stale-listing flexibility.
- 3 sale attempts since 21y ago with the ask held roughly flat each time — persistent listings suggest the price (not the market) is what's stuck; bring a comps-based counter.
Risks & watch-outs
- Watch-outs: built in 1890 — expect roof / HVAC / electrical / plumbing capex.
Questions for the listing agent
- What do current leases actually rent for vs. the listed asking? Can we see a recent rent roll and the last 12 months of T-12 income?
- It's been on market 36 days. Have you received any prior offers? Is the seller open to a 23% concession, seller financing, or rate buy-down credit?
- Built in 1890 — when were the roof, HVAC, electrical panel, plumbing, and water heater last replaced?
- Is there a deadline driving the sale (1031 exchange, divorce, estate, relocation)? That informs how much negotiation room exists.
- Schools are D-rated, which usually means shorter tenancies and higher turnover. Who's the typical renter profile here, and what's been the actual vacancy rate?
- The area grade is low — what's the realistic commute time and amenity access for the typical tenant pool here? Any planned neighborhood developments (good or bad) we should know about?
- What's the average days-on-market for RENTAL listings here right now (not sales)? A rising rental-DOM trend means longer vacancies and softer asking-rent achievability than the comps imply.
- What's the recent tenant-quality profile in this submarket — average credit score on applications, eviction rate, late-payment / NSF rate, and stable-employment percentage? A property-management company in the area should have these aggregated.
- How much new for-sale + rental construction is in the pipeline within 1–3 miles? Heavy new supply typically softens prices + rents 12–24 months out; constrained supply supports both.
Investment metrics
- 1% rule
- 0.77% ✗
- Cap rate
- 5.62%
- Cash-on-cash
- -2.39%
- DSCR
- 0.89
- GRM
- 10.8
CMA / ARV
- ARV (median comp)
- $166,644
- List price
- $149,900
- Delta
- -10.05%
- Verdict
- UNDERPRICED
- Comps
- 20 within 1.0 mi
Show comp detail 8 sales within ~0.75 mi
| Address | Dist | Beds/Ba | Sqft | Sold | Price | $/sf | Match |
|---|---|---|---|---|---|---|---|
| 324 Madison St | 0.15mi | 3/2.0 | 1,092 (+8%) | 12mo | $202,000 | $185 | 66 |
| 118 E Mill St | 0.02mi | 2/1.0 (-1) | 1,162 (+15%) | 7mo | $147,000 | $127 | 64 |
| 629 Madison St | 0.28mi | 2/1.0 (-1) | 960 (-5%) | 11mo | $170,000 | $177 | 64 |
| 207 N Adams St | 0.07mi | 3/1.0 | 1,127 (+11%) | 21mo | $124,000 | $110 | 61 |
| 124 S Elizabeth St | 0.23mi | 2/2.0 (-1) | 988 (-3%) | 21mo | $142,500 | $144 | 58 |
| 710 Madison St | 0.36mi | 3/1.5 | 1,144 (+13%) | 2mo | $195,000 | $170 | 58 |
| 423 Sherwood Rd | 0.29mi | 3/2.0 | 1,113 (+10%) | 18mo | $223,000 | $200 | 52 |
| 630 N Main St | 0.25mi | 2/1.0 (-1) | 1,140 (+12%) | 16mo | $133,500 | $117 | 49 |
Match score weights: distance 35% · size 25% · config 20% · recency 20%. Top-matched comps best support the ARV.
Projected returns pro-forma
-3.0% appreciation · 3.0% rent growth · sell at horizon
- IRR
- -20.3%
- Equity multiple
- 0.29×
- Total profit
- $-29,612
- Equity at exit
- $22,351
- IRR
- -13.4%
- Equity multiple
- 0.22×
- Total profit
- $-32,658
- Equity at exit
- $12,961
Cash invested: $41,972 (down + closing). Projections, not guarantees.
Landlord ↔ Tenant lean methodology
- Overall (STATE)
- 62 Landlord-Friendly
- State Michigan
- 62 Landlord-Friendly · EVEN
- County
- — inherits STATE
- City
- — inherits STATE
ZIP-level market 49021
- Home prices YoY
- -10.1%
- Active inventory
- 56
- Price-to-rent
- 10.8×
Monthly cashflow live
- Estimated rent
- $1,155 medium interval (Pro) →
- Mortgage (P&I)
- −$786
- Tax from tax record
- −$148 /mo · $1,771/yr
- Insurance
- −$62
- HOA
- −$0
- Vacancy / Maint / Mgmt
- −$243
- Net cashflow
- $-83
Break-even live
UW: 25.0% down · 7.5% · 30yr · 1.5% tax · 5.0% vac · 8.0% maint · 8.0% mgmt
Financing live
Cash to close
- Down payment
- $37,475
- Closing costs
- $4,497
- Reserves months
- —
- Total cash needed
- —
Loan-product check · same deal, 3 products live
Conventional
25% down · 7.5% · 30yr
- Down + closing
- —
- Monthly P&I
- —
- Monthly cashflow
- —
- DSCR
- —
- Eligible?
- —
Personal DTI + credit; lowest rate.
DSCR
20% down · 8.5% · 30yr
- Down + closing
- —
- Monthly P&I
- —
- Monthly cashflow
- —
- DSCR
- —
- Eligible?
- —
No personal income docs; deal must DSCR.
Hard money
10% down · 12.0% · 12mo
- Down + closing
- —
- Monthly P&I
- —
- Monthly cashflow
- —
- DSCR
- —
- Eligible?
- —
Short-term bridge; refi at stabilization.
Listing history 21 events
-
2026-06-19days on market $149,900 Active 36 DOM
-
2026-06-18days on market $149,900 Active 35 DOM
-
2026-06-17days on market $149,900 Active 34 DOM
-
2026-06-16days on market $149,900 Active 33 DOM
-
2026-06-15days on market $149,900 Active 32 DOM
-
2026-06-14days on market $149,900 Active 30 DOM
-
2026-06-13days on market $149,900 Active 29 DOM
-
2026-06-10days on market $149,900 Active 27 DOM
-
2026-06-09days on market $149,900 Active 26 DOM
-
2026-06-08days on market $149,900 Active 25 DOM
-
2026-06-07days on market $149,900 Active 24 DOM
-
2026-06-05days on market $149,900 Active 21 DOM
-
2026-06-03days on market $149,900 Active 20 DOM
-
2026-06-02days on market $149,900 Active 19 DOM
-
2026-06-01days on market $149,900 Active 18 DOM
-
2026-05-31days on market $149,900 Active 17 DOM
-
2026-05-30days on market $149,900 Active 16 DOM
-
2026-05-14$149,900 Active 467-char remark
Show marketing remark (467 chars)
BUY ONE, GET ONE FREE! Two fully functional houses on one lot in downtown Bellevue. This is a rare opportunity to own two separate homes on the same property perfect for house hacking, rental income, multi-generational living, or expanding your investment portfolio. Live in one and rent the other, rent both, or create a flexible living setup right in the heart of town. Located in downtown Bellevue with convenient access to local shops, restaurants, and amenities.
-
2005-09-28historical
-
2005-03-28$92,500
ⓘ Source: listings_history table (triggers on properties + properties_extension) + one-shot
backfill from property_details.listing_events for pre-trigger history.
Tax reassessment forecast MI · Partial reset (capped growth)
- Current annual tax
- $1,771 · $148/mo
- Projected year-2 tax
- $2,040 · $170/mo
- Expected delta
- +$269/yr (+$22/mo · 15.2%)
ⓘ Screening estimate from a state-policy table — verify with the county assessor before closing.
Climate risk First Street
- Flood 1/10 Low FEMA zone X (unshaded) · 0% chance over 30 yrs
- Wildfire 1/10 Low
- Heat 2/10 Low 7 d/yr ≥98°F today · 16 d/yr by 30 yrs out
- Wind 2/10 Low
- Air quality 2/10 Low 0 unhealthy d/yr today · 1 by 30 yrs out
Nearby sold comps map
Loading sold comps map…
Walkable amenities ~0.75 mi
Loading nearby amenities…
Taxation est. · year 1
- Rental income
- $13,863
- − Mortgage interest
- −$8,397
- − Property taxes
- −$1,771
- − Insurance
- −$750
- − Repairs & maintenance
- −$1,109
- − Management
- −$1,109
- − Depreciation
- −$4,361
- Taxable loss
- −$3,633
- Est. tax savings @ 24.0%
- +$872
- After-tax cash flow
- $-130/yr
For passive investors: Depreciation is non-cash, so a rental often shows a tax loss while cash-flowing — sheltering income. Rental losses are passive: they offset passive income freely, and up to $25,000/yr can offset ordinary (W-2) income if you actively participate and your MAGI is under $100k (phasing out to $0 by $150k); unused losses carry forward. On sale, claimed depreciation is recaptured at up to 25%, and gains may owe capital-gains tax (a 1031 exchange can defer both). Figures are a year-1 estimate at your 24.0% rate — not tax advice; consult a CPA.
Schools (NCES district)
- District
- Bellevue Community Schools
- NCES district ID
- 2604650
- Math proficiency
- 14% ▼ -5.00%
- Reading proficiency
- 30% ▼ -7.00%
- Median HH income
- $50,826
- Composite
- 19.59/100
- National rank
- #8757
- State rank
- #445 of 540 in MI
Livability — Bellevue
- Score
- 69/100
- State rank
- #355
- US rank
- #9043
Category grades
Schools grade is shown separately in the Schools card above.
Census & demographics
- Census place
- Bellevue, MI
- Population (ZIP)
- 6,467
Population outlook (Eaton County) Hauer SSP2
- Today (2025)
- 110,811 people
- By 2030
- 110,598 · -0.2%
- By 2040
- 108,304 · -2.3%
- By 2050
- 104,961 · -5.3%
- By 2075
- 97,197 · -12.3%
- By 2100
- 85,150 · -23.2%
Race, ethnicity, and origin ACS 2023
- Neighborhood character
- Predominantly White (91%)
- Race & ethnicity
- White 91% Hispanic / Latino 4% Two or more races 4% Black 2%
- Common ancestry
- Iranian 4% Romanian 2% Lithuanian 2%
- Foreign-born
- 1% · Canada
- Languages at home
- 97% English-only · German/W. Germanic 1% Spanish 1%
Political lean MEDSL · Eaton
- 2024 margin
- Toss-up / Even · D 47.6% · R 50.8% · Other 1.6%
- 2008→2024 swing
- -11.6pp toward R · 2008: 8.4pp · 2024: -3.1pp
- All cycles
- 2024: R+3.1 2020: R+0.8 2016: R+5.5 2012: D+3.1 2008: D+8.4
Not yet ingested
- Civics
- —
Market trends
- HPI YoY
- ▼ -30.20%
- Current HPI
- 267.6519
- Rent YoY
- —
- Metro
- —
- State GDP YoY
- ▲ 1.37%
- F500 in state
- 28
Industry mix (Fortune 500 HQ in MI)
| Industry | F500 HQs | Revenue |
|---|---|---|
| Automotive Parts | 3 | $48B |
|
||
| Automotive | 2 | $372B |
|
||
| Chemicals | 1 | $45B |
|
||
| Automotive Retail | 1 | $29B |
|
||
| Healthcare / Medical Devices | 1 | $23B |
|
||
| Automotive Technology | 1 | $20B |
|
||
Price history
+62.1% since first listed4 events — show timeline
- 2026-05-14 Listed $149,900 REALCOMP
- 2026-05-14 Listed $149,900 Greater Lansing AoR
- 2005-09-28 Listing Removed — REALCOMP
- 2005-03-28 Listed $92,500 REALCOMP
Property tax history
+14.2%/yrLatest (2025): $1,771 · +3.1% YoY. Source: county tax records.
Cash-flow waterfall
monthlySold comps — $/sqft
last 12 mo · ≤1 miLoading sold comps…