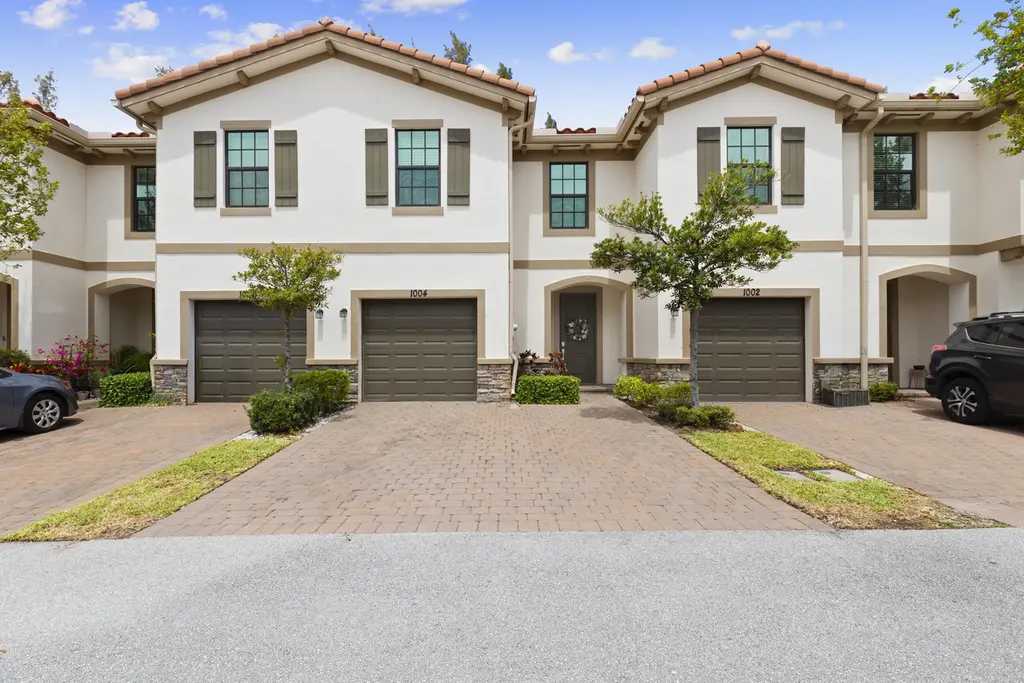
1004 Sweet Briar Ln · Riviera Beach, FL
Flood risk 1/10 · Minimal
- FEMA flood zone
- X (unshaded)
- Chance of flooding over 30 yrs
- 0.0%
- Est. flood insurance / yr
- $507 – $1,088
Fire risk 2/10 · Minimal
- Est. fire insurance / yr
- $947 – $1,759
Heat risk 10/10 · Severe
- Hot days now (above 106°F)
- 7 days/yr
- Hot days in 30 yrs
- 22 days/yr
Wind risk 10/10 · Severe
- Chance of severe wind over 30 yrs
- 99.0%
Air-quality risk 2/10 · Minimal
- Unhealthy air days now
- 0 days/yr
- Unhealthy air days in 30 yrs
- 1 days/yr
Risk factors via First Street. Map © Google.
Why this score? — see what drove the D- grade
The composite is a weighted blend of 9 inputs, each scored 0–100. Each bar is that input's sub-score; the figure is the points it added to the 100-point composite (weight × sub-score).
- Cash flow +11.8/30.0
- ARV discount +7.5/15.0
- Schools +4.3/10.0
- DSCR +3.5/10.0
- Livability +3.4/5.0
- Rent growth +3.1/5.0
- 1% rule +2.9/10.0
- Condition / age +2.5/5.0
- Appreciation +0.0/10.0
$399,000
🖨 Deal sheet 📄 Offer letter ✓ Due diligence
Listing remarks
Best Priced 3-bedroom, 2.5-bathroom townhome in the desirable Arbor Parc community + Seller credit available. This home offers a bright, open layout with plenty of natural light and a comfortable, inviting feel throughout. The kitchen features granite countertops, ample cabinet space, and flows seamlessly into the main living area — ideal for everyday living and entertaining. Impact windows provide added storm protection, energy efficiency, and peace of mind. Upstairs, the generously sized bedrooms offer comfortable retreats, and the convenient second-floor laundry room adds ease to daily living. Arbor Parc residents enjoy a resort-style pool, fitness center, clubhouse, playground, an
Key facts
- $219 HOA
- Garage
- Community pool
Property features AI
Finance
- Other: Not a waterfront property
- Financial info: Pets allowed (with limits)
- HOA & community: Community association: Mediterranew Maintenance Association, Inc. DBA Arb; HOA fee paid monthly; HOA amenities include clubhouse, fitness center, game room, management, park, playground, parking, pool, spa/hot tub, manager on site, community room, kitchen facilities, sidewalks; HOA fee covers grounds maintenance, common areas and pool service
Exterior
- Parking: 2 parking spaces total; 1 attached garage space; Covered parking space; Driveway; Paver block driveway
- Security: Gated community (no guard)
- Utilities: Public water; Public sewer; Cable available; Water available
- Home design: Townhouse; Two stories; Entry at level 1; Faces south; Resale property; Builder: Lennar (Hawthorne model)
- Construction: Built with block, stucco, CBS and stone; Barrel tile roof
- Exterior features: Open patio; Patio
Interior
- Kitchen: Disposal; Dishwasher; Electric range; Electric cooktop; Microwave; Refrigerator
- Bedrooms: No main-level bedrooms (all bedrooms upstairs)
- Flooring: Carpet; Tile
- Bathrooms: 2 full bathrooms and 1 half bathroom; One bathroom on the main level
- Heating & cooling: Central heating; Central air conditioning
- Interior features: Kitchen island; Walk-in closets; Blinds on windows
- Laundry & utility: Laundry closet in hall on upper level
Neighborhood map
What this means for you Summary
Snapshot
- This is a 3-bed/2.5-bath townhouse listed at $399k.
Deal economics
- At list price, monthly cash flow is $-112 ($-1k/yr) — negative.
- To cash-flow at today's rent, offer at most $379k (5.0% below list).
- To meet the 1% rule (rent ≥ 1% of price), the offer needs to be $317k (20.5% below list).
- Recommended offer: $317k (20.5% below list) — sets the bar for 1% rule.
Location & tenants
- Location reads 67/100 on livability (#581 in FL) — a middle-class / working-renter tenant base. Strengths: housing A+, health & safety A+, cost of living A-; Watch: employment D, crime F, amenities F.
- Palm Beach (suburban): math 46% / reading 53% proficiency, ranked #34 of 73 in FL (top 47%) — families likely to look elsewhere, expect single-tenant / working-renter base with shorter leases.
- Zoned schools: Grove Park Elementary School (math 33% / reading 33%, grade F, #1,773 of 2,144 statewide, top 83%, 511 students, 79% FRL); John F. Kennedy Middle School (math 28% / reading 29%, grade F, #482 of 571 statewide, top 85%, 826 students, 78% FRL); Palm Beach Gardens High School (math 19% / reading 40%, grade F, #447 of 667 statewide, top 68%, 2,570 students, 61% FRL) — zoned schools average 73% FRL vs 52% district-wide (21 pts higher); higher-poverty schools than district average — tighter screening recommended.
- Zoned-school proficiency averages 30% at this address vs 50% district-wide (-19 pts) — the specific schools serving this property underperform the Palm Beach average; the district grade overstates school quality for this exact location.
- Market conditions: Rents rising (+2.5%/yr); 303 active listings in the ZIP; 17 comparable units currently listed for rent nearby; rentals at typical pace (median 24d on market — plan ~3-4 weeks tenant-placement turnaround); solid renter incomes; 3,974 units permitted in Palm Beach County in 2024 (1,012 in 5+ unit buildings).
- This rent runs 40% of the median local income ($95k/yr) — at the standard rent-burdened threshold; future hikes will face affordability resistance.
Forward outlook
- Local home prices are declining (-3.0%/yr); year-one equity from $3k of loan paydown is wiped out by about $12k of value loss. Plan a longer hold.
- Palm Beach County population projected at +30% by 2050 — long-run rental-demand tailwind backs the buy-and-hold thesis.
Negotiation context
- It's been on market 63 days — a 6% lower offer ($375k) is reasonable based on typical stale-listing flexibility.
Risks & watch-outs
- Climate carrying-cost: severe wind risk, 99% chance of damaging wind over 30y; extreme-heat days projected 7→22/yr by 2055 (HVAC capex compounding) — expect insurance premiums to compound above CPI over the hold.
Questions for the listing agent
- What do current leases actually rent for vs. the listed asking? Can we see a recent rent roll and the last 12 months of T-12 income?
- It's been on market 63 days. Have you received any prior offers? Is the seller open to a 21% concession, seller financing, or rate buy-down credit?
- What does the HOA fee cover, when was the last increase, and are there any pending special assessments or reserve-fund shortfalls?
- Why hasn't it sold? Are there any deal-killer items the seller is aware of (foundation, flood, title, zoning, code violations)?
- Is there a deadline driving the sale (1031 exchange, divorce, estate, relocation)? That informs how much negotiation room exists.
- Crime grade is F in this area — have there been break-ins, vandalism, or insurance claims at this property in the last 3 years? What carrier currently insures it and at what premium?
- The area grade is low — what's the realistic commute time and amenity access for the typical tenant pool here? Any planned neighborhood developments (good or bad) we should know about?
- What's the average days-on-market for RENTAL listings here right now (not sales)? A rising rental-DOM trend means longer vacancies and softer asking-rent achievability than the comps imply.
- What's the recent tenant-quality profile in this submarket — average credit score on applications, eviction rate, late-payment / NSF rate, and stable-employment percentage? A property-management company in the area should have these aggregated.
- How much new for-sale + rental construction is in the pipeline within 1–3 miles? Heavy new supply typically softens prices + rents 12–24 months out; constrained supply supports both.
Investment metrics
- 1% rule
- 0.79% ✗
- Cap rate
- 5.96%
- Cash-on-cash
- -1.20%
- DSCR
- 0.95
- GRM
- 10.5
CMA / ARV
No comps found within radius.
Projected returns pro-forma
-3.0% appreciation · 2.49% rent growth · sell at horizon
- IRR
- -18.8%
- Equity multiple
- 0.34×
- Total profit
- $-73,443
- Equity at exit
- $59,492
- IRR
- -12.4%
- Equity multiple
- 0.29×
- Total profit
- $-79,867
- Equity at exit
- $34,498
Cash invested: $111,720 (down + closing). Projections, not guarantees.
Landlord ↔ Tenant lean methodology
- Overall (STATE)
- 87 Strongly Landlord-Friendly
- State Florida
- 87 Strongly Landlord-Friendly · R+3
- County
- — inherits STATE
- City
- — inherits STATE
ZIP-level market 33410
- Rents YoY
- 2.5%
- Active inventory
- 303
- Price-to-rent
- 10.5×
Monthly cashflow live
- Estimated rent
- $3,171 high interval (Pro) →
- Mortgage (P&I)
- −$2,092
- Tax from tax record
- −$139 /mo · $1,672/yr
- Insurance
- −$166
- HOA
- −$219
- Vacancy / Maint / Mgmt
- −$666
- Net cashflow
- $-112
Break-even live
UW: 25.0% down · 7.5% · 30yr · 1.5% tax · 5.0% vac · 8.0% maint · 8.0% mgmt
Financing live
Cash to close
- Down payment
- $99,750
- Closing costs
- $11,970
- Reserves months
- —
- Total cash needed
- —
Loan-product check · same deal, 3 products live
Conventional
25% down · 7.5% · 30yr
- Down + closing
- —
- Monthly P&I
- —
- Monthly cashflow
- —
- DSCR
- —
- Eligible?
- —
Personal DTI + credit; lowest rate.
DSCR
20% down · 8.5% · 30yr
- Down + closing
- —
- Monthly P&I
- —
- Monthly cashflow
- —
- DSCR
- —
- Eligible?
- —
No personal income docs; deal must DSCR.
Hard money
10% down · 12.0% · 12mo
- Down + closing
- —
- Monthly P&I
- —
- Monthly cashflow
- —
- DSCR
- —
- Eligible?
- —
Short-term bridge; refi at stabilization.
Rent comps 17 comps
| Address | Beds | Baths | Sqft | Rent | $/sqft | DOM | Units | Dist |
|---|---|---|---|---|---|---|---|---|
| 2004 Sugar Maple Dr Riviera Beach, FL | 4.0 | 2.5 | 1861 | $2,995 | $1.61 | 13d | 1 | 0.12mi |
| 4216 Leo Ln Unit 5G Riviera Beach, FL | 4.0 | 2.0 | 2116 | $2,900 | $1.37 | 24d | 1 | 0.17mi |
| 2022 Oysterwood Ln Riviera Beach, FL | 3.0 | 3.5 | 1714 | $2,900 | $1.69 | 24d | 1 | 0.18mi |
| 3016 King Palm Way Riviera Beach, FL | 3.0 | 2.5 | 1853 | $3,800 | $2.05 | 24d | 1 | 0.18mi |
| 4408 Hemlock Dr Riviera Beach, FL | 4.0 | 2.5 | 1861 | $3,200 | $1.72 | 20d | 1 | 0.22mi |
| 6013 Woods Edge Cir Fl 33410 Riviera Beach, FL | 3.0 | 2.5 | 1897 | $3,000 | $1.58 | 24d | 1 | 0.35mi |
| 9000 Woodbine Trl Riviera Beach, FL | 1.0–3.0 | 1.0–2.0 | 1031 | $3,015 | $2.92 | 1d | 1 | 0.53mi |
| 810 Sandtree Dr Palm Beach Gardens, FL | 4.0 | 2.5 | 1800 | $3,400 | $1.89 | 24d | 1 | 0.85mi |
| 2226 Oakmont Dr Riviera Beach, FL | 3.0 | 2.5 | 1972 | $2,850 | $1.45 | 24d | 1 | 0.86mi |
| 321 Sandtree Dr Palm Beach Gardens, FL | 3.0 | 2.5 | 1480 | $3,000 | $2.03 | 10d | 1 | 0.93mi |
| 321 Sandtree Dr Palm Beach Gardens, FL | 3.0 | 2.5 | 1480 | $3,000 | $2.03 | 24d | 1 | 0.93mi |
| 8617 Pluto Ter West Palm Beach, FL | 3.0 | 2.0 | 1560 | $3,999 | $2.56 | 24d | 1 | 0.98mi |
| 4289 S Mary Cir Palm Beach Gardens, FL | 2.0 | 2.0 | 1246 | $2,850 | $2.29 | 24d | 1 | 1.10mi |
| 2016 Avenue S Riviera Beach, FL | 4.0 | 3.0 | 1128 | $3,800 | $3.37 | 24d | 1 | 1.40mi |
| 9147 Reed Dr Unit A Palm Beach Gardens, FL | 3.0 | 2.0 | 1400 | $3,400 | $2.43 | 4d | 1 | 1.46mi |
| 1400 W 28th St Unit 1 Riviera Beach, FL | 4.0 | 2.0 | 1100 | $3,200 | $2.91 | 24d | 1 | 1.46mi |
| 1389 W 33rd St Riviera Beach, FL | 4.0 | 3.0 | 1737 | $3,000 | $1.73 | 24d | 1 | 1.47mi |
HOA detail
- Monthly dues
- $219 · $2,628/yr
- Likely covers
- poolgym
Listing history 15 events
-
2026-06-18days on market $399,000 Active 63 DOM
-
2026-06-17days on market $399,000 Active 62 DOM
-
2026-06-16days on market $399,000 Active 61 DOM
-
2026-06-15days on market $399,000 Active 60 DOM
-
2026-06-13days on market $399,000 Active 58 DOM
-
2026-06-09days on market $399,000 Active 54 DOM
-
2026-06-08days on market $399,000 Active 53 DOM
-
2026-06-07days on market $399,000 Active 52 DOM
-
2026-06-04pricedays on market $399,000 Active 49 DOM
-
2026-06-03days on market $410,000 Active 48 DOM
-
2026-06-02days on market $410,000 Active 47 DOM
-
2026-06-01days on market $410,000 Active 46 DOM
-
2026-05-31days on market $410,000 Active 45 DOM
-
2026-04-16$410,000 Active
-
2019-05-23soldstatus $19,245,000
ⓘ Source: listings_history table (triggers on properties + properties_extension) + one-shot
backfill from property_details.listing_events for pre-trigger history.
Tax reassessment forecast FL · Resets to sale price
- Current annual tax
- $1,672 · $139/mo
- Projected year-2 tax
- $3,312 · $276/mo
- Expected delta
- +$1,640/yr (+$137/mo · 98.1%)
ⓘ Screening estimate from a state-policy table — verify with the county assessor before closing.
Climate risk First Street
- Flood 1/10 Low FEMA zone X (unshaded) · 0% chance over 30 yrs
- Wildfire 2/10 Low
- Heat 10/10 Extreme 7 d/yr ≥106°F today · 22 d/yr by 30 yrs out
- Wind 10/10 Extreme 99% chance of damaging wind over 30 yrs
- Air quality 2/10 Low 0 unhealthy d/yr today · 1 by 30 yrs out
Nearby sold comps map
Loading sold comps map…
Walkable amenities ~0.75 mi
Loading nearby amenities…
Taxation est. · year 1
- Rental income
- $38,051
- − Mortgage interest
- −$22,350
- − Property taxes
- −$1,672
- − Insurance
- −$1,995
- − Repairs & maintenance
- −$3,044
- − Management
- −$3,044
- − HOA
- −$2,628
- − Depreciation
- −$11,607
- Taxable loss
- −$8,290
- Est. tax savings @ 24.0%
- +$1,990
- After-tax cash flow
- $646/yr
For passive investors: Depreciation is non-cash, so a rental often shows a tax loss while cash-flowing — sheltering income. Rental losses are passive: they offset passive income freely, and up to $25,000/yr can offset ordinary (W-2) income if you actively participate and your MAGI is under $100k (phasing out to $0 by $150k); unused losses carry forward. On sale, claimed depreciation is recaptured at up to 25%, and gains may owe capital-gains tax (a 1031 exchange can defer both). Figures are a year-1 estimate at your 24.0% rate — not tax advice; consult a CPA.
Schools (NCES district)
- District
- Palm Beach
- NCES district ID
- 1201500
- Math proficiency
- 46% ▼ -16.00%
- Reading proficiency
- 53% ▼ -4.00%
- Median HH income
- $53,943
- Composite
- 42.72/100
- National rank
- #3160
- State rank
- #34 of 73 in FL
Livability — Riviera Beach
- Score
- 67/100
- State rank
- #581
- US rank
- #11060
Category grades
Schools grade is shown separately in the Schools card above.
Census & demographics
- Census place
- Riviera Beach, FL
- County
- Palm Beach County · 1,438,312 people
- City population
- 30,912
- Metro
- Miami-Fort Lauderdale-Pompano Beach, FL
- Population (ZIP)
- 36,759
- Household income
- $94,530
- Rent vs Own
- Severe rent burden
- 1429.0
Population outlook (Palm Beach County) Hauer SSP2
- Today (2025)
- 1,637,487 people
- By 2030
- 1,743,255 · +6.5%
- By 2040
- 1,948,712 · +19.0%
- By 2050
- 2,132,979 · +30.3%
- By 2075
- 2,530,027 · +54.5%
- By 2100
- 2,706,979 · +65.3%
Race, ethnicity, and origin ACS 2023
- Neighborhood character
- Predominantly White (70%)
- Race & ethnicity
- White 70% Hispanic / Latino 15% Two or more races 13% Black 5% Asian 4%
- Hispanic origin (detail)
- Mexican 2% Puerto Rican 2% Cuban 3%
- Common ancestry
- Romanian 4% Lithuanian 3% Slovak 2%
- Foreign-born
- 17% · Canada, Jamaica, Vietnam
- Languages at home
- 78% English-only · Spanish 13% French/Haitian/Cajun 3% Other Indo-European 2%
Political lean MEDSL · Palm Beach
- 2024 margin
- Toss-up / Even · D 50.0% · R 49.2%
- 2008→2024 swing
- -22.1pp toward R · 2008: 22.9pp · 2024: 0.8pp
- All cycles
- 2024: D+0.8 2020: D+12.8 2016: D+15.3 2012: D+17.0 2008: D+22.9
Not yet ingested
- Civics
- —
Market trends
- HPI YoY
- ▼ -346.12%
- Current HPI
- 375.5381
- Rent YoY
- ▲ 2.49%
- Metro
- Miami-Fort Lauderdale-Pompano Beach, FL
- State GDP YoY
- ▲ 3.28%
- F500 in state
- 36
Industry mix (Fortune 500 HQ in FL)
| Industry | F500 HQs | Revenue |
|---|---|---|
| Industrial Technology | 2 | $29B |
|
||
| Insurance | 2 | $17B |
|
||
| Retail | 1 | $60B |
|
||
| Technology Distribution | 1 | $58B |
|
||
| Homebuilding | 1 | $35B |
|
||
| Technology Manufacturing | 1 | $35B |
|
||
Price history
-97.9% since first listed2 events — show timeline
- 2026-04-16 Listed $410,000 Beaches MLS
- 2019-05-23 Sold (Public Records) $19,245,000 Public Records
Property tax history
+17.8%/yrLatest (2025): $1,672 · +0.9% YoY. Source: county tax records.
Cash-flow waterfall
monthlySold comps — $/sqft
last 12 mo · ≤1 miLoading sold comps…