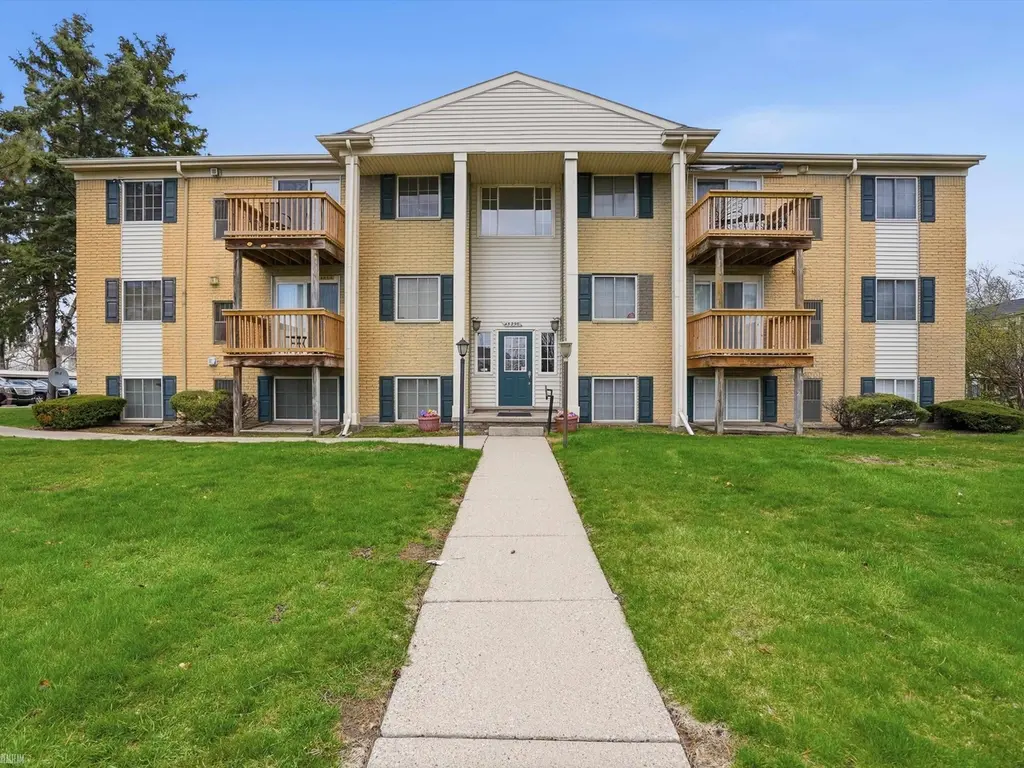
45290 Keding St · Utica, MI
Flood risk 1/10 · Minimal
- FEMA flood zone
- X (unshaded)
- Chance of flooding over 30 yrs
- 0.0%
- Est. flood insurance / yr
- $473 – $860
Fire risk 1/10 · Minimal
- Est. fire insurance / yr
- $784 – $1,456
Heat risk 3/10 · Minor
- Hot days now (above 97°F)
- 7 days/yr
- Hot days in 30 yrs
- 15 days/yr
Wind risk 1/10 · Minimal
- Chance of severe wind over 30 yrs
- —
Air-quality risk 3/10 · Minor
- Unhealthy air days now
- 3 days/yr
- Unhealthy air days in 30 yrs
- 5 days/yr
Risk factors via First Street. Map © Google.
Why this score? — see what drove the D grade
The composite is a weighted blend of 9 inputs, each scored 0–100. Each bar is that input's sub-score; the figure is the points it added to the 100-point composite (weight × sub-score).
- Cash flow +10.1/30.0
- ARV discount +7.5/15.0
- 1% rule +6.9/10.0
- Schools +4.1/10.0
- Livability +3.9/5.0
- Rent growth +3.4/5.0
- DSCR +2.9/10.0
- Condition / age +2.2/5.0
- Appreciation +0.0/10.0
$89,900
🖨 Deal sheet 📄 Offer letter ✓ Due diligence
Listing remarks MLS
Great opportunity for a buyer willing to put in a little sweat equity. Great location in Utica just off Hall Road conveniently close to shopping, transportation, Van-Dyke Freeway, Jimmy John's field, and phenomenal dining experiences. A rare unit having a dedicated laundry closet with hookups for stackable washer/dryer unit. Dedicated carport parking in space #2. Make home ownership affordable! Property taxes are currently non-homestead, millage rate will be reduced for owner occupant purchaser. * * Sale Subject to Probate Court Approval * *
Key facts
- Cozy breakfast nook
- Low-maintenance
- In-unit laundry
Tags
Property features AI
Finance
- Other: Pets allowed (contact association for details)
- HOA & community: Homeowners association with monthly fee of $275; HOA includes water and trash; Community pool
Exterior
- Parking: Covered carport
- Utilities: Public water; Public sewer
- Home design: Condominium; One story; Residential property
- Construction: Brick construction; Slab foundation; Approximately 750 above-grade finished square feet
- Exterior features: Community in-ground pool; Balcony; Paved road access
Interior
- Kitchen: Dishwasher; Microwave; Oven; Range; Refrigerator; Eat-in kitchen
- Bedrooms: 5 total rooms (includes bedrooms and living spaces)
- Bathrooms: 1 full bathroom
- Heating & cooling: Central air; Ceiling fans; Forced air heating; Natural gas heating
- Interior features: Eat-in kitchen; Balcony
- Laundry & utility: Washer; Dryer
Neighborhood map
What this means for you Summary
Snapshot
- This is a 1-bed/1.0-bath condo listed at $90k. Condition is rated fair.
Deal economics
- At list price, monthly cash flow is $-53 ($-638/yr) — negative.
- To cash-flow at today's rent, offer at most $82k (8.6% below list).
- Meets the 1% rule at list price ($1k rent vs $90k).
- Recommended offer: $82k (8.6% below list) — sets the bar for cash-flow.
- Cap rate 5.6% vs local median 3.6% in Utica — top-decile yield for the area; either an underpriced asset or a hidden risk that comps aren't pricing in. Stress-test before assuming the spread holds.
Location & tenants
- Location reads 78/100 on livability (#106 in MI, #2,586 nationally) — a middle-class / working-renter tenant base. Strengths: commute A+, cost of living A+, housing A+; Watch: crime D+, health & safety D+, employment D.
- Utica Community Schools (suburban): math 38% / reading 53% proficiency, ranked #126 of 540 in MI (top 23%) — families likely to look elsewhere, expect single-tenant / working-renter base with shorter leases.
- Market conditions: Rents rising (+3.4%/yr); 101 active listings in the ZIP; 4 comparable units currently listed for rent nearby; rentals at typical pace (median 22d on market — plan ~3-4 weeks tenant-placement turnaround); 1,321 units permitted in Macomb County in 2024 (86 in 5+ unit buildings).
- This rent is only 18% of the median local income ($73k/yr) — well below the 30% rent-burden line; pricing power to push rent on renewal without tenant pushback.
Forward outlook
- Local home prices are declining (-3.0%/yr); year-one equity from $622 of loan paydown is wiped out by about $3k of value loss. Plan a longer hold.
- Macomb County population projected at +9% by 2050 — modest demand growth; plan on rents tracking national, not racing it.
Negotiation context
- Only 7 days on market — expect competitive offers; lowballing is unlikely to land.
- 21 sale attempts since 18y ago; this cycle's ask has dropped $14k (13%) from the opening price — seller is motivated, your offer sets the floor, not the list.
- Current owner paid $70k; 28% above their basis — modest negotiation headroom, anchor on the comps not their cost.
Risks & watch-outs
- Watch-outs: HOA is 26% of rent.
Questions for the listing agent
- What do current leases actually rent for vs. the listed asking? Can we see a recent rent roll and the last 12 months of T-12 income?
- Have any recent inspections been done? Can we get a copy of the seller's disclosures and any deferred-maintenance estimates?
- Built in 1973 — when were the roof, HVAC, electrical panel, plumbing, and water heater last replaced?
- What does the HOA fee cover, when was the last increase, and are there any pending special assessments or reserve-fund shortfalls?
- Any open or pending special assessments — roof, HVAC, plumbing, elevator, façade? What's the per-unit balance and payoff schedule, and is the seller paying it off at close or rolling it to the buyer?
- Is there a deadline driving the sale (1031 exchange, divorce, estate, relocation)? That informs how much negotiation room exists.
- Crime grade is D in this area — have there been break-ins, vandalism, or insurance claims at this property in the last 3 years? What carrier currently insures it and at what premium?
- The area grade is low — what's the realistic commute time and amenity access for the typical tenant pool here? Any planned neighborhood developments (good or bad) we should know about?
- What's the average days-on-market for RENTAL listings here right now (not sales)? A rising rental-DOM trend means longer vacancies and softer asking-rent achievability than the comps imply.
- What's the recent tenant-quality profile in this submarket — average credit score on applications, eviction rate, late-payment / NSF rate, and stable-employment percentage? A property-management company in the area should have these aggregated.
- How much new apartment / multifamily construction is in the pipeline within 1–3 miles? Heavy new supply (>2% of stock underway) typically softens rents 12–24 months out; light construction supports rent growth.
Investment metrics
- 1% rule
- 1.19% ✓
- Cap rate
- 5.58%
- Cash-on-cash
- -2.53%
- DSCR
- 0.89
- GRM
- 7.0
CMA / ARV
No comps found within radius.
Projected returns pro-forma
-3.0% appreciation · 3.4% rent growth · sell at horizon
- IRR
- -19.6%
- Equity multiple
- 0.31×
- Total profit
- $-17,336
- Equity at exit
- $13,404
- IRR
- -10.7%
- Equity multiple
- 0.33×
- Total profit
- $-16,918
- Equity at exit
- $7,773
Cash invested: $25,172 (down + closing). Projections, not guarantees.
Landlord ↔ Tenant lean methodology
- Overall (STATE)
- 62 Landlord-Friendly
- State Michigan
- 62 Landlord-Friendly · EVEN
- County
- — inherits STATE
- City
- — inherits STATE
ZIP-level market 48317
- Rents YoY
- 3.4%
- Active inventory
- 101
- Price-to-rent
- 7.0×
Monthly cashflow live
- Estimated rent
- $1,067 medium interval (Pro) →
- Mortgage (P&I)
- −$471
- Tax est. 1.5%
- −$112 /mo · $1,348/yr
- Insurance
- −$37
- HOA
- −$275
- Vacancy / Maint / Mgmt
- −$224
- Net cashflow
- $-53
Break-even live
UW: 25.0% down · 7.5% · 30yr · 1.5% tax · 5.0% vac · 8.0% maint · 8.0% mgmt
Financing live
Cash to close
- Down payment
- $22,475
- Closing costs
- $2,697
- Reserves months
- —
- Total cash needed
- —
Loan-product check · same deal, 3 products live
Conventional
25% down · 7.5% · 30yr
- Down + closing
- —
- Monthly P&I
- —
- Monthly cashflow
- —
- DSCR
- —
- Eligible?
- —
Personal DTI + credit; lowest rate.
DSCR
20% down · 8.5% · 30yr
- Down + closing
- —
- Monthly P&I
- —
- Monthly cashflow
- —
- DSCR
- —
- Eligible?
- —
No personal income docs; deal must DSCR.
Hard money
10% down · 12.0% · 12mo
- Down + closing
- —
- Monthly P&I
- —
- Monthly cashflow
- —
- DSCR
- —
- Eligible?
- —
Short-term bridge; refi at stabilization.
Rent comps 4 comps
| Address | Beds | Baths | Sqft | Rent | $/sqft | DOM | Units | Dist |
|---|---|---|---|---|---|---|---|---|
| 45631 Harry St Utica, MI | 1.0–2.0 | 1.0 | 762 | $1,195 | $1.57 | 5d | 5 | 0.73mi |
| 8310 Hall Rd Utica, MI | 1.0 | 1.0 | 650 | $945 | $1.45 | 20d | 1 | 0.74mi |
| 8310 Hall Rd Utica, MI | 1.0 | 1.0 | 650 | $945 | $1.45 | 24d | 2 | 0.74mi |
| 7650 Greeley St Utica, MI | 1.0–2.0 | 1.0 | 662 | $1,150 | $1.74 | 21d | 2 | 1.08mi |
HOA detail condo
- Monthly dues
- $275 · $3,300/yr
- Assessments
- None detected in remarks — confirm with the listing agent.
Listing history 50 events
-
2026-06-18days on market $89,900 Active 7 DOM
-
2026-06-17days on market $89,900 Active 6 DOM
-
2026-06-16days on market $89,900 Active 5 DOM
-
2026-06-15days on market $89,900 Active 4 DOM
-
2026-06-13days on market $89,900 Active 2 DOM
-
2026-06-13remarks 699-char remark
-
2026-06-13pricestatusdays on market $89,900 Active 1 DOM
-
2026-05-07status Pending
-
2026-04-29historical Active Under Contract
-
2026-04-15$103,500 Active
-
2025-12-30historical Active Under Contract
-
2025-10-29$99,900 Active
-
2025-04-10soldstatus $70,000 Closed 549-char remark
Show marketing remark (549 chars)
Great opportunity for a buyer willing to put in a little sweat equity. Great location in Utica just off Hall Road conveniently close to shopping, transportation, Van-Dyke Freeway, Jimmy John's field, and phenomenal dining experiences. A rare unit having a dedicated laundry closet with hookups for stackable washer/dryer unit. Dedicated carport parking in space #2. Make home ownership affordable! Property taxes are currently non-homestead, millage rate will be reduced for owner occupant purchaser. * * Sale Subject to Probate Court Approval * *
-
2025-03-03status Pending 549-char remark
Show marketing remark (549 chars)
Great opportunity for a buyer willing to put in a little sweat equity. Great location in Utica just off Hall Road conveniently close to shopping, transportation, Van-Dyke Freeway, Jimmy John's field, and phenomenal dining experiences. A rare unit having a dedicated laundry closet with hookups for stackable washer/dryer unit. Dedicated carport parking in space #2. Make home ownership affordable! Property taxes are currently non-homestead, millage rate will be reduced for owner occupant purchaser. * * Sale Subject to Probate Court Approval * *
-
2025-02-24$80,000 Active 549-char remark
Show marketing remark (549 chars)
Great opportunity for a buyer willing to put in a little sweat equity. Great location in Utica just off Hall Road conveniently close to shopping, transportation, Van-Dyke Freeway, Jimmy John's field, and phenomenal dining experiences. A rare unit having a dedicated laundry closet with hookups for stackable washer/dryer unit. Dedicated carport parking in space #2. Make home ownership affordable! Property taxes are currently non-homestead, millage rate will be reduced for owner occupant purchaser. * * Sale Subject to Probate Court Approval * *
-
2024-05-03soldstatus $90,000 Sold
-
2024-05-03soldstatus $90,000 Closed
-
2024-04-29status Pending
-
2024-04-29status Pending
-
2024-04-26$85,000 Active
-
2024-04-26$85,000 Active
-
2024-04-23historical $85,000
-
2024-04-23historical $85,000
-
2020-01-03soldstatus $55,962 Sold
-
2020-01-03historical
-
2020-01-03soldstatus $55,962
-
2020-01-03$55,962
-
2020-01-03$55,962
-
2019-12-31status Pending
-
2019-12-31soldstatus $55,962 Sold
-
2019-12-31soldstatus $55,962 Closed
-
2019-12-31$55,962 Active
-
2019-12-31$55,962 Active
-
2019-04-25soldstatus $55,000 Sold
-
2019-04-25soldstatus $55,000 Closed
-
2019-03-25status Pending
-
2019-03-25status Pending
-
2019-03-15historical
-
2019-03-15historical
-
2019-02-06$59,900 Active
-
2019-02-06$59,900 Active
-
2011-01-28historical
-
2010-12-08historical
-
2010-10-29soldstatus $16,000
-
2010-10-16historical
-
2010-08-19$19,500
-
2010-07-28$20,000
-
2010-07-02historical
-
2010-07-01historical
-
2010-05-05$34,000
ⓘ Source: listings_history table (triggers on properties + properties_extension) + one-shot
backfill from property_details.listing_events for pre-trigger history.
Climate risk First Street
- Flood 1/10 Low FEMA zone X (unshaded) · 0% chance over 30 yrs
- Wildfire 1/10 Low
- Heat 3/10 Moderate 7 d/yr ≥97°F today · 15 d/yr by 30 yrs out
- Wind 1/10 Low
- Air quality 3/10 Moderate 3 unhealthy d/yr today · 5 by 30 yrs out
Nearby sold comps map
Loading sold comps map…
Walkable amenities ~0.75 mi
Loading nearby amenities…
Taxation est. · year 1
- Rental income
- $12,807
- − Mortgage interest
- −$5,036
- − Property taxes
- −$1,348
- − Insurance
- −$450
- − Repairs & maintenance
- −$1,025
- − Management
- −$1,025
- − HOA
- −$3,300
- − Depreciation
- −$2,615
- Taxable loss
- −$1,991
- Est. tax savings @ 24.0%
- +$478
- After-tax cash flow
- $-160/yr
For passive investors: Depreciation is non-cash, so a rental often shows a tax loss while cash-flowing — sheltering income. Rental losses are passive: they offset passive income freely, and up to $25,000/yr can offset ordinary (W-2) income if you actively participate and your MAGI is under $100k (phasing out to $0 by $150k); unused losses carry forward. On sale, claimed depreciation is recaptured at up to 25%, and gains may owe capital-gains tax (a 1031 exchange can defer both). Figures are a year-1 estimate at your 24.0% rate — not tax advice; consult a CPA.
Condition & rehab AI · 1 photo
This 1-bedroom, 1-bathroom condo requires moderate repairs to its exterior siding and landscaping to improve its curb appeal and overall value.
Repairs flagged
- Moderate Exterior siding — Weathered appearance
- Minor Landscaping — Some overgrown areas
Value-add opportunities
- Both Paint exterior siding — Enhances curb appeal and value
- Both Landscaping — Improves curb appeal and enhances property value
Renovation cost estimate screening
| Repair item | Severity | Est. cost |
|---|---|---|
| Exterior siding · Weathered appearance | Moderate | $3,000–15,000 |
| Landscaping · Some overgrown areas | Minor | $500–3,000 |
| Total estimated repair cost · 2 items | $3,500–18,000 |
Value-add ROI direction
- Both Paint exterior siding — Enhances curb appeal and value ↑
- Both Landscaping — Improves curb appeal and enhances property value ↑
ⓘ Cost ranges are severity-bucket heuristics (US national rule-of-thumb). Get contractor quotes + a written scope before underwriting a rehab budget.
Schools (NCES district)
- District
- Utica Community Schools
- NCES district ID
- 2634470
- Math proficiency
- 38% ▼ -13.00%
- Reading proficiency
- 53% ▼ -7.00%
- Median HH income
- $65,953
- Composite
- 40.52/100
- National rank
- #3709
- State rank
- #126 of 540 in MI
Livability — Utica
- Score
- 78/100
- State rank
- #106
- US rank
- #2586
Category grades
Schools grade is shown separately in the Schools card above.
Census & demographics
- Census place
- Utica, MI
- County
- Macomb County · 638,552 people
- Metro
- Detroit-Warren-Dearborn, MI
- Population (ZIP)
- 27,565
- Household income
- $72,917
- Rent vs Own
- Severe rent burden
- 1531.0
Population outlook (Macomb County) Hauer SSP2
- Today (2025)
- 925,296 people
- By 2030
- 948,226 · +2.5%
- By 2040
- 983,961 · +6.3%
- By 2050
- 1,010,200 · +9.2%
- By 2075
- 1,076,222 · +16.3%
- By 2100
- 1,077,065 · +16.4%
Race, ethnicity, and origin ACS 2023
- Neighborhood character
- Predominantly White (79%)
- Race & ethnicity
- White 79% Asian 6% Two or more races 6% Black 5% Hispanic / Latino 4%
- Common ancestry
- Romanian 13% Lithuanian 4% Slovak 2%
- Foreign-born
- 18% · Canada, China, South Korea
- Languages at home
- 79% English-only · Other Indo-European 6% Arabic 5% Russian/Polish/Slavic 2%
Political lean MEDSL · Macomb
- 2024 margin
- R (+13.7) · D 42.2% · R 55.9% · Other 1.9%
- 2008→2024 swing
- -22.3pp toward R · 2008: 8.6pp · 2024: -13.7pp
- All cycles
- 2024: R+13.7 2020: R+8.1 2016: R+11.6 2012: D+4.0 2008: D+8.6
Not yet ingested
- Civics
- —
Market trends
- HPI YoY
- ▼ -279.31%
- Current HPI
- 195.6447
- Rent YoY
- ▲ 3.40%
- Metro
- Detroit-Warren-Dearborn, MI
- State GDP YoY
- ▲ 1.37%
- F500 in state
- 28
Industry mix (Fortune 500 HQ in MI)
| Industry | F500 HQs | Revenue |
|---|---|---|
| Automotive Parts | 3 | $48B |
|
||
| Automotive | 2 | $372B |
|
||
| Chemicals | 1 | $45B |
|
||
| Automotive Retail | 1 | $29B |
|
||
| Healthcare / Medical Devices | 1 | $23B |
|
||
| Automotive Technology | 1 | $20B |
|
||
Price history
+223.4% since first listed57 events — show timeline
- 2026-05-07 Pending — REALCOMP
- 2026-04-29 Contingent — REALCOMP
- 2026-04-15 Listed $103,500 REALCOMP
- 2025-12-30 Contingent — REALCOMP
- 2025-10-29 Listed $99,900 REALCOMP
- 2025-04-10 Sold (MLS) $70,000 REALCOMP
- 2025-03-03 Pending — REALCOMP
- 2025-02-24 Listed $80,000 REALCOMP
- 2024-05-03 Sold (MLS) $90,000 MiRealSource-MiMLS
- 2024-05-03 Sold (MLS) $90,000 REALCOMP
- 2024-04-29 Pending — MiRealSource-MiMLS
- 2024-04-29 Pending — REALCOMP
- 2024-04-26 Listed $85,000 MiRealSource-MiMLS
- 2024-04-26 Listed $85,000 REALCOMP
- 2024-04-23 Coming Soon $85,000 MiRealSource-MiMLS
- 2024-04-23 Coming Soon $85,000 REALCOMP
- 2020-01-03 Listed $55,962 MiRealSource-MiMLS
- 2020-01-03 Listed $55,962 REALCOMP
- 2020-01-03 Sold (MLS) $55,962 MiRealSource-MiMLS
- 2020-01-03 Listing Removed — REALCOMP
- 2020-01-03 Sold (MLS) $55,962 REALCOMP
- 2019-12-31 Pending — REALCOMP
- 2019-12-31 Listed $55,962 MiRealSource-MiMLS
- 2019-12-31 Listed $55,962 REALCOMP
- 2019-12-31 Sold (MLS) $55,962 MiRealSource-MiMLS
- 2019-12-31 Sold (MLS) $55,962 REALCOMP
- 2019-04-25 Sold (MLS) $55,000 MiRealSource-MiMLS
- 2019-04-25 Sold (MLS) $55,000 REALCOMP
- 2019-03-25 Pending — MiRealSource-MiMLS
- 2019-03-25 Pending — REALCOMP
- 2019-03-15 Listing Removed — REALCOMP
- 2019-03-15 Listing Removed — MiRealSource-MiMLS
- 2019-02-06 Listed $59,900 MiRealSource-MiMLS
- 2019-02-06 Listed $59,900 REALCOMP
- 2011-01-28 Listing Removed — MiRealSource-MiMLS
- 2010-12-08 Listing Removed — MiRealSource-MiMLS
- 2010-10-29 Sold (MLS) $16,000 MiRealSource-MiMLS
- 2010-10-16 Listing Removed — MiRealSource-MiMLS
- 2010-08-19 Listed $19,500 MiRealSource-MiMLS
- 2010-07-28 Listed $20,000 MiRealSource-MiMLS
- 2010-07-02 Listing Removed — MiRealSource-MiMLS
- 2010-07-01 Listing Removed — MiRealSource-MiMLS
- 2010-05-05 Listed $34,000 MiRealSource-MiMLS
- 2010-04-05 Listed $20,000 MiRealSource-MiMLS
- 2010-03-09 Listed $22,000 MiRealSource-MiMLS
- 2010-03-09 Listing Removed — MiRealSource-MiMLS
- 2010-03-09 Listed $22,000 MiRealSource-MiMLS
- 2009-07-31 Sold (MLS) $19,000 MiRealSource-MiMLS
- 2009-07-23 Listing Removed — MiRealSource-MiMLS
- 2009-06-09 Listing Removed — MiRealSource-MiMLS
- 2009-06-09 Listed $21,000 MiRealSource-MiMLS
- 2009-06-02 Sold (MLS) $20,000 MiRealSource-MiMLS
- 2009-06-02 Sold (MLS) $20,000 REALCOMP
- 2009-05-11 Listing Removed — MiRealSource-MiMLS
- 2009-02-02 Listed $37,900 MiRealSource-MiMLS
- 2008-12-19 Listed $32,000 MiRealSource-MiMLS
- 2008-12-19 Listed $32,000 REALCOMP
Cash-flow waterfall
monthlySold comps — $/sqft
last 12 mo · ≤1 miLoading sold comps…