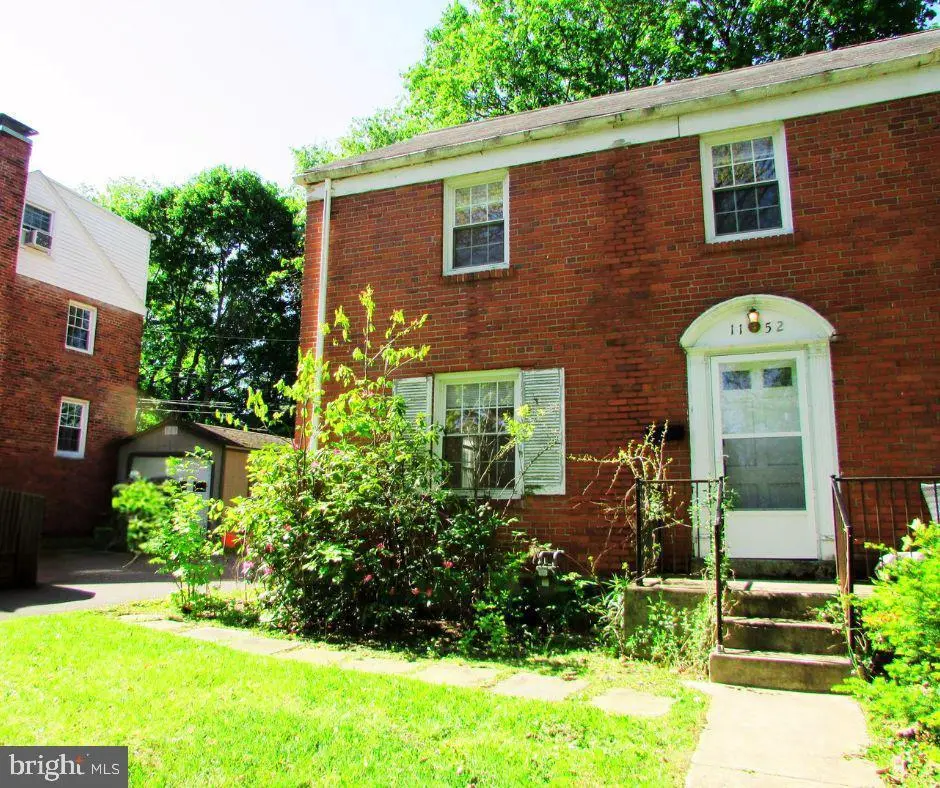
1152 S Atherton St · State College, PA
Flood risk 1/10 · Minimal
- FEMA flood zone
- X (unshaded)
- Chance of flooding over 30 yrs
- 0.0%
- Est. flood insurance / yr
- $473 – $860
Fire risk 1/10 · Minimal
- Est. fire insurance / yr
- $511 – $949
Heat risk 3/10 · Minor
- Hot days now (above 93°F)
- 7 days/yr
- Hot days in 30 yrs
- 16 days/yr
Wind risk 2/10 · Minimal
- Chance of severe wind over 30 yrs
- —
Air-quality risk 2/10 · Minimal
- Unhealthy air days now
- 0 days/yr
- Unhealthy air days in 30 yrs
- 1 days/yr
Risk factors via First Street. Map © Google.
Why this score? — see what drove the D grade
The composite is a weighted blend of 9 inputs, each scored 0–100. Each bar is that input's sub-score; the figure is the points it added to the 100-point composite (weight × sub-score).
- Cash flow +11.3/30.0
- ARV discount +10.4/15.0
- Schools +5.7/10.0
- Livability +4.5/5.0
- DSCR +3.3/10.0
- Rent growth +3.2/5.0
- 1% rule +2.8/10.0
- Condition / age +2.5/5.0
- Appreciation +0.0/10.0
$259,000
🖨 Deal sheet 📄 Offer letter ✓ Due diligence
Listing remarks
Prime Location Half-Duplex in State College Borough! Location, charm, and opportunity come together in this all-brick half-duplex in the heart of State College’s coveted neighborhood. Just minutes from Penn State University and Downtown, this home is perfect as a PSU getaway, personal residence, or savvy investment. Gleaming hardwood floors flow throughout the main and second levels. The Interior is freshly painted, professionaly cleaned, and move-in ready. The main floor offers a spacious living room, bright dining area, and dedicated kitchen, while upstairs features three light-filled bedrooms and a full bath. Outside, relax or entertain on the large back deck. This property has an
Key facts
- Large back deck
- All-brick
- Half-duplex
Tags
Property features AI
Exterior
- Parking: Two driveway parking spaces (total of 2 garage/parking spaces)
- Utilities: Public water; Public sewer; Electric service for hot water
- Home design: Semi-detached property; Fee simple ownership; Property in good condition; Assessor-reported year built
- Construction: Brick construction; Block foundation; Asphalt roof
- Exterior features: Asphalt driveway
Interior
- Kitchen: Kitchen
- Bedrooms: Three bedrooms on the upper level
- Flooring: Hardwood
- Bathrooms: One full bathroom
- Heating & cooling: Forced air heating; Natural gas heating fuel
- Interior features: Hardwood flooring; Full, unfinished basement
- Laundry & utility: Electric hot water
Neighborhood map
What this means for you Summary
Snapshot
- This is a 3-bed/1.0-bath townhouse listed at $259k.
Deal economics
- At list price, monthly cash flow is $-94 ($-1k/yr) — negative.
- To cash-flow at today's rent, offer at most $242k (6.4% below list).
- To meet the 1% rule (rent ≥ 1% of price), the offer needs to be $202k (22.2% below list).
- Recommended offer: $202k (22.2% below list) — sets the bar for 1% rule.
- Cap rate 5.9% vs local median 1.6% in State College — top-decile yield for the area; either an underpriced asset or a hidden risk that comps aren't pricing in. Stress-test before assuming the spread holds.
Location & tenants
- Location reads 89/100 on livability (#29 in PA, #164 nationally) — a professional / high-income tenant draw. Strengths: schools A+, crime A+, amenities A+; Watch: employment C-, cost of living C-.
- State College Area SD (urban): math 62% / reading 73% proficiency, ranked #41 of 539 in PA (top 8%) — acceptable for families but not a draw, mixed tenant base, ~2y average lease; only 15% free/reduced lunch — higher-income household profile.
- Market conditions: Rents rising (+2.8%/yr); 158 active listings in the ZIP; 6 comparable units currently listed for rent nearby; rentals lingering (median 44d on market — plan ~5-8 weeks vacancy on turnover, expect pricing pressure); 100% of comp listings sitting > 30 days — soft ceiling on asking rent; 399 units permitted in Centre County in 2024 (44 in 5+ unit buildings).
- This rent runs 39% of the median local income ($62k/yr) — at the standard rent-burdened threshold; future hikes will face affordability resistance.
Forward outlook
- Local home prices are declining (-3.0%/yr); year-one equity from $2k of loan paydown is wiped out by about $8k of value loss. Plan a longer hold.
- Centre County population projected at +16% by 2050 — long-run rental-demand tailwind backs the buy-and-hold thesis.
Negotiation context
- Only 2 days on market — expect competitive offers; lowballing is unlikely to land.
Risks & watch-outs
- Watch-outs: built in 1947 — expect roof / HVAC / electrical / plumbing capex.
Questions for the listing agent
- What do current leases actually rent for vs. the listed asking? Can we see a recent rent roll and the last 12 months of T-12 income?
- Built in 1947 — when were the roof, HVAC, electrical panel, plumbing, and water heater last replaced?
- Is there a deadline driving the sale (1031 exchange, divorce, estate, relocation)? That informs how much negotiation room exists.
- Schools are A-rated — typically a magnet for longer-tenancy family renters. What's the average tenant stay here, and is there a school-zone premium baked into asking?
- The area grade is low — what's the realistic commute time and amenity access for the typical tenant pool here? Any planned neighborhood developments (good or bad) we should know about?
- What's the average days-on-market for RENTAL listings here right now (not sales)? A rising rental-DOM trend means longer vacancies and softer asking-rent achievability than the comps imply.
- What's the recent tenant-quality profile in this submarket — average credit score on applications, eviction rate, late-payment / NSF rate, and stable-employment percentage? A property-management company in the area should have these aggregated.
- How much new for-sale + rental construction is in the pipeline within 1–3 miles? Heavy new supply typically softens prices + rents 12–24 months out; constrained supply supports both.
Investment metrics
- 1% rule
- 0.78% ✗
- Cap rate
- 5.86%
- Cash-on-cash
- -1.56%
- DSCR
- 0.93
- GRM
- 10.7
CMA / ARV
- ARV (on-the-fly)
- $277,104
- Comps found
- 4
Show comp detail 4 sales within ~0.75 mi
| Address | Dist | Beds/Ba | Sqft | Sold | Price | $/sf | Match |
|---|---|---|---|---|---|---|---|
| 1152 S Atherton St | 0.00mi | 3/1.0 | 1,104 (0%) | 0mo | $260,000 | $236 | 100 |
| 1172 S Atherton St | 0.04mi | 3/1.0 | 1,104 (0%) | 1mo | $257,000 | $233 | 97 |
| 218 Westerly Pkwy | 0.10mi | 3/1.0 | 1,104 (0%) | 3mo | $277,000 | $251 | 93 |
| 300 S Pugh St #504 | 0.69mi | 2/2.0 (-1) | 1,077 (-2%) | 8mo | $431,500 | $401 | 48 |
Match score weights: distance 35% · size 25% · config 20% · recency 20%. Top-matched comps best support the ARV.
Projected returns pro-forma
-3.0% appreciation · 2.77% rent growth · sell at horizon
- IRR
- -19.1%
- Equity multiple
- 0.33×
- Total profit
- $-48,463
- Equity at exit
- $38,618
- IRR
- -12.2%
- Equity multiple
- 0.28×
- Total profit
- $-51,957
- Equity at exit
- $22,394
Cash invested: $72,520 (down + closing). Projections, not guarantees.
Landlord ↔ Tenant lean methodology
- Overall (STATE)
- 62 Landlord-Friendly
- State Pennsylvania
- 62 Landlord-Friendly · EVEN
- County
- — inherits STATE
- City
- — inherits STATE
ZIP-level market 16801
- Rents YoY
- 2.8%
- Active inventory
- 158
- Price-to-rent
- 10.7×
Monthly cashflow live
- Estimated rent
- $2,016 high interval (Pro) →
- Mortgage (P&I)
- −$1,358
- Tax from tax record
- −$221 /mo · $2,646/yr
- Insurance
- −$108
- HOA
- −$0
- Vacancy / Maint / Mgmt
- −$423
- Net cashflow
- $-94
Break-even live
UW: 25.0% down · 7.5% · 30yr · 1.5% tax · 5.0% vac · 8.0% maint · 8.0% mgmt
Financing live
Cash to close
- Down payment
- $64,750
- Closing costs
- $7,770
- Reserves months
- —
- Total cash needed
- —
Loan-product check · same deal, 3 products live
Conventional
25% down · 7.5% · 30yr
- Down + closing
- —
- Monthly P&I
- —
- Monthly cashflow
- —
- DSCR
- —
- Eligible?
- —
Personal DTI + credit; lowest rate.
DSCR
20% down · 8.5% · 30yr
- Down + closing
- —
- Monthly P&I
- —
- Monthly cashflow
- —
- DSCR
- —
- Eligible?
- —
No personal income docs; deal must DSCR.
Hard money
10% down · 12.0% · 12mo
- Down + closing
- —
- Monthly P&I
- —
- Monthly cashflow
- —
- DSCR
- —
- Eligible?
- —
Short-term bridge; refi at stabilization.
Rent comps 6 comps
| Address | Beds | Baths | Sqft | Rent | $/sqft | DOM | Units | Dist |
|---|---|---|---|---|---|---|---|---|
| 200 Bradley Ave State College, PA | 1.0–3.0 | 1.0–1.5 | 755 | $1,730 | $2.29 | 43d | 6 | 0.29mi |
| 424 Waupelani Dr State College, PA | 2.0 | 1.0–2.0 | 603 | $1,495 | $2.48 | 43d | 63 | 0.47mi |
| 200 Highland Ave #501 State College, PA | 2.0 | 1.0 | 890 | $1,800 | $2.02 | 43d | 1 | 0.75mi |
| 679-A Waupelani Dr State College, PA | 4.0 | 1.0–2.5 | 1335 | $2,339 | $1.75 | 43d | 47 | 0.85mi |
| 730 W Highland Aly State College, PA | 3.0 | 1.0 | 900 | $2,199 | $2.44 | 43d | 1 | 0.93mi |
| 616 E College Ave State College, PA | 2.0 | 2.0 | 975 | $2,610 | $2.68 | 43d | 2 | 1.09mi |
Listing history 2 events
-
2026-05-14status Pending
-
2026-05-12$259,000 Active
ⓘ Source: listings_history table (triggers on properties + properties_extension) + one-shot
backfill from property_details.listing_events for pre-trigger history.
Tax reassessment forecast PA · Partial reset (capped growth)
- Current annual tax
- $2,646 · $221/mo
- Projected year-2 tax
- $3,369 · $281/mo
- Expected delta
- +$723/yr (+$60/mo · 27.3%)
ⓘ Screening estimate from a state-policy table — verify with the county assessor before closing.
Climate risk First Street
- Flood 1/10 Low FEMA zone X (unshaded) · 0% chance over 30 yrs
- Wildfire 1/10 Low
- Heat 3/10 Moderate 7 d/yr ≥93°F today · 16 d/yr by 30 yrs out
- Wind 2/10 Low
- Air quality 2/10 Low 0 unhealthy d/yr today · 1 by 30 yrs out
Nearby sold comps map
Loading sold comps map…
Walkable amenities ~0.75 mi
Loading nearby amenities…
Taxation est. · year 1
- Rental income
- $24,190
- − Mortgage interest
- −$14,508
- − Property taxes
- −$2,646
- − Insurance
- −$1,295
- − Repairs & maintenance
- −$1,935
- − Management
- −$1,935
- − Depreciation
- −$7,535
- Taxable loss
- −$5,664
- Est. tax savings @ 24.0%
- +$1,359
- After-tax cash flow
- $230/yr
For passive investors: Depreciation is non-cash, so a rental often shows a tax loss while cash-flowing — sheltering income. Rental losses are passive: they offset passive income freely, and up to $25,000/yr can offset ordinary (W-2) income if you actively participate and your MAGI is under $100k (phasing out to $0 by $150k); unused losses carry forward. On sale, claimed depreciation is recaptured at up to 25%, and gains may owe capital-gains tax (a 1031 exchange can defer both). Figures are a year-1 estimate at your 24.0% rate — not tax advice; consult a CPA.
Schools (NCES district)
- District
- State College Area SD
- NCES district ID
- 4222770
- Math proficiency
- 62% ▼ -4.00%
- Reading proficiency
- 73% ▼ -7.00%
- Median HH income
- $49,753
- Composite
- 57.23/100
- National rank
- #1094
- State rank
- #41 of 539 in PA
Livability — State College
- Score
- 89/100
- State rank
- #29
- US rank
- #164
Category grades
Schools grade is shown separately in the Schools card above.
Census & demographics
- Census place
- State College, PA
- County
- Centre County · 99,000 people
- City population
- 64,751
- Metro
- State College, PA
- Population (ZIP)
- 40,774
- Household income
- $61,836
- Rent vs Own
- Severe rent burden
- 3590.0
Population outlook (Centre County) Hauer SSP2
- Today (2025)
- 177,113 people
- By 2030
- 185,138 · +4.5%
- By 2040
- 196,009 · +10.7%
- By 2050
- 205,070 · +15.8%
- By 2075
- 217,575 · +22.8%
- By 2100
- 230,649 · +30.2%
Race, ethnicity, and origin ACS 2023
- Neighborhood character
- Predominantly White (80%)
- Race & ethnicity
- White 80% Asian 9% Two or more races 6% Hispanic / Latino 4% Black 3%
- Common ancestry
- Romanian 6% Lithuanian 2% Scotch-Irish 2%
- Foreign-born
- 12% · China, South Korea, Canada
- Languages at home
- 86% English-only · Chinese 3% Spanish 2% Other Indo-European 2%
Political lean MEDSL · Centre
- 2024 margin
- Toss-up / Even · D 50.9% · R 48.1% · Other 1.0%
- 2008→2024 swing
- -9.0pp toward R · 2008: 11.8pp · 2024: 2.8pp
- All cycles
- 2024: D+2.8 2020: D+4.8 2016: D+1.9 2012: R+0.0 2008: D+11.8
Not yet ingested
- Civics
- —
Market trends
- HPI YoY
- ▼ -140.33%
- Current HPI
- 208.2423
- Rent YoY
- ▲ 2.77%
- Metro
- State College, PA
- State GDP YoY
- ▲ 1.68%
- F500 in state
- 34
Industry mix (Fortune 500 HQ in PA)
| Industry | F500 HQs | Revenue |
|---|---|---|
| Healthcare | 2 | $309B |
|
||
| Insurance | 2 | $27B |
|
||
| Telecommunications / Media | 1 | $124B |
|
||
| Industrial Distribution | 1 | $22B |
|
||
| Financial Services | 1 | $20B |
|
||
| Chemicals / Materials | 1 | $18B |
|
||
Price history
2 events — show timeline
- 2026-05-14 Pending — BRIGHT MLS
- 2026-05-12 Listed $259,000 BRIGHT MLS
Property tax history
+3.4%/yrLatest (2026): $2,646 · +4.9% YoY. Source: county tax records.
Cash-flow waterfall
monthlySold comps — $/sqft
last 12 mo · ≤1 miLoading sold comps…