7205 Beechnut St Unit D · Houston, TX
Flood risk 1/10 · Minimal
- FEMA flood zone
- X (shaded)
- Chance of flooding over 30 yrs
- 0.0%
- Est. flood insurance / yr
- $507 – $1,088
Fire risk 1/10 · Minimal
- Est. fire insurance / yr
- $1,222 – $2,270
Heat risk 9/10 · Severe
- Hot days now (above 110°F)
- 7 days/yr
- Hot days in 30 yrs
- 23 days/yr
Wind risk 9/10 · Severe
- Chance of severe wind over 30 yrs
- 99.0%
Air-quality risk 2/10 · Minimal
- Unhealthy air days now
- 2 days/yr
- Unhealthy air days in 30 yrs
- 2 days/yr
Risk factors via First Street. Map © Google.
Why this score? — see what drove the D grade
The composite is a weighted blend of 9 inputs, each scored 0–100. Each bar is that input's sub-score; the figure is the points it added to the 100-point composite (weight × sub-score).
- ARV discount +12.0/15.0
- 1% rule +9.8/10.0
- Cash flow +7.7/30.0
- Livability +3.7/5.0
- Rent growth +2.7/5.0
- Schools +2.7/10.0
- Condition / age +2.5/5.0
- DSCR +1.8/10.0
- Appreciation +0.0/10.0
$79,990
🖨 Deal sheet (PDF) 📄 Offer letter ✓ Due diligence
Listing remarks MLS
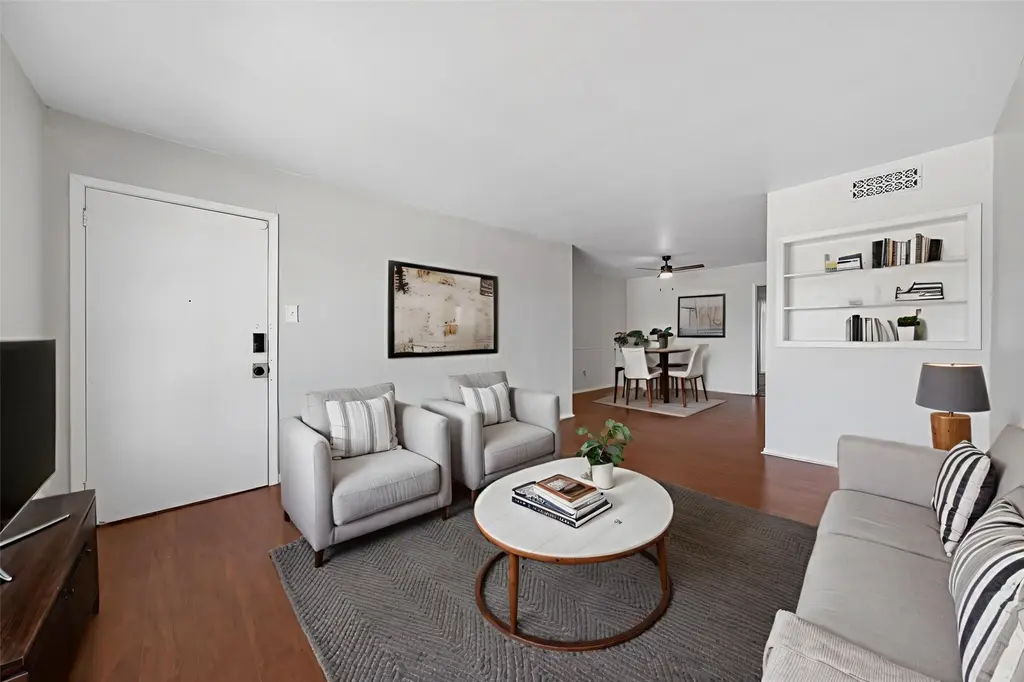
Welcome to this lovely 2-bedroom, 2-bath condo located on the second floor, with move-in ready appeal. The unit features a functional layout with vinyl wood look flooring, spacious living areas and plenty of natural light throughout. The kitchen offers plenty of cabinet and counter space and will include the refrigerator. The washer and dryer will also remain in with the unit. Enjoy a covered back porch and the convenience of assigned parking under a covered carport, providing protection and easy access. Ideally situated just minutes from Highway 69, Memorial Hermann Southwest, Houston Christian University, and a wide variety of restaurants, shopping, and entertainment options. Schedule your showing today!
Key facts
- Assigned parking
- Covered back porch
- $400 HOA
Tags
Neighborhood map
What this means for you Summary
Snapshot
- This is a 2-bed/2.0-bath condo listed at $80k.
Deal economics
- At list price, monthly cash flow is $-91 ($-1k/yr) — negative.
- To cash-flow at today's rent, offer at most $64k (20.1% below list).
- Meets the 1% rule at list price ($1k rent vs $80k).
- Recommended offer: $64k (20.1% below list) — sets the bar for cash-flow.
- Cap rate 4.9% vs local median 3.2% in Houston — top-decile yield for the area; either an underpriced asset or a hidden risk that comps aren't pricing in. Stress-test before assuming the spread holds.
Location & tenants
- Location reads 74/100 on livability (#184 in TX, #4,771 nationally) — a middle-class / working-renter tenant base. Strengths: amenities A+, cost of living A+, housing A+; Watch: crime F.
- Houston ISD (urban): math 27% / reading 35% proficiency, ranked #593 of 826 in TX (top 72%) — families likely to look elsewhere, expect single-tenant / working-renter base with shorter leases; 71% free/reduced lunch — lower-income household profile, screen leases tightly.
- Zoned schools: Mcnamara El (math 8% / reading 17%, grade F, #4,180 of 4,322 statewide, top 97%, 993 students, 99% FRL); Sugar Grove Academy (math 8% / reading 15%, grade F, #1,629 of 1,662 statewide, top 98%, 841 students, 98% FRL); Sharpstown H S (math 7% / reading 23%, grade F, #1,507 of 1,632 statewide, top 93%, 1,855 students, 89% FRL) — zoned schools average 95% FRL vs 71% district-wide (24 pts higher); higher-poverty schools than district average — tighter screening recommended.
- Zoned-school proficiency averages 13% at this address vs 31% district-wide (-18 pts) — the specific schools serving this property underperform the Houston ISD average; the district grade overstates school quality for this exact location.
- Market conditions: Rents flat; 105 active listings in the ZIP; 40 comparable units currently listed for rent nearby; rentals at typical pace (median 20d on market — plan ~3-4 weeks tenant-placement turnaround); 29,883 units permitted in Harris County in 2024 (8,621 in 5+ unit buildings).
Forward outlook
- Local home prices are declining (-3.0%/yr); year-one equity from $554 of loan paydown is wiped out by about $2k of value loss. Plan a longer hold.
- Harris County population projected at +47% by 2050 — long-run rental-demand tailwind backs the buy-and-hold thesis.
Negotiation context
- It's been on market 78 days — a 6% lower offer ($75k) is reasonable based on typical stale-listing flexibility.
- 4 sale attempts since 11y ago; this cycle's ask is 3899% above the opening price — seller raised mid-cycle; expect resistance to lowballs.
- Current owner paid $29k; list at $80k implies a 176% gain — meaningful room to come down on a strong offer.
Risks & watch-outs
- Watch-outs: property tax is 2.6% of price; HOA is 34% of rent.
- Climate carrying-cost: severe wind risk, 99% chance of damaging wind over 30y; extreme-heat days projected 7→23/yr by 2055 (HVAC capex compounding) — expect insurance premiums to compound above CPI over the hold.
Questions for the listing agent
- What do current leases actually rent for vs. the listed asking? Can we see a recent rent roll and the last 12 months of T-12 income?
- It's been on market 78 days. Have you received any prior offers? Is the seller open to a 20% concession, seller financing, or rate buy-down credit?
- Built in 1962 — when were the roof, HVAC, electrical panel, plumbing, and water heater last replaced?
- Property tax is high relative to price — has the assessment been appealed recently, and will the sale trigger a re-assessment?
- What does the HOA fee cover, when was the last increase, and are there any pending special assessments or reserve-fund shortfalls?
- Any open or pending special assessments — roof, HVAC, plumbing, elevator, façade? What's the per-unit balance and payoff schedule, and is the seller paying it off at close or rolling it to the buyer?
- Why hasn't it sold? Are there any deal-killer items the seller is aware of (foundation, flood, title, zoning, code violations)?
- Is there a deadline driving the sale (1031 exchange, divorce, estate, relocation)? That informs how much negotiation room exists.
- Schools are D-rated, which usually means shorter tenancies and higher turnover. Who's the typical renter profile here, and what's been the actual vacancy rate?
- Crime grade is F in this area — have there been break-ins, vandalism, or insurance claims at this property in the last 3 years? What carrier currently insures it and at what premium?
- The area grade is low — what's the realistic commute time and amenity access for the typical tenant pool here? Any planned neighborhood developments (good or bad) we should know about?
- What's the average days-on-market for RENTAL listings here right now (not sales)? A rising rental-DOM trend means longer vacancies and softer asking-rent achievability than the comps imply.
- What's the recent tenant-quality profile in this submarket — average credit score on applications, eviction rate, late-payment / NSF rate, and stable-employment percentage? A property-management company in the area should have these aggregated.
- How much new apartment / multifamily construction is in the pipeline within 1–3 miles? Heavy new supply (>2% of stock underway) typically softens rents 12–24 months out; light construction supports rent growth.
Investment metrics
- 1% rule
- 1.48% ✓
- Cap rate
- 4.92%
- Cash-on-cash
- -4.89%
- DSCR
- 0.78
- GRM
- 5.6
CMA / ARV
- ARV (median comp)
- $88,951
- List price
- $79,990
- Delta
- -10.07%
- Verdict
- UNDERPRICED
- Comps
- 20 within 1.0 mi
Projected returns pro-forma
-3.0% appreciation · 0.61% rent growth · sell at horizon
- IRR
- -29.6%
- Equity multiple
- 0.05×
- Total profit
- $-21,249
- Equity at exit
- $11,927
- IRR
- -65.3%
- Equity multiple
- -0.59×
- Total profit
- $-35,630
- Equity at exit
- $6,916
Cash invested: $22,397 (down + closing). Projections, not guarantees.
Landlord ↔ Tenant lean methodology
- Overall (STATE)
- 87 Strongly Landlord-Friendly
- State Texas
- 87 Strongly Landlord-Friendly · R+5
- County
- — inherits STATE
- City
- — inherits STATE
ZIP-level market 77074
- Home prices YoY
- -15.1%
- Rents YoY
- 0.6%
- Active inventory
- 105
- Price-to-rent
- 5.6×
Monthly cashflow live
- Estimated rent
- $1,187 high interval (Pro) →
- Mortgage (P&I)
- −$419
- Tax from tax record
- −$176 /mo · $2,117/yr
- Insurance
- −$33
- HOA
- −$400
- Vacancy / Maint / Mgmt
- −$249
- Net cashflow
- $-91
Break-even live
Sensitivity live
| Price | -10% $-46 | -5% $-69 | +0% $-91 | +5% $-114 | +10% $-136 |
|---|---|---|---|---|---|
| Rent | -10% $-185 | -5% $-138 | +0% $-91 | +5% $-44 | +10% $3 |
| Rate | -1.0pp $-51 | -0.5pp $-71 | base $-91 | +0.5pp $-112 | +1.0pp $-133 |
UW: 25.0% down · 7.5% · 30yr · 1.5% tax · 5.0% vac · 8.0% maint · 8.0% mgmt
Financing live
Cash to close
- Down payment
- $19,998
- Closing costs
- $2,400
- Reserves months
- —
- Total cash needed
- —
Loan-product check · same deal, 3 products live
Conventional
25% down · 7.5% · 30yr
- Down + closing
- —
- Monthly P&I
- —
- Monthly cashflow
- —
- DSCR
- —
- Eligible?
- —
Personal DTI + credit; lowest rate.
DSCR
20% down · 8.5% · 30yr
- Down + closing
- —
- Monthly P&I
- —
- Monthly cashflow
- —
- DSCR
- —
- Eligible?
- —
No personal income docs; deal must DSCR.
Hard money
10% down · 12.0% · 12mo
- Down + closing
- —
- Monthly P&I
- —
- Monthly cashflow
- —
- DSCR
- —
- Eligible?
- —
Short-term bridge; refi at stabilization.
Rent comps 40 comps
| Address | Beds | Baths | Sqft | Rent | $/sqft | DOM | Units | Dist |
|---|---|---|---|---|---|---|---|---|
| 7400 Bissonnet St Houston, TX | 2.0–3.0 | 1.5–2.0 | 959 | $847 | $0.88 | 3d | 2 | 0.27mi |
| 7400 Bissonnet St Houston, TX | 2.0–3.0 | 1.5–2.0 | 959 | $875 | $0.91 | 45d | 14 | 0.27mi |
| 7000 Fonvilla St Houston, TX | 1.0–2.0 | 1.0–2.0 | 975 | $1,405 | $1.44 | 19d | 1 | 0.29mi |
| 7047 Bissonnet St Houston, TX | 1.0–2.0 | 1.0–1.5 | 1250 | $1,150 | $0.92 | 45d | 2 | 0.39mi |
| 6833 Beechnut St Houston, TX | 1.0–2.0 | 1.0–2.0 | 868 | $1,030 | $1.19 | 18d | 1 | 0.41mi |
| 7047 Bissonnet St #93 Houston, TX | 2.0 | 1.5 | 1250 | $1,150 | $0.92 | 26d | 1 | 0.43mi |
| 8716 Fondren Rd Houston, TX | 2.0 | 1.0 | 930 | $850 | $0.91 | 45d | 1 | 0.48mi |
| 7511 Beechnut St Houston, TX | 1.0–2.0 | 1.0 | 750 | $1,035 | $1.38 | 13d | 1 | 0.50mi |
| 7575 Bissonnet St Houston, TX | 3.0 | 1.0–2.0 | 900 | $1,115 | $1.24 | 3d | 21 | 0.59mi |
| 8917 S Gessner Rd Houston, TX | 1.0–3.0 | 1.0–2.0 | 871 | $893 | $1.02 | 0d | 15 | 0.98mi |
| 7581 Bellaire Blvd Houston, TX | 2.0 | 2.0 | 834 | $1,350 | $1.62 | 26d | 1 | 1.02mi |
| 6960 Bellaire Blvd Houston, TX | 1.0 | 1.0 | 727 | $935 | $1.29 | 45d | 1 | 1.03mi |
| 6960 Bellaire Blvd Houston, TX | 1.0 | 1.0 | 713 | $945 | $1.33 | 22d | 1 | 1.03mi |
| 6414 Neff St Houston, TX | 3.0 | 2.0 | 1492 | $2,350 | $1.58 | 45d | 1 | 1.18mi |
| 9600 Braes Bayou Dr Houston, TX | 1.0–2.0 | 1.0–2.0 | 950 | $1,029 | $1.08 | 1d | 10 | 1.20mi |
| 5906 N Braeswood Blvd Unit 121 Houston, TX | 2.0 | 1.0 | 800 | $1,020 | $1.27 | 23d | 1 | 1.22mi |
| 20 Larkwood Dr Houston, TX | 2.0 | 1.0 | 909 | $955 | $1.05 | 45d | 1 | 1.23mi |
| 7525 Hillcroft Ave Unit 43 Houston, TX | 1.0 | 1.0 | 705 | $900 | $1.28 | 45d | 1 | 1.26mi |
| 7525 Hillcroft Ave Unit 22 Houston, TX | 2.0 | 2.0 | 1075 | $1,300 | $1.21 | 45d | 1 | 1.26mi |
| 7900 Bellaire Blvd Houston, TX | 1.0–3.0 | 1.0–2.0 | 942 | $1,180 | $1.25 | 19d | 1 | 1.28mi |
| 6718 De Moss Dr Houston, TX | 1.0–3.0 | 1.0–2.5 | 978 | $1,054 | $1.08 | 3d | 34 | 1.29mi |
| 8336 Carvel Ln Houston, TX | 2.0 | 1.0 | 955 | $1,070 | $1.12 | 45d | 1 | 1.29mi |
| 7500 Clarewood Dr Houston, TX | 2.0 | 2.0 | 1025 | $1,015 | $0.99 | 16d | 1 | 1.36mi |
| 7506 Clarewood Dr Houston, TX | 1.0 | 1.0 | 715 | $830 | $1.16 | 45d | 1 | 1.36mi |
| 10007 Larkwood Dr Houston, TX | 3.0 | 2.0 | 1263 | $1,349 | $1.07 | 45d | 1 | 1.36mi |
| 6310 Dumfries Dr Houston, TX | 1.0–3.0 | 1.0–2.0 | 1005 | $1,045 | $1.04 | 1d | 20 | 1.38mi |
| 5815 Gulfton St Houston, TX | 1.0 | 1.0 | 855 | $940 | $1.10 | 45d | 1 | 1.39mi |
| 9600 Glenfield Ct Unit 1047 Houston, TX | 1.0 | 1.0 | 750 | $1,204 | $1.61 | 12d | 1 | 1.40mi |
| 9600 Glenfield Ct Unit 1047 Houston, TX | 1.0 | 1.0 | 750 | $1,203 | $1.60 | 4d | 1 | 1.40mi |
| 9600 Glenfield Ct Unit 1174 Houston, TX | 1.0 | 1.0 | 750 | $1,194 | $1.59 | 0d | 1 | 1.40mi |
| 9600 Glenfield Ct Unit 324 Houston, TX | 1.0 | 1.0 | 750 | $1,164 | $1.55 | 9d | 1 | 1.40mi |
| 9600 Glenfield Ct Unit 9674 Houston, TX | 1.0 | 1.0 | 750 | $1,203 | $1.60 | 12d | 1 | 1.40mi |
| 9600 Glenfield Ct Unit 1162 Houston, TX | 1.0 | 1.0 | 750 | $1,164 | $1.55 | 7d | 1 | 1.40mi |
| 9600 Glenfield Ct Unit 1112 Houston, TX | 1.0 | 1.0 | 750 | $1,153 | $1.54 | 0d | 1 | 1.40mi |
| 6316 Dumfries Dr Houston, TX | 1.0 | 1.0 | 752 | $929 | $1.24 | 45d | 1 | 1.42mi |
| 8100 Bellaire Blvd Houston, TX | 1.0–3.0 | 1.0–2.0 | 881 | $1,115 | $1.26 | 1d | 26 | 1.43mi |
| 7001 Hillcroft St Houston, TX | 1.0–2.0 | 1.0–2.0 | 804 | $1,255 | $1.56 | 15d | 1 | 1.43mi |
| 7111 Hillcroft St Houston, TX | 2.0 | 1.0 | 745 | $1,210 | $1.62 | 45d | 1 | 1.43mi |
| 7111 Hillcroft Ave Apt 422 Houston, TX | 2.0 | 2.0 | 920 | $1,079 | $1.17 | 9d | 1 | 1.43mi |
| 7111 Hillcroft Ave Unit 2162 Houston, TX | 2.0 | 2.0 | 920 | $1,079 | $1.17 | 7d | 1 | 1.43mi |
HOA detail condo
- Monthly dues
- $400 · $4,800/yr
- Likely covers
- parking
- Assessments
- None detected in remarks — confirm with the listing agent.
Listing history 18 events
-
2026-06-07days on market $79,990 Pending 78 DOM
-
2026-06-04statusdays on market $79,990 Pending 77 DOM
-
2026-06-01days on market $79,990 Active 74 DOM
-
2026-05-31days on market $79,990 Active 73 DOM
-
2026-04-28historical $2,000
-
2026-03-27$2,000
-
2026-03-19$79,990 Active 715-char remark
Show marketing remark (715 chars)
Welcome to this lovely 2-bedroom, 2-bath condo located on the second floor, with move-in ready appeal. The unit features a functional layout with vinyl wood look flooring, spacious living areas and plenty of natural light throughout. The kitchen offers plenty of cabinet and counter space and will include the refrigerator. The washer and dryer will also remain in with the unit. Enjoy a covered back porch and the convenience of assigned parking under a covered carport, providing protection and easy access. Ideally situated just minutes from Highway 69, Memorial Hermann Southwest, Houston Christian University, and a wide variety of restaurants, shopping, and entertainment options. Schedule your showing today!
-
2020-04-29soldstatus
-
2020-04-24soldstatus Sold 214-char remark
Show marketing remark (214 chars)
Ready to move in condo located across the street from Houston Baptist University. Close to Herman Memorial Hospital and Hwy 59, Hwy 610. Two bedrooms and 2 full baths with BIG spacious living room and dining room.
-
2020-03-11status Pending 214-char remark
Show marketing remark (214 chars)
Ready to move in condo located across the street from Houston Baptist University. Close to Herman Memorial Hospital and Hwy 59, Hwy 610. Two bedrooms and 2 full baths with BIG spacious living room and dining room.
-
2020-02-29status Option Pending 214-char remark
Show marketing remark (214 chars)
Ready to move in condo located across the street from Houston Baptist University. Close to Herman Memorial Hospital and Hwy 59, Hwy 610. Two bedrooms and 2 full baths with BIG spacious living room and dining room.
-
2019-09-30$72,000 Active 214-char remark
Show marketing remark (214 chars)
Ready to move in condo located across the street from Houston Baptist University. Close to Herman Memorial Hospital and Hwy 59, Hwy 610. Two bedrooms and 2 full baths with BIG spacious living room and dining room.
-
2015-08-14soldstatus
-
2015-08-12soldstatus Sold
-
2015-08-05status Pending
-
2015-07-31status Option Pending
-
2015-06-04$62,000 Active
-
1999-01-08soldstatus $29,000
ⓘ Source: listings_history table (triggers on properties + properties_extension) + one-shot
backfill from property_details.listing_events for pre-trigger history.
Tax reassessment forecast TX · Resets to sale price
- Current annual tax
- $2,117 · $176/mo
- Projected year-2 tax
- $2,117 · $176/mo
- Expected delta
- $0/yr ($0/mo · 0.0%)
ⓘ Screening estimate from a state-policy table — verify with the county assessor before closing.
Climate risk First Street
- Flood 1/10 Low FEMA zone X (shaded) · 0% chance over 30 yrs
- Wildfire 1/10 Low
- Heat 9/10 Extreme 7 d/yr ≥110°F today · 23 d/yr by 30 yrs out
- Wind 9/10 Extreme 99% chance of damaging wind over 30 yrs
- Air quality 2/10 Low 2 unhealthy d/yr today · 2 by 30 yrs out
Nearby sold comps map
Loading sold comps map…
Walkable amenities ~0.75 mi
Loading nearby amenities…
Taxation est. · year 1
- Rental income
- $14,248
- − Mortgage interest
- −$4,481
- − Property taxes
- −$2,117
- − Insurance
- −$400
- − Repairs & maintenance
- −$1,140
- − Management
- −$1,140
- − HOA
- −$4,800
- − Depreciation
- −$2,327
- Taxable loss
- −$2,156
- Est. tax savings @ 24.0%
- +$517
- After-tax cash flow
- $-577/yr
For passive investors: Depreciation is non-cash, so a rental often shows a tax loss while cash-flowing — sheltering income. Rental losses are passive: they offset passive income freely, and up to $25,000/yr can offset ordinary (W-2) income if you actively participate and your MAGI is under $100k (phasing out to $0 by $150k); unused losses carry forward. On sale, claimed depreciation is recaptured at up to 25%, and gains may owe capital-gains tax (a 1031 exchange can defer both). Figures are a year-1 estimate at your 24.0% rate — not tax advice; consult a CPA.
Schools (NCES district)
- District
- Houston ISD
- NCES district ID
- 4823640
- Math proficiency
- 27% ▼ -18.00%
- Reading proficiency
- 35% ▼ -6.00%
- Median HH income
- $46,054
- Composite
- 26.63/100
- National rank
- #7173
- State rank
- #593 of 826 in TX
Livability — Houston
- Score
- 74/100
- State rank
- #184
- US rank
- #4771
Category grades
Schools grade is shown separately in the Schools card above.
Census & demographics
- Census place
- Houston, TX
- County
- Harris County · 4,702,590 people
- City population
- 3,226,434
- Metro
- Houston-The Woodlands-Sugar Land, TX
- Population (ZIP)
- 38,660
- Household income
- $47,810
- Rent vs Own
- Severe rent burden
- 2019.0
Population outlook (Harris County) Hauer SSP2
- Today (2025)
- 5,571,493 people
- By 2030
- 6,089,821 · +9.3%
- By 2040
- 7,142,806 · +28.2%
- By 2050
- 8,185,864 · +46.9%
- By 2075
- 10,574,329 · +89.8%
- By 2100
- 12,109,958 · +117.4%
Race, ethnicity, and origin ACS 2023
- Neighborhood character
- Diverse neighborhood (Simpson 0.57)
- Race & ethnicity
- Hispanic / Latino 62% Two or more races 22% White 14% Black 13% Asian 8% Native American 1%
- Hispanic origin (detail)
- Mexican 30%
- Common ancestry
- Arab 2% Italian 1% Slovak 1%
- Foreign-born
- 53% · Canada, Vietnam, Jamaica
- Languages at home
- 23% English-only · Spanish 59% Other Indo-European 5% Arabic 3%
Political lean MEDSL · Harris
- 2024 margin
- Lean D (+5.5) · D 52.0% · R 46.4% · Other 1.6%
- 2008→2024 swing
- +3.9pp toward D · 2008: 1.6pp · 2024: 5.5pp
- All cycles
- 2024: D+5.5 2020: D+13.3 2016: D+12.4 2012: D+0.1 2008: D+1.6
Not yet ingested
- Civics
- —
Market trends
- HPI YoY
- ▼ -52.20%
- Current HPI
- 293.2864
- Rent YoY
- ▲ 0.61%
- Metro
- Houston-The Woodlands-Sugar Land, TX
- State GDP YoY
- ▲ 3.95%
- F500 in state
- 110
Industry mix (Fortune 500 HQ in TX)
| Industry | F500 HQs | Revenue |
|---|---|---|
| Energy | 16 | $1,198B |
|
||
| Technology | 5 | $198B |
|
||
| Engineering / Construction | 4 | $72B |
|
||
| Energy Services | 3 | $60B |
|
||
| Utilities | 3 | $41B |
|
||
| Healthcare | 2 | $330B |
|
||
Price history
-93.1% since first listed14 events — show timeline
- 2026-04-28 Rental Removed $2,000 TURBOTENANT
- 2026-03-27 Listed for Rent $2,000 TURBOTENANT
- 2026-03-19 Listed $79,990 HARMLS
- 2020-04-29 Sold (Public Records) — Public Records
- 2020-04-24 Sold (MLS) — HARMLS
- 2020-03-11 Pending — HARMLS
- 2020-02-29 Pending — HARMLS
- 2019-09-30 Listed $72,000 HARMLS
- 2015-08-14 Sold (Public Records) — Public Records
- 2015-08-12 Sold (MLS) — HARMLS
- 2015-08-05 Pending — HARMLS
- 2015-07-31 Pending — HARMLS
- 2015-06-04 Listed $62,000 HARMLS
- 1999-01-08 Sold (Public Records) $29,000 Public Records
Property tax history
+1.9%/yrLatest (2025): $2,117 · +1.5% YoY. Source: county tax records.
Cash-flow waterfall
monthlySold comps — $/sqft
last 12 mo · ≤1 miLoading sold comps…