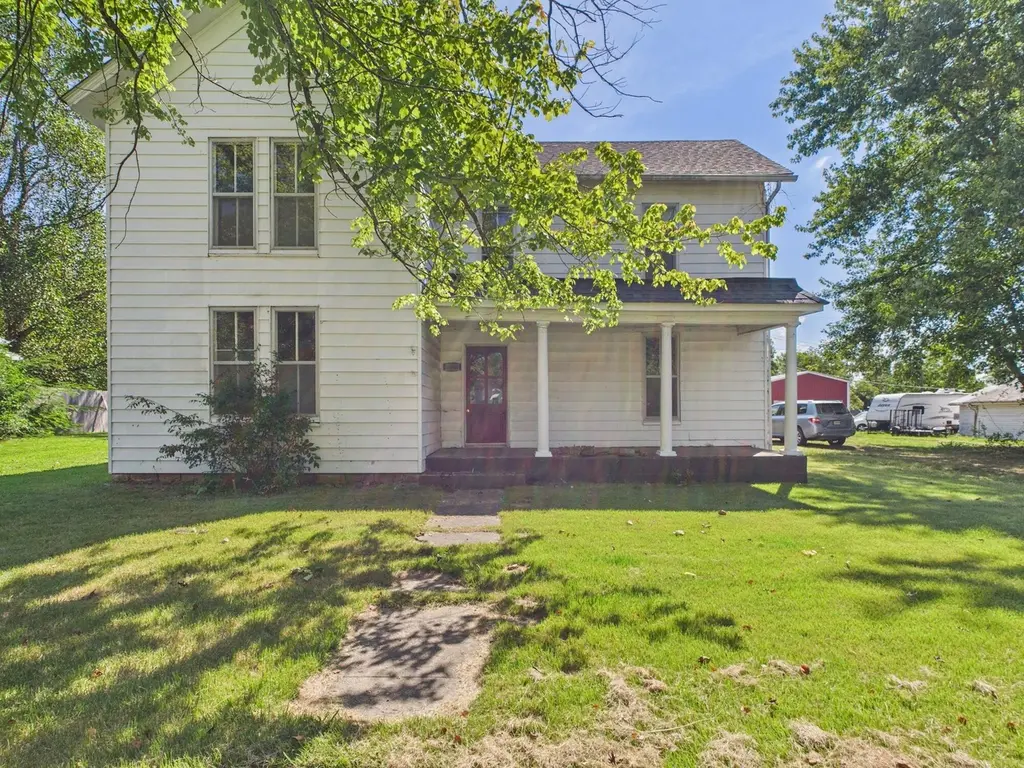
212 N Main St · Licking, MO
Flood risk 1/10 · Minimal
- FEMA flood zone
- X
- Chance of flooding over 30 yrs
- 0.0%
- Est. flood insurance / yr
- $507 – $1,088
Fire risk 5/10 · Moderate
- Est. fire insurance / yr
- $1,054 – $1,958
Heat risk 5/10 · Moderate
- Hot days now (above 105°F)
- 7 days/yr
- Hot days in 30 yrs
- 19 days/yr
Wind risk 2/10 · Minimal
- Chance of severe wind over 30 yrs
- 1.0%
Air-quality risk 2/10 · Minimal
- Unhealthy air days now
- 0 days/yr
- Unhealthy air days in 30 yrs
- 1 days/yr
Risk factors via First Street. Map © Google.
Why this score? — see what drove the B- grade
The composite is a weighted blend of 9 inputs, each scored 0–100. Each bar is that input's sub-score; the figure is the points it added to the 100-point composite (weight × sub-score).
- Cash flow +23.4/30.0
- ARV discount +15.0/15.0
- DSCR +7.5/10.0
- Appreciation +6.6/10.0
- 1% rule +6.1/10.0
- Livability +3.2/5.0
- Schools +3.0/10.0
- Rent growth +2.5/5.0
- Condition / age +2.2/5.0
$122,500
🖨 Deal sheet 📄 Offer letter ✓ Due diligence
Listing remarks MLS
Classic 2 story home located on an oversized lot in Licking Mo. On the Main floor you will find 1 bedroom, Living room, Formal Dining Room and a large eat in Kitchen. An oversized Laundry room with plenty of space for extra storage. Upstairs you will find 3 large bedrooms with plenty of space & the potential to convert and add and additional bathroom if desired. This home has great potential, for someone with the vision and ability to bring it to it's full potential! Yes, It needs some TLC and elbow grease to bring it back to it's full Glory & Potential & it's priced accordingly! Priced At $64 per square foot! Wow! How can you beat that for something that is completely livable while you work on it. Did I mention a wood burning fireplace in the Living Room? Did I mention that This home also has Central Heat and Air, with A wood or Coal outside Boiler System, which helps to makes this large home super affordable to heat and cool.
Key facts
- Large eat in kitchen
- Central heat and air
- Oversized lot
Tags
Neighborhood map
What this means for you Summary
Snapshot
- This is a 4-bed/1.0-bath single-family listed at $122k. Condition is rated fair.
Deal economics
- At list price, monthly cash flow is $226 ($3k/yr) — positive.
- The deal already cash-flows at list — no discount required.
- Meets the 1% rule at list price ($1k rent vs $122k).
- Recommended offer: $108k (12.0% below list) — sets the bar for market timing.
- Cap rate 8.5% vs local median 3.3% in Licking — top-decile yield for the area; either an underpriced asset or a hidden risk that comps aren't pricing in. Stress-test before assuming the spread holds.
Location & tenants
- Location reads 65/100 on livability (#265 in MO) — a middle-class / working-renter tenant base. Strengths: cost of living A+, housing A+, crime B; Watch: schools F, amenities F, commute F.
- Licking R-VIII (rural): math 30% / reading 44% proficiency, ranked #203 of 324 in MO (top 63%) — families likely to look elsewhere, expect single-tenant / working-renter base with shorter leases.
- Market conditions: 50 active listings in the ZIP; 10 units permitted in Texas County in 2024 (5 in 5+ unit buildings).
Forward outlook
- In year one you build about $5k of equity ($847 loan paydown + $4k appreciation (3.2% local appreciation)).
- Texas County population projected at -11% by 2050 — secular population decline; favor cash flow + early exit over multi-decade hold.
- At projected returns (3.2% appreciation + 3.0% rent growth), your $34k cash investment doubles in ~5 years — after that, you're playing with house money.
- By year 7, paydown + projected appreciation supports a ~$30k cash-out refi (75% LTV) — recoverable capital for the next deal without selling this one.
Negotiation context
- It's been on market 305 days — a 12% lower offer ($108k) is reasonable based on typical stale-listing flexibility.
- 5 sale attempts since 8y ago with the ask held roughly flat each time — persistent listings suggest the price (not the market) is what's stuck; bring a comps-based counter.
Risks & watch-outs
- Watch-outs: built in 1890 — expect roof / HVAC / electrical / plumbing capex.
- Climate carrying-cost: moderate wildfire risk; extreme-heat days projected 7→19/yr by 2055 (HVAC capex compounding) — expect insurance premiums to compound above CPI over the hold.
Questions for the listing agent
- It's been on market 305 days. Have you received any prior offers? Is the seller open to a 12% concession, seller financing, or rate buy-down credit?
- Have any recent inspections been done? Can we get a copy of the seller's disclosures and any deferred-maintenance estimates?
- Built in 1890 — when were the roof, HVAC, electrical panel, plumbing, and water heater last replaced?
- Why hasn't it sold? Are there any deal-killer items the seller is aware of (foundation, flood, title, zoning, code violations)?
- Is there a deadline driving the sale (1031 exchange, divorce, estate, relocation)? That informs how much negotiation room exists.
- Schools are F-rated, which usually means shorter tenancies and higher turnover. Who's the typical renter profile here, and what's been the actual vacancy rate?
- What's the average days-on-market for RENTAL listings here right now (not sales)? A rising rental-DOM trend means longer vacancies and softer asking-rent achievability than the comps imply.
- What's the recent tenant-quality profile in this submarket — average credit score on applications, eviction rate, late-payment / NSF rate, and stable-employment percentage? A property-management company in the area should have these aggregated.
- How much new for-sale + rental construction is in the pipeline within 1–3 miles? Heavy new supply typically softens prices + rents 12–24 months out; constrained supply supports both.
Investment metrics
- 1% rule
- 1.11% ✓
- Cap rate
- 8.51%
- Cash-on-cash
- 7.91%
- DSCR
- 1.35
- GRM
- 7.5
CMA / ARV
- ARV (median comp)
- $196,110
- List price
- $122,500
- Delta
- -37.54%
- Verdict
- UNDERPRICED
- Comps
- 20 within 1.0 mi
Show comp detail 3 sales within ~0.75 mi
| Address | Dist | Beds/Ba | Sqft | Sold | Price | $/sf | Match |
|---|---|---|---|---|---|---|---|
| 229 S Main St | 0.67mi | 4/3.0 | 1,921 (-2%) | 6mo | $140,000 | $73 | 53 |
| 309 Dorsey St | 0.38mi | 3/2.0 (-1) | 1,791 (-8%) | 23mo | $237,050 | $132 | 40 |
| 206 Chestnut Dr | 0.46mi | 3/2.0 (-1) | 1,664 (-15%) | 6mo | $210,000 | $126 | 40 |
Match score weights: distance 35% · size 25% · config 20% · recency 20%. Top-matched comps best support the ARV.
Projected returns pro-forma
3.19% appreciation · 3.0% rent growth · sell at horizon
- IRR
- 15.4%
- Equity multiple
- 1.89×
- Total profit
- $30,449
- Equity at exit
- $56,429
- IRR
- 16.9%
- Equity multiple
- 3.53×
- Total profit
- $86,696
- Equity at exit
- $88,025
Cash invested: $34,300 (down + closing). Projections, not guarantees.
Landlord ↔ Tenant lean methodology
- Overall (STATE)
- 81 Strongly Landlord-Friendly
- State Missouri
- 81 Strongly Landlord-Friendly · R+10
- County
- — inherits STATE
- City
- — inherits STATE
ZIP-level market 65542
- Home prices YoY
- 1.4%
- Active inventory
- 50
- Price-to-rent
- 7.5×
Monthly cashflow live
- Estimated rent
- $1,358 medium interval (Pro) →
- Mortgage (P&I)
- −$642
- Tax est. 1.5%
- −$153 /mo · $1,838/yr
- Insurance
- −$51
- HOA
- −$0
- Vacancy / Maint / Mgmt
- −$285
- Net cashflow
- $226
Break-even live
UW: 25.0% down · 7.5% · 30yr · 1.5% tax · 5.0% vac · 8.0% maint · 8.0% mgmt
Financing live
Cash to close
- Down payment
- $30,625
- Closing costs
- $3,675
- Reserves months
- —
- Total cash needed
- —
Loan-product check · same deal, 3 products live
Conventional
25% down · 7.5% · 30yr
- Down + closing
- —
- Monthly P&I
- —
- Monthly cashflow
- —
- DSCR
- —
- Eligible?
- —
Personal DTI + credit; lowest rate.
DSCR
20% down · 8.5% · 30yr
- Down + closing
- —
- Monthly P&I
- —
- Monthly cashflow
- —
- DSCR
- —
- Eligible?
- —
No personal income docs; deal must DSCR.
Hard money
10% down · 12.0% · 12mo
- Down + closing
- —
- Monthly P&I
- —
- Monthly cashflow
- —
- DSCR
- —
- Eligible?
- —
Short-term bridge; refi at stabilization.
Listing history 22 events
-
2026-06-18days on market $122,500 Active 305 DOM
-
2026-06-17days on market $122,500 Active 304 DOM
-
2026-06-16days on market $122,500 Active 303 DOM
-
2026-06-15pricedays on market $122,500 Active 302 DOM
-
2026-06-13days on market $125,000 Active 300 DOM
-
2026-06-12days on market $125,000 Active 299 DOM
-
2026-06-09days on market $125,000 Active 296 DOM
-
2026-06-08days on market $125,000 Active 295 DOM
-
2026-06-07days on market $125,000 Active 294 DOM
-
2026-06-07days on market $125,000 Active 293 DOM
-
2026-06-04days on market $125,000 Active 290 DOM
-
2026-06-02days on market $125,000 Active 289 DOM
-
2026-06-01days on market $125,000 Active 288 DOM
-
2026-05-31days on market $125,000 Active 287 DOM
-
2025-08-15$125,000 Active 963-char remark
Show marketing remark (963 chars)
Classic 2 story home located on an oversized lot in Licking Mo. On the Main floor you will find 1 bedroom, Living room, Formal Dining Room and a large eat in Kitchen. An oversized Laundry room with plenty of space for extra storage. Upstairs you will find 3 large bedrooms with plenty of space & the potential to convert and add and additional bathroom if desired. This home has great potential, for someone with the vision and ability to bring it to it's full potential! Yes, It needs some TLC and elbow grease to bring it back to it's full Glory & Potential & it's priced accordingly! Priced At $64 per square foot! Wow! How can you beat that for something that is completely livable while you work on it. Did I mention a wood burning fireplace in the Living Room? Did I mention that This home also has Central Heat and Air, with A wood or Coal outside Boiler System, which helps to makes this large home super affordable to heat and cool.
-
2025-01-09$95,000 Active
-
2021-03-12soldstatus Closed
-
2021-03-12soldstatus
-
2020-12-02status Pending
-
2020-11-04$95,000 Active
-
2020-11-04$95,000
-
2018-08-06$99,500
ⓘ Source: listings_history table (triggers on properties + properties_extension) + one-shot
backfill from property_details.listing_events for pre-trigger history.
Climate risk First Street
- Flood 1/10 Low FEMA zone X · 0% chance over 30 yrs
- Wildfire 5/10 Major
- Heat 5/10 Major 7 d/yr ≥105°F today · 19 d/yr by 30 yrs out
- Wind 2/10 Low 100% chance of damaging wind over 30 yrs
- Air quality 2/10 Low 0 unhealthy d/yr today · 1 by 30 yrs out
Nearby sold comps map
Loading sold comps map…
Walkable amenities ~0.75 mi
Loading nearby amenities…
Taxation est. · year 1
- Rental income
- $16,295
- − Mortgage interest
- −$6,862
- − Property taxes
- −$1,838
- − Insurance
- −$612
- − Repairs & maintenance
- −$1,304
- − Management
- −$1,304
- − Depreciation
- −$3,564
- Taxable income
- $812
- Est. tax owed @ 24.0%
- −$195
- After-tax cash flow
- $2,519/yr
For passive investors: Depreciation is non-cash, so a rental often shows a tax loss while cash-flowing — sheltering income. Rental losses are passive: they offset passive income freely, and up to $25,000/yr can offset ordinary (W-2) income if you actively participate and your MAGI is under $100k (phasing out to $0 by $150k); unused losses carry forward. On sale, claimed depreciation is recaptured at up to 25%, and gains may owe capital-gains tax (a 1031 exchange can defer both). Figures are a year-1 estimate at your 24.0% rate — not tax advice; consult a CPA.
Condition & rehab AI · 12 photos
This 2-story home requires extensive repairs and updates to bring it up to a fair condition. Significant work is needed on the exterior, roof, flooring, and interior systems to improve its value and appeal.
Repairs flagged
- Major siding — Severe weathering and damage
- Major roof — Exposed structure
- Major flooring — Worn and uneven
- Major interior walls/paint — Peeling paint and exposed areas
- Major bathrooms — Exposed plumbing and fixtures
- Major systems — Exposed wiring and plumbing
Value-add opportunities
- Both exterior paint and siding — Enhances curb appeal and value
- Both roof replacement — Critical for structural integrity and value
- Both flooring replacement — Improves living space and value
- Both interior paint and repairs — Enhances interior appearance and value
- Both bathroom updates — Improves functionality and value
- Both system upgrades — Enhances functionality and value
Renovation cost estimate screening
| Repair item | Severity | Est. cost |
|---|---|---|
| siding · Severe weathering and damage | Major | $15,000–50,000 |
| roof · Exposed structure | Major | $15,000–50,000 |
| flooring · Worn and uneven | Major | $15,000–50,000 |
| interior walls/paint · Peeling paint and exposed areas | Major | $15,000–50,000 |
| bathrooms · Exposed plumbing and fixtures | Major | $15,000–50,000 |
| systems · Exposed wiring and plumbing | Major | $15,000–50,000 |
| Total estimated repair cost · 6 items | $90,000–300,000 |
Value-add ROI direction
- Both exterior paint and siding — Enhances curb appeal and value ↑
- Both roof replacement — Critical for structural integrity and value ↑
- Both flooring replacement — Improves living space and value ↑
- Both interior paint and repairs — Enhances interior appearance and value ↑
- Both bathroom updates — Improves functionality and value ↑
- Both system upgrades — Enhances functionality and value ↑
ⓘ Cost ranges are severity-bucket heuristics (US national rule-of-thumb). Get contractor quotes + a written scope before underwriting a rehab budget.
Schools (NCES district)
- District
- Licking R-VIII
- NCES district ID
- 2918600
- Math proficiency
- 30% ▼ -4.00%
- Reading proficiency
- 44% ▼ -3.00%
- Median HH income
- $33,880
- Composite
- 30.41/100
- National rank
- #6248
- State rank
- #203 of 324 in MO
Livability — Licking
- Score
- 65/100
- State rank
- #265
- US rank
- #12566
Category grades
Schools grade is shown separately in the Schools card above.
Census & demographics
- Census place
- Licking, MO
- Population (ZIP)
- 6,921
Population outlook (Texas County) Hauer SSP2
- Today (2025)
- 24,648 people
- By 2030
- 23,981 · -2.7%
- By 2040
- 22,840 · -7.3%
- By 2050
- 21,832 · -11.4%
- By 2075
- 19,481 · -21.0%
- By 2100
- 16,634 · -32.5%
Race, ethnicity, and origin ACS 2023
- Neighborhood character
- Predominantly White (88%)
- Race & ethnicity
- White 88% Black 7% Two or more races 4% Hispanic / Latino 2%
- Common ancestry
- Slovak 3% Serbian 2% Lithuanian 2%
- Foreign-born
- 1% · Canada
- Languages at home
- 97% English-only · Spanish 1% Arabic 1%
Political lean MEDSL · Texas
- 2024 margin
- Solid R (+71.7) · D 13.8% · R 85.5%
- 2008→2024 swing
- -36.7pp toward R · 2008: -35.1pp · 2024: -71.7pp
- All cycles
- 2024: R+71.7 2020: R+68.6 2016: R+65.4 2012: R+44.1 2008: R+35.1
Not yet ingested
- Civics
- —
Market trends
- HPI YoY
- ▲ 3.19%
- Current HPI
- 228.0581
- Rent YoY
- —
- Metro
- —
- State GDP YoY
- ▲ 1.84%
- F500 in state
- 20
Industry mix (Fortune 500 HQ in MO)
| Industry | F500 HQs | Revenue |
|---|---|---|
| Healthcare | 1 | $163B |
|
||
| Insurance | 1 | $21B |
|
||
| Industrial Technology | 1 | $17B |
|
||
| Retail | 1 | $16B |
|
||
| Industrial Distribution | 1 | $10B |
|
||
| Utilities | 1 | $9B |
|
||
Price history
+25.6% since first listed8 events — show timeline
- 2025-08-15 Listed $125,000 SOMO
- 2025-01-09 Listed $95,000 MARIS as Distributed by MLS Grid
- 2021-03-12 Sold (MLS) — SOMO
- 2021-03-12 Sold (MLS) — MARIS as Distributed by MLS Grid
- 2020-12-02 Pending — MARIS as Distributed by MLS Grid
- 2020-11-04 Listed $95,000 MARIS as Distributed by MLS Grid
- 2020-11-04 Listed $95,000 SOMO
- 2018-08-06 Listed $99,500 SOMO
Cash-flow waterfall
monthlySold comps — $/sqft
last 12 mo · ≤1 miLoading sold comps…