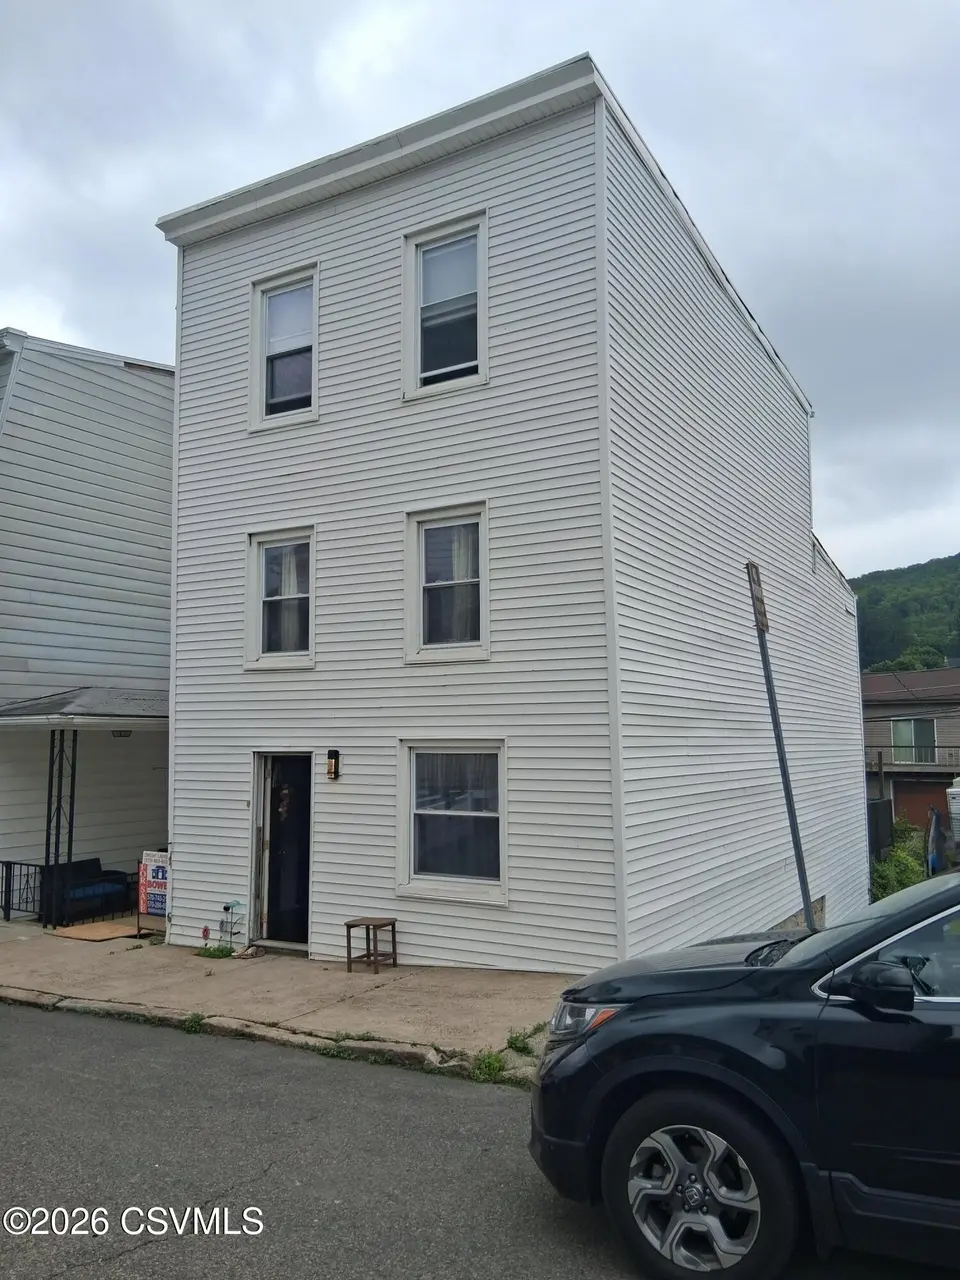
1422 Market St · Ashland, PA
Flood risk 8/10 · Major
- FEMA flood zone
- X (unshaded)
- Chance of flooding over 30 yrs
- 0.99%
- Est. flood insurance / yr
- $473 – $860
Fire risk 3/10 · Minor
- Est. fire insurance / yr
- $511 – $949
Heat risk 4/10 · Minor
- Hot days now (above 95°F)
- 8 days/yr
- Hot days in 30 yrs
- 17 days/yr
Wind risk 3/10 · Minor
- Chance of severe wind over 30 yrs
- 6.0%
Air-quality risk 2/10 · Minimal
- Unhealthy air days now
- 1 days/yr
- Unhealthy air days in 30 yrs
- 2 days/yr
Risk factors via First Street. Map © Google.
Why this score? — see what drove the B grade
The composite is a weighted blend of 9 inputs, each scored 0–100. Each bar is that input's sub-score; the figure is the points it added to the 100-point composite (weight × sub-score).
- Cash flow +21.6/30.0
- ARV discount +15.0/15.0
- Appreciation +10.0/10.0
- DSCR +6.9/10.0
- 1% rule +5.6/10.0
- Livability +3.2/5.0
- Schools +2.8/10.0
- Rent growth +2.5/5.0
- Condition / age +2.5/5.0
$129,900
🖨 Deal sheet 📄 Offer letter ✓ Due diligence
Listing remarks MLS
Spacious 4-bedroom, 1-bath, 2,140 sqft home located in the heart of Ashland, PA, a charming town known for its scenic surroundings and rich history. This property offers ample potential for customization and renovation, perfect for those seeking a project to create their dream home or an investment opportunity. Currently vacant and ready for its next chapter, this home is conveniently situated near local amenities and outdoor attractions. Needs work but provides a solid foundation. Contact Santiago for showing details and make this Ashland property yours!
Key facts
- Porch
- Deck
- Outdoor space
Tags
Property features AI
Finance
- HOA & community: Sidewalks in the community
Exterior
- Parking: No parking
- Utilities: Public water; Public sewer
- Home design: Single family residence; Residential property
- Construction: Vinyl siding and frame construction; Rubber roof; No foundation details listed; Built area above grade: 2,140
- Exterior features: Deck; Porch; Storm door(s)
Interior
- Kitchen: Refrigerator included
- Flooring: Hardwood
- Bathrooms: 1 full bathroom
- Heating & cooling: Baseboard heating; Has heating
- Interior features: Window coverings; Hardwood floors; Refrigerator included; Total of 10 rooms
Neighborhood map
What this means for you Summary
Snapshot
- This is a 4-bed/1.0-bath single-family listed at $130k.
Deal economics
- At list price, monthly cash flow is $142 ($2k/yr) — positive.
- The deal already cash-flows at list — no discount required.
- Meets the 1% rule at list price ($1k rent vs $130k).
- Cap rate 8.1% vs local median 10.9% in Ashland — below-typical yield; the buyer is paying a premium for something (appreciation thesis, condition, location) that the cap rate doesn't capture.
Location & tenants
- Location reads 64/100 on livability (#1,179 in PA) — a middle-class / working-renter tenant base. Strengths: crime A+, cost of living A+, housing A+; Watch: schools D-, amenities F, commute F.
- North Schuylkill SD (rural): math 19% / reading 48% proficiency, ranked #429 of 539 in PA (top 80%) — families likely to look elsewhere, expect single-tenant / working-renter base with shorter leases.
- Market conditions: 48 active listings in the ZIP; 169 units permitted in Schuylkill County in 2024 (0 in 5+ unit buildings).
Forward outlook
- In year one you build about $14k of equity ($898 loan paydown + $13k appreciation (10.0% local appreciation)).
- Schuylkill County population projected at -16% by 2050 — secular population decline; favor cash flow + early exit over multi-decade hold.
- At projected returns (10.0% appreciation + 3.0% rent growth), your $36k cash investment doubles in ~3 years — after that, you're playing with house money.
- By year 3, paydown + projected appreciation supports a ~$35k cash-out refi (75% LTV) — recoverable capital for the next deal without selling this one.
Negotiation context
- Only 9 days on market — expect competitive offers; lowballing is unlikely to land.
- 3 sale attempts since 13y ago with the ask held roughly flat each time — persistent listings suggest the price (not the market) is what's stuck; bring a comps-based counter.
- Current owner paid $31k; list at $130k implies a 319% gain — meaningful room to come down on a strong offer.
Risks & watch-outs
- Watch-outs: flood insurance adds $56/mo; built in 1935 — expect roof / HVAC / electrical / plumbing capex.
- Climate carrying-cost: severe flood risk — expect insurance premiums to compound above CPI over the hold.
Questions for the listing agent
- Built in 1935 — when were the roof, HVAC, electrical panel, plumbing, and water heater last replaced?
- What's the actual annual flood-insurance premium (NFIP or private), and is the property in a SFHA with mandatory coverage?
- Is there a deadline driving the sale (1031 exchange, divorce, estate, relocation)? That informs how much negotiation room exists.
- Schools are D-rated, which usually means shorter tenancies and higher turnover. Who's the typical renter profile here, and what's been the actual vacancy rate?
- What's the average days-on-market for RENTAL listings here right now (not sales)? A rising rental-DOM trend means longer vacancies and softer asking-rent achievability than the comps imply.
- What's the recent tenant-quality profile in this submarket — average credit score on applications, eviction rate, late-payment / NSF rate, and stable-employment percentage? A property-management company in the area should have these aggregated.
- How much new for-sale + rental construction is in the pipeline within 1–3 miles? Heavy new supply typically softens prices + rents 12–24 months out; constrained supply supports both.
Investment metrics
- 1% rule
- 1.06% ✓
- Cap rate
- 8.12%
- Cash-on-cash
- 6.52%
- DSCR
- 1.29
- GRM
- 7.9
CMA / ARV
- ARV (on-the-fly)
- $175,480
- Comps found
- 3
Show comp detail 3 sales within ~0.75 mi
| Address | Dist | Beds/Ba | Sqft | Sold | Price | $/sf | Match |
|---|---|---|---|---|---|---|---|
| 28 N 19th St | 0.25mi | 4/1.0 | 2,095 (-2%) | 1mo | $180,000 | $86 | 84 |
| 1228 Spruce St | 0.19mi | 3/1.0 (-1) | 1,949 (-9%) | 10mo | $159,000 | $82 | 63 |
| 1107 Arch St | 0.19mi | 5/1.5 (+1) | 2,236 (+4%) | 20mo | $125,000 | $56 | 60 |
Match score weights: distance 35% · size 25% · config 20% · recency 20%. Top-matched comps best support the ARV.
Projected returns pro-forma
10.0% appreciation · 3.0% rent growth · sell at horizon
- IRR
- 27.7%
- Equity multiple
- 3.20×
- Total profit
- $79,848
- Equity at exit
- $117,024
- IRR
- 24.2%
- Equity multiple
- 7.27×
- Total profit
- $228,121
- Equity at exit
- $252,367
Cash invested: $36,372 (down + closing). Projections, not guarantees.
Landlord ↔ Tenant lean methodology
- Overall (STATE)
- 62 Landlord-Friendly
- State Pennsylvania
- 62 Landlord-Friendly · EVEN
- County
- — inherits STATE
- City
- — inherits STATE
ZIP-level market 17921
- Home prices YoY
- 21.7%
- Active inventory
- 48
- Price-to-rent
- 7.9×
Monthly cashflow live
- Estimated rent
- $1,376 medium interval (Pro) →
- Mortgage (P&I)
- −$681
- Tax from tax record
- −$154 /mo · $1,849/yr
- Insurance
- −$54
- Flood insurance flood zone
- −$56 /mo · $666/yr
- HOA
- −$0
- Vacancy / Maint / Mgmt
- −$289
- Net cashflow
- $142
Break-even live
UW: 25.0% down · 7.5% · 30yr · 1.5% tax · 5.0% vac · 8.0% maint · 8.0% mgmt
Financing live
Cash to close
- Down payment
- $32,475
- Closing costs
- $3,897
- Reserves months
- —
- Total cash needed
- —
Loan-product check · same deal, 3 products live
Conventional
25% down · 7.5% · 30yr
- Down + closing
- —
- Monthly P&I
- —
- Monthly cashflow
- —
- DSCR
- —
- Eligible?
- —
Personal DTI + credit; lowest rate.
DSCR
20% down · 8.5% · 30yr
- Down + closing
- —
- Monthly P&I
- —
- Monthly cashflow
- —
- DSCR
- —
- Eligible?
- —
No personal income docs; deal must DSCR.
Hard money
10% down · 12.0% · 12mo
- Down + closing
- —
- Monthly P&I
- —
- Monthly cashflow
- —
- DSCR
- —
- Eligible?
- —
Short-term bridge; refi at stabilization.
Listing history 8 events
-
2026-06-19days on market $129,900 Active 9 DOM
-
2026-06-18days on market $129,900 Active 8 DOM
-
2026-06-17days on market $129,900 Active 7 DOM
-
2026-06-16days on market $129,900 Active 6 DOM
-
2026-06-15days on market $129,900 Active 5 DOM
-
2026-06-14days on market $129,900 Active 3 DOM
-
2026-06-12remarks 182-char remark
-
2026-06-12$129,900 Active 2 DOM
ⓘ Source: listings_history table (triggers on properties + properties_extension) + one-shot
backfill from property_details.listing_events for pre-trigger history.
Tax reassessment forecast PA · Partial reset (capped growth)
- Current annual tax
- $1,849 · $154/mo
- Projected year-2 tax
- $1,951 · $163/mo
- Expected delta
- +$102/yr (+$8/mo · 5.5%)
ⓘ Screening estimate from a state-policy table — verify with the county assessor before closing.
Climate risk First Street
- Flood 8/10 Severe FEMA zone X (unshaded) · 99% chance over 30 yrs
- Wildfire 3/10 Moderate
- Heat 4/10 Moderate 8 d/yr ≥95°F today · 17 d/yr by 30 yrs out
- Wind 3/10 Moderate 6% chance of damaging wind over 30 yrs
- Air quality 2/10 Low 1 unhealthy d/yr today · 2 by 30 yrs out
Nearby sold comps map
Loading sold comps map…
Walkable amenities ~0.75 mi
Loading nearby amenities…
Taxation est. · year 1
- Rental income
- $16,513
- − Mortgage interest
- −$7,276
- − Property taxes
- −$1,849
- − Insurance
- −$1,316
- − Repairs & maintenance
- −$1,321
- − Management
- −$1,321
- − Depreciation
- −$3,779
- Taxable loss
- −$350
- Est. tax savings @ 24.0%
- +$84
- After-tax cash flow
- $1,789/yr
For passive investors: Depreciation is non-cash, so a rental often shows a tax loss while cash-flowing — sheltering income. Rental losses are passive: they offset passive income freely, and up to $25,000/yr can offset ordinary (W-2) income if you actively participate and your MAGI is under $100k (phasing out to $0 by $150k); unused losses carry forward. On sale, claimed depreciation is recaptured at up to 25%, and gains may owe capital-gains tax (a 1031 exchange can defer both). Figures are a year-1 estimate at your 24.0% rate — not tax advice; consult a CPA.
Schools (NCES district)
- District
- North Schuylkill SD
- NCES district ID
- 4210110
- Math proficiency
- 19% ▼ -14.00%
- Reading proficiency
- 48% ▼ -8.00%
- Median HH income
- $43,529
- Composite
- 28.37/100
- National rank
- #6770
- State rank
- #429 of 539 in PA
Livability — Ashland
- Score
- 64/100
- State rank
- #1179
- US rank
- #13787
Category grades
Schools grade is shown separately in the Schools card above.
Census & demographics
- Census place
- Ashland, PA
- City population
- 208
- Population (ZIP)
- 7,029
Population outlook (Schuylkill County) Hauer SSP2
- Today (2025)
- 137,447 people
- By 2030
- 133,121 · -3.1%
- By 2040
- 124,172 · -9.7%
- By 2050
- 115,611 · -15.9%
- By 2075
- 100,796 · -26.7%
- By 2100
- 86,667 · -36.9%
Race, ethnicity, and origin ACS 2023
- Neighborhood character
- Predominantly White (83%)
- Race & ethnicity
- White 83% Black 10% Hispanic / Latino 4% Two or more races 3%
- Common ancestry
- Romanian 10% Iranian 4% Polish 3%
- Foreign-born
- 1% · Canada
- Languages at home
- 95% English-only · Spanish 4% Other Indo-European 1%
Political lean MEDSL · Schuylkill
- 2024 margin
- Solid R (+42.1) · D 28.5% · R 70.6%
- 2008→2024 swing
- -33.4pp toward R · 2008: -8.7pp · 2024: -42.1pp
- All cycles
- 2024: R+42.1 2020: R+39.9 2016: R+43.4 2012: R+13.4 2008: R+8.7
Not yet ingested
- Civics
- —
Market trends
- HPI YoY
- ▲ 62.11%
- Current HPI
- 347.8425
- Rent YoY
- —
- Metro
- —
- State GDP YoY
- ▲ 1.68%
- F500 in state
- 34
Industry mix (Fortune 500 HQ in PA)
| Industry | F500 HQs | Revenue |
|---|---|---|
| Healthcare | 2 | $309B |
|
||
| Insurance | 2 | $27B |
|
||
| Telecommunications / Media | 1 | $124B |
|
||
| Industrial Distribution | 1 | $22B |
|
||
| Financial Services | 1 | $20B |
|
||
| Chemicals / Materials | 1 | $18B |
|
||
Price history
+766.0% since first listed9 events — show timeline
- 2026-06-10 Listed $129,900 CSVBR
- 2025-02-04 Sold (MLS) $31,000 BRIGHT MLS
- 2024-11-26 Price Changed $32,250 BRIGHT MLS
- 2024-11-25 Price Changed $39,500 BRIGHT MLS
- 2024-11-22 Price Changed $44,900 BRIGHT MLS
- 2024-11-19 Listed $50,000 BRIGHT MLS
- 2016-01-22 Listing Removed — BRIGHT MLS
- 2013-11-15 Listed $22,000 BRIGHT MLS
- 1995-07-01 Sold (Public Records) $15,000 Public Records
Property tax history
+3.8%/yrLatest (2026): $1,849 · +14.2% YoY. Source: county tax records.
Cash-flow waterfall
monthlySold comps — $/sqft
last 12 mo · ≤1 miLoading sold comps…