 Multi-family
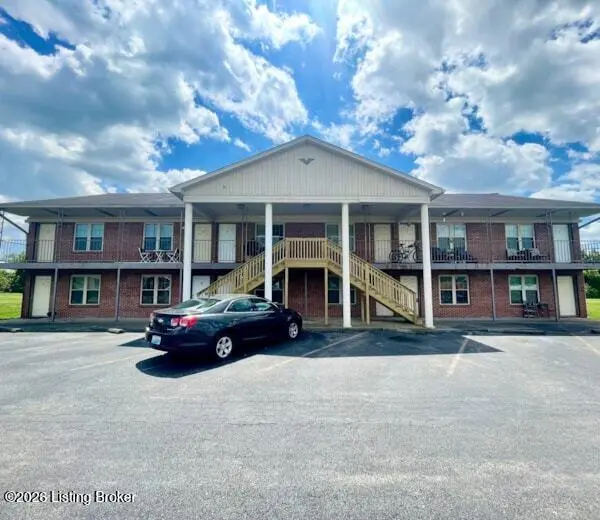
3414 Burkland Blvd · Hebron Estates, KY
Flood risk No data
- FEMA flood zone
- —
- Chance of flooding over 30 yrs
- —
- Est. flood insurance / yr
- —
Fire risk No data
- Est. fire insurance / yr
- —
Heat risk No data
- Hot days now (above threshold)
- —
- Hot days in 30 yrs
- —
Wind risk No data
- Chance of severe wind over 30 yrs
- —
Air-quality risk No data
- Unhealthy air days now
- —
- Unhealthy air days in 30 yrs
- —
Risk factors via First Street. Map © Google.
Why this score? — see what drove the B- grade
The composite is a weighted blend of 9 inputs, each scored 0–100. Each bar is that input's sub-score; the figure is the points it added to the 100-point composite (weight × sub-score).
- Cash flow +28.8/30.0
- DSCR +10.0/10.0
- 1% rule +8.0/10.0
- ARV discount +7.5/15.0
- Livability +3.2/5.0
- Schools +3.1/10.0
- Rent growth +2.5/5.0
- Condition / age +2.2/5.0
- Appreciation +0.0/10.0
$1,000,000
🖨 Deal sheet (PDF) 📄 Offer letter ✓ Due diligence
Multi-family units
County records classify this as Multi-Family (5+ Unit). Listing-text estimate: 1 unit. estimate disagrees with records
5+ unit building — per-unit beds/baths from public records are typically unavailable; the breakdown below (if shown) is an estimate from the listing text.
Listing remarks
Check out this cash-flowing 12-plex conveniently located just off I-65 in Shepherdsville. These updated 1-bedroom, 1-bathroom units are currently rented at market rates, making this a strong turnkey investment opportunity. One vacant unit is available for showings, while all occupied units may be viewed during the due diligence period following an accepted offer. Buyers are welcome to include a walk-through contingency with any submitted offer. The property is professionally managed, and rent rolls along with financials are available upon request. This is a great addition to any investment portfolio. Seller prefers to sell this property together with 430 Mt. Joy Ave.
Key facts
- 1.09 acre lot
- 12 parking spots
- Built 1993
Property features AI
Finance
- Other: Building area source listed as Other
- Financial info: Income/expense or investor cash-flow details not provided
- HOA & community: No association fee listed
Exterior
- Parking: 12 parking spaces (not covered)
- Utilities: Electricity connected; Tenant pays electric; Tenant pays water
- Home design: Apartment building; Total building area approximately 8,400
- Construction: Brick construction; Shingle roof; Built in 1993; Foundation information not provided
- Exterior features: No exterior features listed; Lot dimensions approximately 316 x 150; Located in the Burkland Gardens subdivision; Not in a flood plain
Interior
- Bedrooms: No bedrooms listed (property is an apartment building with units)
- Heating & cooling: Forced air heating; Central air conditioning; 12 furnaces
- Interior features: 12 separate meters; No basement
Neighborhood map
What this means for you Summary
Snapshot
- This is a multifamily listed at $1.00M. Condition is rated fair.
Deal economics
- At list price, monthly cash flow is $3k ($40k/yr) — positive.
- The deal already cash-flows at list — no discount required.
- Meets the 1% rule at list price ($13k rent vs $1.00M).
- Recommended offer: $985k (1.5% below list) — sets the bar for market timing.
Location & tenants
- Location reads 64/100 on livability (#290 in KY) — a middle-class / working-renter tenant base. Strengths: crime A+, cost of living A+, housing A+; Watch: employment D, amenities F, commute F.
- Bullitt County (suburban): math 29% / reading 41% proficiency, ranked #55 of 165 in KY (top 33%) — families likely to look elsewhere, expect single-tenant / working-renter base with shorter leases.
- Zoned schools: Freedom Elementary School (math 36% / reading 49%, grade F, #169 of 676 statewide, top 26%, 586 students, 45% FRL); Hebron Middle School (math 30% / reading 47%, grade F, #68 of 217 statewide, top 32%, 536 students, 52% FRL); North Bullitt High School (math 30% / reading 28%, grade F, #150 of 254 statewide, top 59%, 1,148 students, 50% FRL).
- Market conditions: 270 active listings in the ZIP; solid renter incomes; 380 units permitted in Bullitt County in 2024 (8 in 5+ unit buildings).
- At $13,019/mo this rent would consume 196% of the median local household income ($80k/yr) (locally 800% of renters already pay >50% of income on rent) — very limited rent-growth headroom before tenants either downsize or default.
Forward outlook
- Local home prices are declining (-3.0%/yr); year-one equity from $7k of loan paydown is wiped out by about $30k of value loss. Plan a longer hold.
- Bullitt County population projected at +22% by 2050 — long-run rental-demand tailwind backs the buy-and-hold thesis.
- At projected returns (-3.0% appreciation + 3.0% rent growth), your $280k cash investment doubles in ~9 years — after that, you're playing with house money.
Negotiation context
- It's been on market 23 days — a 2% lower offer ($985k) is reasonable based on typical stale-listing flexibility.
- 7 sale attempts since 3y ago with the ask held roughly flat each time — persistent listings suggest the price (not the market) is what's stuck; bring a comps-based counter.
Questions for the listing agent
- Have any recent inspections been done? Can we get a copy of the seller's disclosures and any deferred-maintenance estimates?
- Is there a deadline driving the sale (1031 exchange, divorce, estate, relocation)? That informs how much negotiation room exists.
- Schools are B-rated — typically a magnet for longer-tenancy family renters. What's the average tenant stay here, and is there a school-zone premium baked into asking?
- What's the average days-on-market for RENTAL listings here right now (not sales)? A rising rental-DOM trend means longer vacancies and softer asking-rent achievability than the comps imply.
- What's the recent tenant-quality profile in this submarket — average credit score on applications, eviction rate, late-payment / NSF rate, and stable-employment percentage? A property-management company in the area should have these aggregated.
- How much new apartment / multifamily construction is in the pipeline within 1–3 miles? Heavy new supply (>2% of stock underway) typically softens rents 12–24 months out; light construction supports rent growth.
Investment metrics
- 1% rule
- 1.30% ✓
- Cap rate
- 10.34%
- Cash-on-cash
- 14.46%
- DSCR
- 1.64
- GRM
- 6.4
CMA / ARV
No comps found within radius.
Projected returns pro-forma
-3.0% appreciation · 3.0% rent growth · sell at horizon
- IRR
- 4.9%
- Equity multiple
- 1.19×
- Total profit
- $53,060
- Equity at exit
- $149,103
- IRR
- 14.4%
- Equity multiple
- 2.16×
- Total profit
- $323,729
- Equity at exit
- $86,462
Cash invested: $280,000 (down + closing). Projections, not guarantees.
Landlord ↔ Tenant lean methodology
- Overall (STATE)
- 83 Strongly Landlord-Friendly
- State Kentucky
- 83 Strongly Landlord-Friendly · R+16
- County
- — inherits STATE
- City
- — inherits STATE
ZIP-level market 40165
- Home prices YoY
- -26.9%
- Active inventory
- 270
- Price-to-rent
- 76.8×
Monthly cashflow live
- Estimated rent
- $13,019 medium interval (Pro) →
- Mortgage (P&I)
- −$5,244
- Tax est. 1.5%
- −$1,250 /mo · $15,000/yr
- Insurance
- −$417
- HOA
- −$0
- Vacancy / Maint / Mgmt
- −$2,734
- Net cashflow
- $3,374
Break-even live
Sensitivity live
| Price | -10% $4,065 | -5% $3,720 | +0% $3,374 | +5% $3,029 | +10% $2,683 |
|---|---|---|---|---|---|
| Rent | -10% $2,346 | -5% $2,860 | +0% $3,374 | +5% $3,888 | +10% $4,403 |
| Rate | -1.0pp $3,878 | -0.5pp $3,629 | base $3,374 | +0.5pp $3,115 | +1.0pp $2,851 |
12-unit breakdown (identical units grouped — click to expand)
| Units | Beds | Baths | Est. rent |
|---|---|---|---|
| 12× units | 1 | 1 | $13,020 |
| #1 | 1 | 1 | $1,085 |
| #2 | 1 | 1 | $1,085 |
| #3 | 1 | 1 | $1,085 |
| #4 | 1 | 1 | $1,085 |
| #5 | 1 | 1 | $1,085 |
| #6 | 1 | 1 | $1,085 |
| #7 | 1 | 1 | $1,085 |
| #8 | 1 | 1 | $1,085 |
| #9 | 1 | 1 | $1,085 |
| #10 | 1 | 1 | $1,085 |
| #11 | 1 | 1 | $1,085 |
| #12 | 1 | 1 | $1,085 |
| Total (12 units) | $13,019 | ||
UW: 25.0% down · 7.5% · 30yr · 1.5% tax · 5.0% vac · 8.0% maint · 8.0% mgmt
Financing live
Cash to close
- Down payment
- $250,000
- Closing costs
- $30,000
- Reserves months
- —
- Total cash needed
- —
Loan-product check · same deal, 3 products live
Conventional
25% down · 7.5% · 30yr
- Down + closing
- —
- Monthly P&I
- —
- Monthly cashflow
- —
- DSCR
- —
- Eligible?
- —
Personal DTI + credit; lowest rate.
DSCR
20% down · 8.5% · 30yr
- Down + closing
- —
- Monthly P&I
- —
- Monthly cashflow
- —
- DSCR
- —
- Eligible?
- —
No personal income docs; deal must DSCR.
Hard money
10% down · 12.0% · 12mo
- Down + closing
- —
- Monthly P&I
- —
- Monthly cashflow
- —
- DSCR
- —
- Eligible?
- —
Short-term bridge; refi at stabilization.
Listing history 14 events
-
2026-06-21days on market $1,000,000 Active 23 DOM
-
2026-06-18days on market $1,000,000 Active 20 DOM
-
2026-06-17days on market $1,000,000 Active 19 DOM
-
2026-06-16days on market $1,000,000 Active 18 DOM
-
2026-06-15days on market $1,000,000 Active 17 DOM
-
2026-06-13days on market $1,000,000 Active 15 DOM
-
2026-06-10days on market $1,000,000 Active 12 DOM
-
2026-06-09days on market $1,000,000 Active 11 DOM
-
2026-06-08days on market $1,000,000 Active 10 DOM
-
2026-06-07days on market $1,000,000 Active 9 DOM
-
2026-06-03days on market $1,000,000 Active 5 DOM
-
2026-06-02days on market $1,000,000 Active 4 DOM
-
2026-06-01days on market $1,000,000 Active 3 DOM
-
2026-05-31days on market $1,000,000 Active 2 DOM
ⓘ Source: listings_history table (triggers on properties + properties_extension) + one-shot
backfill from property_details.listing_events for pre-trigger history.
Nearby sold comps map
Loading sold comps map…
Walkable amenities ~0.75 mi
Loading nearby amenities…
Taxation est. · year 1
- Rental income
- $156,228
- − Mortgage interest
- −$56,016
- − Property taxes
- −$15,000
- − Insurance
- −$5,000
- − Repairs & maintenance
- −$12,498
- − Management
- −$12,498
- − Depreciation
- −$29,091
- Taxable income
- $26,125
- Est. tax owed @ 24.0%
- −$6,270
- After-tax cash flow
- $34,221/yr
For passive investors: Depreciation is non-cash, so a rental often shows a tax loss while cash-flowing — sheltering income. Rental losses are passive: they offset passive income freely, and up to $25,000/yr can offset ordinary (W-2) income if you actively participate and your MAGI is under $100k (phasing out to $0 by $150k); unused losses carry forward. On sale, claimed depreciation is recaptured at up to 25%, and gains may owe capital-gains tax (a 1031 exchange can defer both). Figures are a year-1 estimate at your 24.0% rate — not tax advice; consult a CPA.
Condition & rehab AI · 5 photos
This 12-unit multi-family property presents as needing moderate renovations to improve its curb appeal and interior aesthetics, with potential for significant value increase through updates.
Repairs flagged
- Moderate Kitchen cabinets — Worn and dated appearance
- Moderate Appliances — Older models with visible wear
- Moderate Bathroom fixtures — Basic and dated design
Value-add opportunities
- Both Painting and updating kitchen cabinets — Enhances curb appeal and interior aesthetics
- Both Upgrading appliances — Improves functionality and appeal
- Both Updating bathroom fixtures — Enhances functionality and appeal
Renovation cost estimate screening
| Repair item | Severity | Est. cost |
|---|---|---|
| Kitchen cabinets · Worn and dated appearance | Moderate | $3,000–15,000 |
| Appliances · Older models with visible wear | Moderate | $3,000–15,000 |
| Bathroom fixtures · Basic and dated design | Moderate | $3,000–15,000 |
| Total estimated repair cost · 3 items | $9,000–45,000 |
Value-add ROI direction
- Both Painting and updating kitchen cabinets — Enhances curb appeal and interior aesthetics ↑
- Both Upgrading appliances — Improves functionality and appeal ↑
- Both Updating bathroom fixtures — Enhances functionality and appeal ↑
ⓘ Cost ranges are severity-bucket heuristics (US national rule-of-thumb). Get contractor quotes + a written scope before underwriting a rehab budget.
Schools (NCES district)
- District
- Bullitt County
- NCES district ID
- 2100750
- Math proficiency
- 29% ▼ -15.00%
- Reading proficiency
- 41% ▼ -14.00%
- Median HH income
- $55,009
- Composite
- 30.78/100
- National rank
- #6151
- State rank
- #55 of 165 in KY
Livability — Hebron Estates
- Score
- 64/100
- State rank
- #290
- US rank
- #13985
Category grades
Schools grade is shown separately in the Schools card above.
Census & demographics
- Census place
- Hebron Estates, KY
- County
- Bullitt County · 62,065 people
- Metro
- Louisville/Jefferson County, KY-IN
- Population (ZIP)
- 38,403
- Household income
- $79,540
- Rent vs Own
- Severe rent burden
- 800.0
Population outlook (Bullitt County) Hauer SSP2
- Today (2025)
- 89,555 people
- By 2030
- 94,389 · +5.4%
- By 2040
- 102,759 · +14.7%
- By 2050
- 108,955 · +21.7%
- By 2075
- 121,898 · +36.1%
- By 2100
- 126,383 · +41.1%
Race, ethnicity, and origin ACS 2023
- Neighborhood character
- Predominantly White (93%)
- Race & ethnicity
- White 93% Two or more races 3% Black 2% Hispanic / Latino 2%
- Common ancestry
- Italian 2% Iranian 2% Slovak 2%
- Foreign-born
- 2% · Canada
- Languages at home
- 98% English-only · Spanish 1%
Political lean MEDSL · Bullitt
- 2024 margin
- Solid R (+51.0) · D 23.8% · R 74.8% · Other 1.4%
- 2008→2024 swing
- -18.7pp toward R · 2008: -32.3pp · 2024: -51.0pp
- All cycles
- 2024: R+51.0 2020: R+48.0 2016: R+49.8 2012: R+35.7 2008: R+32.3
Not yet ingested
- Civics
- —
Market trends
- HPI YoY
- ▼ -90.91%
- Current HPI
- 247.1595
- Rent YoY
- —
- Metro
- Louisville/Jefferson County, KY-IN
- State GDP YoY
- ▲ 1.81%
- F500 in state
- 4
Industry mix (Fortune 500 HQ in KY)
| Industry | F500 HQs | Revenue |
|---|---|---|
| Healthcare | 1 | $118B |
|
||
| Food / Beverage | 1 | $7B |
|
||
Price history
+7.5% since first listed17 events — show timeline
- 2026-05-29 Listed $1,000,000 Metro Search MLS
- 2024-12-31 Listing Removed — Metro Search MLS
- 2024-09-11 Price Changed $875,000 Metro Search MLS
- 2024-08-19 Price Changed $900,000 Metro Search MLS
- 2024-08-06 Relisted — Metro Search MLS
- 2024-08-01 Contingent — Metro Search MLS
- 2024-07-31 Listed $930,000 Metro Search MLS
- 2024-07-23 Rental Removed $750 MSMLS
- 2024-07-17 Price Changed $750 MSMLS
- 2024-06-13 Price Changed $775 MSMLS
- 2024-06-12 Listed for Rent $895 MSMLS
- 2024-04-30 Rental Removed $750 MSMLS
- 2024-04-25 Listed for Rent $750 MSMLS
- 2024-03-20 Rental Removed $750 MSMLS
- 2024-02-22 Listed for Rent $750 MSMLS
- 2024-02-22 Rental Removed $725 MSMLS
- 2023-11-30 Listed for Rent $725 MSMLS
Cash-flow waterfall
monthlySold comps — $/sqft
last 12 mo · ≤1 miLoading sold comps…