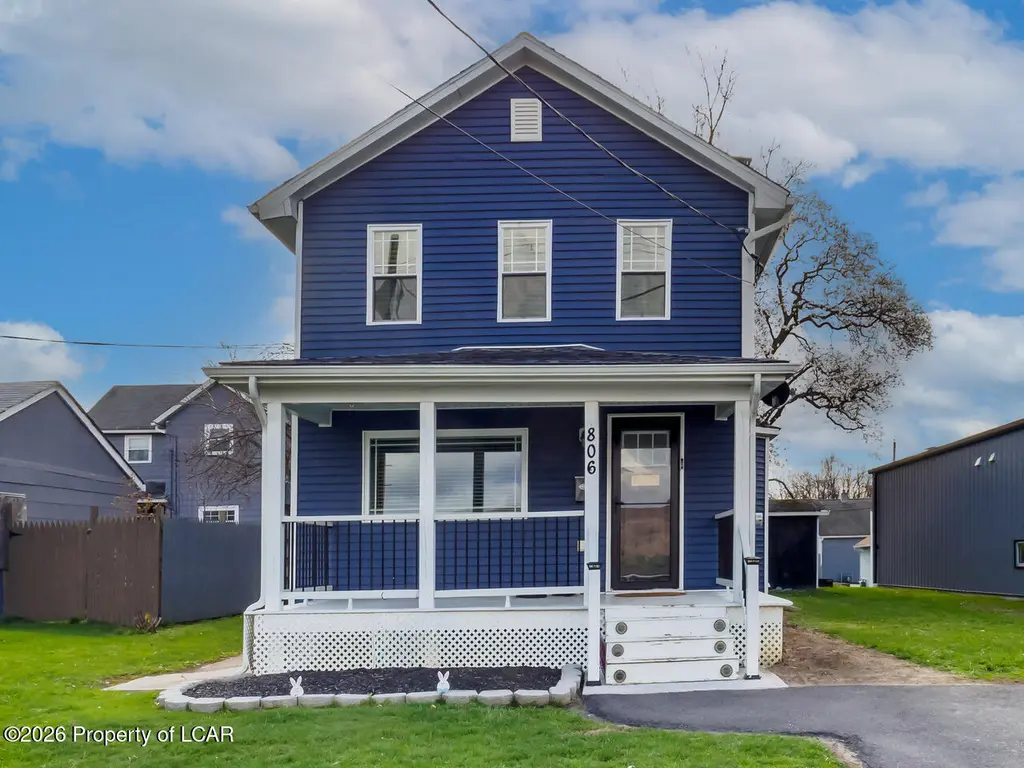
806 Foote Ave · Duryea, PA
Flood risk 1/10 · Minimal
- FEMA flood zone
- X (unshaded)
- Chance of flooding over 30 yrs
- 0.0%
- Est. flood insurance / yr
- $507 – $1,088
Fire risk 3/10 · Minor
- Est. fire insurance / yr
- $511 – $949
Heat risk 4/10 · Minor
- Hot days now (above 95°F)
- 7 days/yr
- Hot days in 30 yrs
- 16 days/yr
Wind risk 3/10 · Minor
- Chance of severe wind over 30 yrs
- 4.0%
Air-quality risk 2/10 · Minimal
- Unhealthy air days now
- 0 days/yr
- Unhealthy air days in 30 yrs
- 1 days/yr
Risk factors via First Street. Map © Google.
Why this score? — see what drove the F grade
The composite is a weighted blend of 9 inputs, each scored 0–100. Each bar is that input's sub-score; the figure is the points it added to the 100-point composite (weight × sub-score).
- Cash flow +9.6/30.0
- Livability +3.3/5.0
- Schools +3.0/10.0
- DSCR +2.7/10.0
- Rent growth +2.5/5.0
- Condition / age +2.5/5.0
- 1% rule +1.8/10.0
- ARV discount +0.3/15.0
- Appreciation +0.0/10.0
$235,000
🖨 Deal sheet (PDF) 📄 Offer letter ✓ Due diligence
Listing remarks MLS
Updated in 2019. Heating/central air, electric, water heater, plumbing, fixtures, windows, doors, drywall, siding, roof, gutters and downspouts. Kitchen features granite countertops and stainless-steel appliances. Open concept. Cathedral ceilings in bedrooms. newer carpeting, updated bathrooms, water resistant flooring on main floor. First floor laundry and office. Paved off-street parking in front. Rear alley access. Great sized lot 50x200', Baths: 1 Bath Lev 2,Modern, 1 Half Lev 1, Beds: 2+ Bed 2nd, SqFt Fin - Main: 676.00, SqFt Fin - 3rd: 0.00, Tax Information: Available, Dining Area: Y, SqFt Fin - 2nd: 650.00
Key facts
- Huge yard
- New hvac
- Forced-air gas heat
Tags
Neighborhood map
What this means for you Summary
Snapshot
- This is a 3-bed/1.5-bath single-family listed at $235k.
Deal economics
- At list price, monthly cash flow is $-158 ($-2k/yr) — negative.
- To cash-flow at today's rent, offer at most $207k (11.8% below list).
- To meet the 1% rule (rent ≥ 1% of price), the offer needs to be $161k (31.5% below list).
- Recommended offer: $161k (31.5% below list) — sets the bar for 1% rule.
Location & tenants
- Location reads 66/100 on livability (#1,029 in PA) — a middle-class / working-renter tenant base. Strengths: cost of living A+, crime A, housing B+; Watch: schools D+, amenities F, commute F.
- Pittston Area SD (suburban): math 30% / reading 40% proficiency, ranked #418 of 539 in PA (top 78%) — families likely to look elsewhere, expect single-tenant / working-renter base with shorter leases.
- Market conditions: 20 active listings in the ZIP; 10 comparable units currently listed for rent nearby; rentals at typical pace (median 14d on market — plan ~3-4 weeks tenant-placement turnaround); 349 units permitted in Luzerne County in 2024 (16 in 5+ unit buildings).
Forward outlook
- Local home prices are declining (-3.0%/yr); year-one equity from $2k of loan paydown is wiped out by about $7k of value loss. Plan a longer hold.
- Luzerne County population projected at +4% by 2050 — modest demand growth; plan on rents tracking national, not racing it.
Negotiation context
- Only 6 days on market — expect competitive offers; lowballing is unlikely to land.
- 2 sale attempts since 9y ago with the ask held roughly flat each time — persistent listings suggest the price (not the market) is what's stuck; bring a comps-based counter.
- Current owner paid $180k; 31% above their basis — modest negotiation headroom, anchor on the comps not their cost.
Risks & watch-outs
- Watch-outs: built in 1900 — expect roof / HVAC / electrical / plumbing capex.
Questions for the listing agent
- What do current leases actually rent for vs. the listed asking? Can we see a recent rent roll and the last 12 months of T-12 income?
- Built in 1900 — when were the roof, HVAC, electrical panel, plumbing, and water heater last replaced?
- Is there a deadline driving the sale (1031 exchange, divorce, estate, relocation)? That informs how much negotiation room exists.
- Schools are D-rated, which usually means shorter tenancies and higher turnover. Who's the typical renter profile here, and what's been the actual vacancy rate?
- The area grade is low — what's the realistic commute time and amenity access for the typical tenant pool here? Any planned neighborhood developments (good or bad) we should know about?
- What's the average days-on-market for RENTAL listings here right now (not sales)? A rising rental-DOM trend means longer vacancies and softer asking-rent achievability than the comps imply.
- What's the recent tenant-quality profile in this submarket — average credit score on applications, eviction rate, late-payment / NSF rate, and stable-employment percentage? A property-management company in the area should have these aggregated.
- How much new for-sale + rental construction is in the pipeline within 1–3 miles? Heavy new supply typically softens prices + rents 12–24 months out; constrained supply supports both.
Investment metrics
- 1% rule
- 0.68% ✗
- Cap rate
- 5.49%
- Cash-on-cash
- -2.87%
- DSCR
- 0.87
- GRM
- 12.2
CMA / ARV
- ARV (on-the-fly)
- $202,612
- Comps found
- 12
Show comp detail 12 sales within ~0.75 mi
| Address | Dist | Beds/Ba | Sqft | Sold | Price | $/sf | Match |
|---|---|---|---|---|---|---|---|
| 806 Foote Ave | 0.00mi | 3/1.5 | 1,506 (+10%) | 1mo | $238,350 | $158 | 83 |
| 600 Center St | 0.11mi | 3/1.5 | 1,550 (+13%) | 2mo | $365,000 | $235 | 71 |
| 534 Foote Ave | 0.33mi | 3/2.0 | 1,404 (+3%) | 11mo | $135,000 | $96 | 69 |
| 116 Broadhead St | 0.52mi | 4/2.0 (+1) | 1,400 (+2%) | 0mo | $204,750 | $146 | 65 |
| 116 Wright St | 0.69mi | 3/1.0 | 1,352 (-1%) | 4mo | $189,740 | $140 | 60 |
| 435 Foote Ave | 0.53mi | 3/2.0 | 1,485 (+8%) | 0mo | $222,500 | $150 | 59 |
| 921 Getty Ave | 0.27mi | 2/2.5 (-1) | 1,219 (-11%) | 4mo | $200,000 | $164 | 57 |
| 257 Main St | 0.64mi | 2/1.0 (-1) | 1,355 (-1%) | 7mo | $139,900 | $103 | 56 |
| 331 Drake St | 0.47mi | 3/2.0 | 1,227 (-10%) | 9mo | $188,000 | $153 | 51 |
| 322 Bridge St | 0.46mi | 3/1.0 | 1,529 (+12%) | 8mo | $116,000 | $76 | 50 |
| 1141 Main St | 0.62mi | 3/1.0 | 1,204 (-12%) | 5mo | $178,000 | $148 | 45 |
| 205 Lackawanna Ave | 0.63mi | 3/1.0 | 1,240 (-9%) | 10mo | $112,500 | $91 | 45 |
Match score weights: distance 35% · size 25% · config 20% · recency 20%. Top-matched comps best support the ARV.
Projected returns pro-forma
-3.0% appreciation · 3.0% rent growth · sell at horizon
- IRR
- -21.2%
- Equity multiple
- 0.27×
- Total profit
- $-48,216
- Equity at exit
- $35,039
- IRR
- -14.8%
- Equity multiple
- 0.16×
- Total profit
- $-55,302
- Equity at exit
- $20,319
Cash invested: $65,800 (down + closing). Projections, not guarantees.
Landlord ↔ Tenant lean methodology
- Overall (STATE)
- 62 Landlord-Friendly
- State Pennsylvania
- 62 Landlord-Friendly · EVEN
- County
- — inherits STATE
- City
- — inherits STATE
ZIP-level market 18642
- Home prices YoY
- -15.5%
- Active inventory
- 20
- Price-to-rent
- 12.2×
Monthly cashflow live
- Estimated rent
- $1,609 high interval (Pro) →
- Mortgage (P&I)
- −$1,232
- Tax from tax record
- −$99 /mo · $1,184/yr
- Insurance
- −$98
- HOA
- −$0
- Vacancy / Maint / Mgmt
- −$338
- Net cashflow
- $-158
Break-even live
Sensitivity live
| Price | -10% $-25 | -5% $-91 | +0% $-158 | +5% $-224 | +10% $-291 |
|---|---|---|---|---|---|
| Rent | -10% $-285 | -5% $-221 | +0% $-158 | +5% $-94 | +10% $-31 |
| Rate | -1.0pp $-39 | -0.5pp $-98 | base $-158 | +0.5pp $-219 | +1.0pp $-280 |
UW: 25.0% down · 7.5% · 30yr · 1.5% tax · 5.0% vac · 8.0% maint · 8.0% mgmt
Financing live
Cash to close
- Down payment
- $58,750
- Closing costs
- $7,050
- Reserves months
- —
- Total cash needed
- —
Loan-product check · same deal, 3 products live
Conventional
25% down · 7.5% · 30yr
- Down + closing
- —
- Monthly P&I
- —
- Monthly cashflow
- —
- DSCR
- —
- Eligible?
- —
Personal DTI + credit; lowest rate.
DSCR
20% down · 8.5% · 30yr
- Down + closing
- —
- Monthly P&I
- —
- Monthly cashflow
- —
- DSCR
- —
- Eligible?
- —
No personal income docs; deal must DSCR.
Hard money
10% down · 12.0% · 12mo
- Down + closing
- —
- Monthly P&I
- —
- Monthly cashflow
- —
- DSCR
- —
- Eligible?
- —
Short-term bridge; refi at stabilization.
Rent comps 10 comps
| Address | Beds | Baths | Sqft | Rent | $/sqft | DOM | Units | Dist |
|---|---|---|---|---|---|---|---|---|
| 230 Swetland St Duryea, PA | 2.0 | 1.0 | 950 | $1,400 | $1.47 | 14d | 1 | 0.42mi |
| 230 Swetland St Duryea, PA | 2.0 | 1.0 | 1092 | $1,400 | $1.28 | 21d | 1 | 0.42mi |
| 962 Wood St Unit 2 Old Forge, PA | 2.0 | 1.0 | 964 | $1,250 | $1.30 | 44d | 1 | 0.45mi |
| 127 Dickson St Duryea, PA | 2.0 | 1.0 | 900 | $1,200 | $1.33 | 44d | 1 | 0.60mi |
| 114 Dickson St Duryea, PA | 3.0 | 1.0 | 1836 | $1,600 | $0.87 | 14d | 1 | 0.63mi |
| 864 S Main St #3 Old Forge, PA | 2.0 | 1.0 | 965 | $1,350 | $1.40 | 14d | 1 | 0.90mi |
| 163 Bianca Way Old Forge, PA | 2.0 | 2.0 | 1194 | $2,500 | $2.09 | 14d | 1 | 0.92mi |
| 152 Drakes Ln Old Forge, PA | 2.0 | 1.0 | 979 | $1,700 | $1.74 | 14d | 1 | 0.93mi |
| 1418 Grove St Moosic, PA | 3.0 | 2.0 | 1820 | $1,850 | $1.02 | 14d | 1 | 0.93mi |
| 75 Marimar Dr Old Forge, PA | 2.0 | 2.0 | 1300 | $2,500 | $1.92 | 14d | 1 | 0.98mi |
Listing history 8 events
-
2026-04-16status Pending
-
2026-04-10$235,000 Active
-
2022-05-23soldstatus $180,000
-
2022-05-19soldstatus $180,000 620-char remark
Show marketing remark (620 chars)
Updated in 2019. Heating/central air, electric, water heater, plumbing, fixtures, windows, doors, drywall, siding, roof, gutters and downspouts. Kitchen features granite countertops and stainless-steel appliances. Open concept. Cathedral ceilings in bedrooms. newer carpeting, updated bathrooms, water resistant flooring on main floor. First floor laundry and office. Paved off-street parking in front. Rear alley access. Great sized lot 50x200', Baths: 1 Bath Lev 2,Modern, 1 Half Lev 1, Beds: 2+ Bed 2nd, SqFt Fin - Main: 676.00, SqFt Fin - 3rd: 0.00, Tax Information: Available, Dining Area: Y, SqFt Fin - 2nd: 650.00
-
2019-07-02soldstatus $125,080
-
2019-06-14soldstatus $125,080 471-char remark
Show marketing remark (471 chars)
New Roof, New Windows, New Siding, New Heating, New Electrical, New Flooring, New Plumbing. .. .. .. .. .. This great home is all New, Features Granite Counter Tops, 1st Floor Laundry, 1 and half bathrooms, bonus room on 1st floor. Off street parking with Large yard, rear access for additional parking. , Baths: 1 Bath Lev 2,1 Half Lev 1, Beds: 2+ Bed 2nd, SqFt Fin - Main: 676.00, SqFt Fin - 3rd: 0.00, Tax Information: Available, Dining Area: Y, SqFt Fin - 2nd: 650.00
-
2017-12-27soldstatus $20,000
-
2017-11-20$18,000
ⓘ Source: listings_history table (triggers on properties + properties_extension) + one-shot
backfill from property_details.listing_events for pre-trigger history.
Tax reassessment forecast PA · Partial reset (capped growth)
- Current annual tax
- $1,184 · $99/mo
- Projected year-2 tax
- $2,449 · $204/mo
- Expected delta
- +$1,264/yr (+$105/mo · 106.8%)
ⓘ Screening estimate from a state-policy table — verify with the county assessor before closing.
Climate risk First Street
- Flood 1/10 Low FEMA zone X (unshaded) · 0% chance over 30 yrs
- Wildfire 3/10 Moderate
- Heat 4/10 Moderate 7 d/yr ≥95°F today · 16 d/yr by 30 yrs out
- Wind 3/10 Moderate 4% chance of damaging wind over 30 yrs
- Air quality 2/10 Low 0 unhealthy d/yr today · 1 by 30 yrs out
Nearby sold comps map
Loading sold comps map…
Walkable amenities ~0.75 mi
Loading nearby amenities…
Taxation est. · year 1
- Rental income
- $19,311
- − Mortgage interest
- −$13,164
- − Property taxes
- −$1,184
- − Insurance
- −$1,175
- − Repairs & maintenance
- −$1,545
- − Management
- −$1,545
- − Depreciation
- −$6,836
- Taxable loss
- −$6,138
- Est. tax savings @ 24.0%
- +$1,473
- After-tax cash flow
- $-419/yr
For passive investors: Depreciation is non-cash, so a rental often shows a tax loss while cash-flowing — sheltering income. Rental losses are passive: they offset passive income freely, and up to $25,000/yr can offset ordinary (W-2) income if you actively participate and your MAGI is under $100k (phasing out to $0 by $150k); unused losses carry forward. On sale, claimed depreciation is recaptured at up to 25%, and gains may owe capital-gains tax (a 1031 exchange can defer both). Figures are a year-1 estimate at your 24.0% rate — not tax advice; consult a CPA.
Schools (NCES district)
- District
- Pittston Area SD
- NCES district ID
- 4219200
- Math proficiency
- 30% ▼ -12.00%
- Reading proficiency
- 40% ▼ -19.00%
- Median HH income
- $45,316
- Composite
- 29.86/100
- National rank
- #6409
- State rank
- #418 of 539 in PA
Livability — Duryea
- Score
- 66/100
- State rank
- #1029
- US rank
- #11458
Category grades
Schools grade is shown separately in the Schools card above.
Census & demographics
- Census place
- Duryea, PA
- City population
- 4,469
- Population (ZIP)
- 4,469
Population outlook (Luzerne County) Hauer SSP2
- Today (2025)
- 319,505 people
- By 2030
- 319,943 · +0.1%
- By 2040
- 322,643 · +1.0%
- By 2050
- 330,817 · +3.5%
- By 2075
- 379,145 · +18.7%
- By 2100
- 431,908 · +35.2%
Race, ethnicity, and origin ACS 2023
- Neighborhood character
- Predominantly White (78%)
- Race & ethnicity
- White 78% Hispanic / Latino 21% Two or more races 19%
- Hispanic origin (detail)
- Mexican 16% Puerto Rican 2%
- Common ancestry
- Romanian 20% Scotch-Irish 3% Iranian 2%
- Foreign-born
- 7% · Canada
- Languages at home
- 82% English-only · Spanish 16%
Political lean MEDSL · Luzerne
- 2024 margin
- R (+19.2) · D 40.0% · R 59.2%
- 2008→2024 swing
- -27.6pp toward R · 2008: 8.4pp · 2024: -19.2pp
- All cycles
- 2024: R+19.2 2020: R+14.4 2016: R+19.6 2012: D+4.8 2008: D+8.4
Not yet ingested
- Civics
- —
Market trends
- HPI YoY
- ▼ -34.99%
- Current HPI
- 190.5926
- Rent YoY
- —
- Metro
- —
- State GDP YoY
- ▲ 1.68%
- F500 in state
- 34
Industry mix (Fortune 500 HQ in PA)
| Industry | F500 HQs | Revenue |
|---|---|---|
| Healthcare | 2 | $309B |
|
||
| Insurance | 2 | $27B |
|
||
| Telecommunications / Media | 1 | $124B |
|
||
| Industrial Distribution | 1 | $22B |
|
||
| Financial Services | 1 | $20B |
|
||
| Chemicals / Materials | 1 | $18B |
|
||
Price history
+1205.6% since first listed8 events — show timeline
- 2026-04-16 Pending — LCAR
- 2026-04-10 Listed $235,000 LCAR
- 2022-05-23 Sold (Public Records) $180,000 Public Records
- 2022-05-19 Sold (MLS) $180,000 GSBR as distributed by MLS GRID
- 2019-07-02 Sold (Public Records) $125,080 Public Records
- 2019-06-14 Sold (MLS) $125,080 GSBR as distributed by MLS GRID
- 2017-12-27 Sold (MLS) $20,000 LCAR
- 2017-11-20 Listed $18,000 LCAR
Property tax history
+1.9%/yrLatest (2026): $1,184 · +0.4% YoY. Source: county tax records.
Cash-flow waterfall
monthlySold comps — $/sqft
last 12 mo · ≤1 miLoading sold comps…