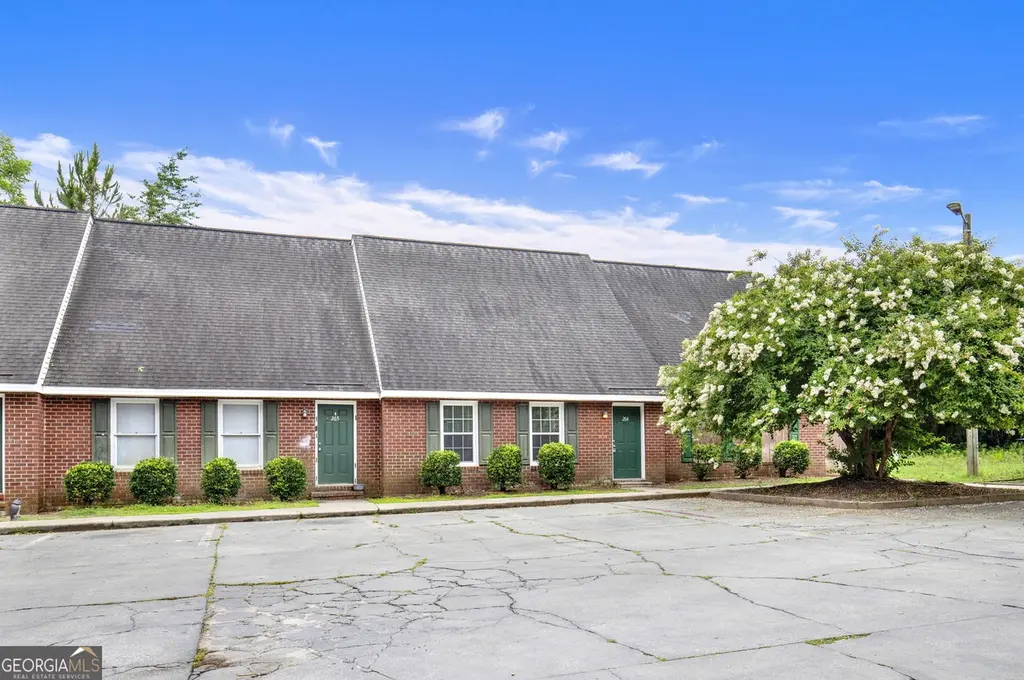
230 Lanier Dr #264 · Statesboro, GA
Flood risk 1/10 · Minimal
- FEMA flood zone
- X (unshaded)
- Chance of flooding over 30 yrs
- 0.0%
- Est. flood insurance / yr
- $507 – $1,088
Fire risk 4/10 · Minor
- Est. fire insurance / yr
- $963 – $1,789
Heat risk 9/10 · Severe
- Hot days now (above 110°F)
- 7 days/yr
- Hot days in 30 yrs
- 18 days/yr
Wind risk 8/10 · Major
- Chance of severe wind over 30 yrs
- 80.0%
Air-quality risk 2/10 · Minimal
- Unhealthy air days now
- 0 days/yr
- Unhealthy air days in 30 yrs
- 1 days/yr
Risk factors via First Street. Map © Google.
Why this score? — see what drove the C+ grade
The composite is a weighted blend of 9 inputs, each scored 0–100. Each bar is that input's sub-score; the figure is the points it added to the 100-point composite (weight × sub-score).
- Cash flow +25.8/30.0
- DSCR +8.7/10.0
- 1% rule +7.5/10.0
- ARV discount +7.4/15.0
- Livability +3.4/5.0
- Rent growth +2.9/5.0
- Schools +2.7/10.0
- Condition / age +2.2/5.0
- Appreciation +0.0/10.0
$95,000
🖨 Deal sheet 📄 Offer letter ✓ Due diligence
Listing remarks MLS
Please use ShowingTime to set up all appointments. Confirmed Appointments Only. Preferred Attorney: Liz Thompson - Rubnitz Thompson Ziblut
Key facts
- Galley-style kitchen
- Cozy breakfast area
- Wood grained floors
Tags
Property features AI
Finance
- Other: Subdivision: Park Place; Directions: From Veterans Memorial Pkwy/US-301 Bypass, turn onto Lanier Dr towards Langston Chapel Rd. Take an immediate left into Park Place and continue to the back of the community; townhouse unit is near the corner.
- HOA & community: Homeowners association with $50 monthly fee
Exterior
- Parking: Off-street parking
- Utilities: Public water; Public sewer; Cable available
- Home design: Attached townhouse; 2 stories total; 2+ common walls
- Construction: Brick construction; Slab foundation; Asphalt roof; Built as residential townhouse
- Exterior features: Interior lot; Street lights and sidewalks in the community; Asphalt/paved road access
Interior
- Kitchen: Dishwasher; Microwave; Oven; Range; Refrigerator; Electric water heater
- Bathrooms: 2 full bathrooms
- Heating & cooling: Central air (electric); Electric forced-air heating
- Interior features: Vaulted ceilings; Has a view
- Laundry & utility: Washer; Dryer; Laundry: Other
Neighborhood map
What this means for you Summary
Snapshot
- This is a 3-bed/2.0-bath townhouse listed at $95k. Condition is rated fair.
Deal economics
- At list price, monthly cash flow is $232 ($3k/yr) — positive.
- The deal already cash-flows at list — no discount required.
- Meets the 1% rule at list price ($1k rent vs $95k).
- Cap rate 9.2% vs local median 3.6% in Statesboro — top-decile yield for the area; either an underpriced asset or a hidden risk that comps aren't pricing in. Stress-test before assuming the spread holds.
Location & tenants
- Location reads 68/100 on livability (#151 in GA) — a middle-class / working-renter tenant base. Strengths: cost of living A+, health & safety A+, housing B+; Watch: amenities C-, crime D+, schools D-.
- Bulloch County (rural): math 32% / reading 33% proficiency, ranked #85 of 174 in GA (top 49%) — families likely to look elsewhere, expect single-tenant / working-renter base with shorter leases.
- Market conditions: Rents rising (+1.6%/yr); 335 active listings in the ZIP; 12 comparable units currently listed for rent nearby; rentals lingering (median 44d on market — plan ~5-8 weeks vacancy on turnover, expect pricing pressure); 100% of comp listings sitting > 30 days — soft ceiling on asking rent; 668 units permitted in Bulloch County in 2024 (6 in 5+ unit buildings).
Forward outlook
- Local home prices are declining (-3.0%/yr); year-one equity from $657 of loan paydown is wiped out by about $3k of value loss. Plan a longer hold.
- Bulloch County population projected at +18% by 2050 — long-run rental-demand tailwind backs the buy-and-hold thesis.
Negotiation context
- Only 3 days on market — expect competitive offers; lowballing is unlikely to land.
- 3 sale attempts since 7y ago with the ask held roughly flat each time — persistent listings suggest the price (not the market) is what's stuck; bring a comps-based counter.
- Current owner paid $43k; list at $95k implies a 121% gain — meaningful room to come down on a strong offer.
Risks & watch-outs
- Climate carrying-cost: severe wind risk, 80% chance of damaging wind over 30y; extreme-heat days projected 7→18/yr by 2055 (HVAC capex compounding) — expect insurance premiums to compound above CPI over the hold.
Questions for the listing agent
- Have any recent inspections been done? Can we get a copy of the seller's disclosures and any deferred-maintenance estimates?
- What does the HOA fee cover, when was the last increase, and are there any pending special assessments or reserve-fund shortfalls?
- Is there a deadline driving the sale (1031 exchange, divorce, estate, relocation)? That informs how much negotiation room exists.
- Schools are D-rated, which usually means shorter tenancies and higher turnover. Who's the typical renter profile here, and what's been the actual vacancy rate?
- Crime grade is D in this area — have there been break-ins, vandalism, or insurance claims at this property in the last 3 years? What carrier currently insures it and at what premium?
- What's the average days-on-market for RENTAL listings here right now (not sales)? A rising rental-DOM trend means longer vacancies and softer asking-rent achievability than the comps imply.
- What's the recent tenant-quality profile in this submarket — average credit score on applications, eviction rate, late-payment / NSF rate, and stable-employment percentage? A property-management company in the area should have these aggregated.
- How much new for-sale + rental construction is in the pipeline within 1–3 miles? Heavy new supply typically softens prices + rents 12–24 months out; constrained supply supports both.
Investment metrics
- 1% rule
- 1.25% ✓
- Cap rate
- 9.22%
- Cash-on-cash
- 10.45%
- DSCR
- 1.47
- GRM
- 6.7
CMA / ARV
- ARV (on-the-fly)
- $94,875
- Comps found
- 12
Show comp detail 12 sales within ~0.75 mi
| Address | Dist | Beds/Ba | Sqft | Sold | Price | $/sf | Match |
|---|---|---|---|---|---|---|---|
| 230 Lanier Dr #159 | 0.10mi | 2/2.0 (-1) | 825 (0%) | 4mo | $80,000 | $97 | 87 |
| 230 Lanier Dr #122 | 0.10mi | 2/2.0 (-1) | 825 (0%) | 9mo | $75,000 | $91 | 83 |
| 230 Lanier Dr #215 | 0.05mi | 2/2.0 (-1) | 825 (0%) | 15mo | $75,000 | $91 | 80 |
| 230 Lanier Dr #148 | 0.10mi | 2/2.0 (-1) | 825 (0%) | 16mo | $70,000 | $85 | 77 |
| 222 Lanier Dr #223 | 0.24mi | 2/2.0 (-1) | 880 (+7%) | 4mo | $95,000 | $108 | 69 |
| 222 Lanier Dr #203 | 0.24mi | 2/2.0 (-1) | 880 (+7%) | 4mo | $95,000 | $108 | 69 |
| 140 Lanier Dr #55 | 0.50mi | 2/1.0 (-1) | 825 (0%) | 1mo | $95,200 | $115 | 66 |
| 140 Lanier Dr #30 | 0.50mi | 2/1.0 (-1) | 825 (0%) | 2mo | $95,000 | $115 | 66 |
| 140 Lanier Dr #41 | 0.50mi | 2/1.0 (-1) | 825 (0%) | 2mo | $95,000 | $115 | 66 |
| 140 Lanier Dr #52 | 0.50mi | 2/1.0 (-1) | 825 (0%) | 10mo | $96,000 | $116 | 59 |
| 140 Lanier Dr #32 | 0.50mi | 2/1.0 (-1) | 825 (0%) | 12mo | $97,000 | $118 | 58 |
| 140 Lanier Dr #15 | 0.50mi | 2/1.0 (-1) | 825 (0%) | 12mo | $96,250 | $117 | 57 |
Match score weights: distance 35% · size 25% · config 20% · recency 20%. Top-matched comps best support the ARV.
Projected returns pro-forma
-3.0% appreciation · 1.62% rent growth · sell at horizon
- IRR
- -2.2%
- Equity multiple
- 0.92×
- Total profit
- $-2,216
- Equity at exit
- $14,165
- IRR
- 5.8%
- Equity multiple
- 1.41×
- Total profit
- $10,777
- Equity at exit
- $8,214
Cash invested: $26,600 (down + closing). Projections, not guarantees.
Landlord ↔ Tenant lean methodology
- Overall (STATE)
- 90 Strongly Landlord-Friendly
- State Georgia
- 90 Strongly Landlord-Friendly · R+3
- County
- — inherits STATE
- City
- — inherits STATE
ZIP-level market 30458
- Home prices YoY
- -32.1%
- Rents YoY
- 1.6%
- Active inventory
- 335
- Price-to-rent
- 6.7×
Monthly cashflow live
- Estimated rent
- $1,188 high interval (Pro) →
- Mortgage (P&I)
- −$498
- Tax est. 1.5%
- −$119 /mo · $1,425/yr
- Insurance
- −$40
- HOA
- −$50
- Vacancy / Maint / Mgmt
- −$249
- Net cashflow
- $232
Break-even live
UW: 25.0% down · 7.5% · 30yr · 1.5% tax · 5.0% vac · 8.0% maint · 8.0% mgmt
Financing live
Cash to close
- Down payment
- $23,750
- Closing costs
- $2,850
- Reserves months
- —
- Total cash needed
- —
Loan-product check · same deal, 3 products live
Conventional
25% down · 7.5% · 30yr
- Down + closing
- —
- Monthly P&I
- —
- Monthly cashflow
- —
- DSCR
- —
- Eligible?
- —
Personal DTI + credit; lowest rate.
DSCR
20% down · 8.5% · 30yr
- Down + closing
- —
- Monthly P&I
- —
- Monthly cashflow
- —
- DSCR
- —
- Eligible?
- —
No personal income docs; deal must DSCR.
Hard money
10% down · 12.0% · 12mo
- Down + closing
- —
- Monthly P&I
- —
- Monthly cashflow
- —
- DSCR
- —
- Eligible?
- —
Short-term bridge; refi at stabilization.
Rent comps 12 comps
| Address | Beds | Baths | Sqft | Rent | $/sqft | DOM | Units | Dist |
|---|---|---|---|---|---|---|---|---|
| 230 Lanier Dr #74 Statesboro, GA | 2.0 | 2.0 | 997 | $950 | $0.95 | 43d | 1 | 0.08mi |
| 230 Lanier Dr Unit 221 Statesboro, GA | 2.0 | 2.0 | 850 | $925 | $1.09 | 43d | 1 | 0.08mi |
| 140 Lanier Dr Unit 141 Statesboro, GA | 2.0 | 1.0 | 825 | $950 | $1.15 | 43d | 1 | 0.52mi |
| 140 Lanier Dr #91 Statesboro, GA | 2.0 | 1.0 | 850 | $925 | $1.09 | 43d | 1 | 0.52mi |
| 1150 Brampton Ave Statesboro, GA | 2.0–3.0 | 2.0–3.0 | 1025 | $1,900 | $1.85 | 43d | 11 | 0.58mi |
| 819 Robin Hood Trl Statesboro, GA | 2.0 | 2.0 | 860 | $1,134 | $1.32 | 43d | 8 | 0.64mi |
| 2000 Stambuk Ln Statesboro, GA | 1.0–4.0 | 1.0–4.0 | 1030 | $1,268 | $1.23 | 43d | 26 | 0.70mi |
| 1801 Chandler Rd Unit 57 Statesboro, GA | 2.0 | 1.0 | 750 | $900 | $1.20 | 43d | 1 | 0.79mi |
| 17931 Highway 67 Statesboro, GA | 3.0 | 1.0–3.0 | 775 | $1,245 | $1.61 | 43d | 2 | 0.89mi |
| 251 Knight Dr #7 Statesboro, GA | 2.0 | 1.5 | 1050 | $1,050 | $1.00 | 43d | 1 | 0.91mi |
| 20 University Pl Statesboro, GA | 3.0 | 2.0 | 1120 | $1,500 | $1.34 | 43d | 1 | 0.92mi |
| 100 Lanier Dr #17 Statesboro, GA | 2.0 | 1.0 | 750 | $900 | $1.20 | 43d | 1 | 1.06mi |
HOA detail
- Monthly dues
- $50 · $600/yr
Listing history 4 events
-
2026-06-09status $95,000 Pending 3 DOM
-
2026-06-08days on market $95,000 Active 3 DOM
-
2026-06-07remarks 688-char remark
-
2026-06-07$95,000 Active 2 DOM
ⓘ Source: listings_history table (triggers on properties + properties_extension) + one-shot
backfill from property_details.listing_events for pre-trigger history.
Climate risk First Street
- Flood 1/10 Low FEMA zone X (unshaded) · 0% chance over 30 yrs
- Wildfire 4/10 Moderate
- Heat 9/10 Extreme 7 d/yr ≥110°F today · 18 d/yr by 30 yrs out
- Wind 8/10 Severe 80% chance of damaging wind over 30 yrs
- Air quality 2/10 Low 0 unhealthy d/yr today · 1 by 30 yrs out
Nearby sold comps map
Loading sold comps map…
Walkable amenities ~0.75 mi
Loading nearby amenities…
Taxation est. · year 1
- Rental income
- $14,251
- − Mortgage interest
- −$5,321
- − Property taxes
- −$1,425
- − Insurance
- −$475
- − Repairs & maintenance
- −$1,140
- − Management
- −$1,140
- − HOA
- −$600
- − Depreciation
- −$2,764
- Taxable income
- $1,386
- Est. tax owed @ 24.0%
- −$333
- After-tax cash flow
- $2,448/yr
For passive investors: Depreciation is non-cash, so a rental often shows a tax loss while cash-flowing — sheltering income. Rental losses are passive: they offset passive income freely, and up to $25,000/yr can offset ordinary (W-2) income if you actively participate and your MAGI is under $100k (phasing out to $0 by $150k); unused losses carry forward. On sale, claimed depreciation is recaptured at up to 25%, and gains may owe capital-gains tax (a 1031 exchange can defer both). Figures are a year-1 estimate at your 24.0% rate — not tax advice; consult a CPA.
Condition & rehab AI · 12 photos
This townhouse is in fair condition with some moderate repairs needed, particularly on the staircase. It has a good layout and is close to campus, making it a solid investment opportunity.
Repairs flagged
- Minor Staircase — Some wear and tear visible on the carpeted stairs.
Value-add opportunities
- Resale Paint exterior — Fresh paint can enhance curb appeal and property value.
- Both Replace carpeted stairs — New carpet can improve both the appearance and functionality of the home.
Renovation cost estimate screening
| Repair item | Severity | Est. cost |
|---|---|---|
| Staircase · Some wear and tear visible on the carpeted stairs. | Minor | $500–3,000 |
| Total estimated repair cost · 1 items | $500–3,000 |
Value-add ROI direction
- Resale Paint exterior — Fresh paint can enhance curb appeal and property value. ↑
- Both Replace carpeted stairs — New carpet can improve both the appearance and functionality of the home. ↑
ⓘ Cost ranges are severity-bucket heuristics (US national rule-of-thumb). Get contractor quotes + a written scope before underwriting a rehab budget.
Schools (NCES district)
- District
- Bulloch County
- NCES district ID
- 1300630
- Math proficiency
- 32% ▼ -11.00%
- Reading proficiency
- 33% ▼ -8.00%
- Median HH income
- $36,335
- Composite
- 26.97/100
- National rank
- #7074
- State rank
- #85 of 174 in GA
Livability — Statesboro
- Score
- 68/100
- State rank
- #151
- US rank
- #9809
Category grades
Schools grade is shown separately in the Schools card above.
Census & demographics
- Census place
- Statesboro, GA
- County
- Bulloch County · 73,507 people
- City population
- 67,164
- Metro
- Statesboro, GA
- Population (ZIP)
- 49,717
- Household income
- $52,038
- Rent vs Own
- Severe rent burden
- 3020.0
Population outlook (Bulloch County) Hauer SSP2
- Today (2025)
- 79,935 people
- By 2030
- 83,796 · +4.8%
- By 2040
- 89,717 · +12.2%
- By 2050
- 94,558 · +18.3%
- By 2075
- 104,376 · +30.6%
- By 2100
- 112,857 · +41.2%
Race, ethnicity, and origin ACS 2023
- Neighborhood character
- Diverse neighborhood (Simpson 0.58)
- Race & ethnicity
- White 53% Black 36% Two or more races 6% Hispanic / Latino 5% Asian 2%
- Hispanic origin (detail)
- Mexican 2% Puerto Rican 1%
- Common ancestry
- Italian 2% Slovak 1% Romanian 1%
- Foreign-born
- 4% · Canada
- Languages at home
- 94% English-only · Spanish 3%
Political lean MEDSL · Bulloch
- 2024 margin
- Strong R (+29.0) · D 35.3% · R 64.3%
- 2008→2024 swing
- -9.8pp toward R · 2008: -19.2pp · 2024: -29.0pp
- All cycles
- 2024: R+29.0 2020: R+23.7 2016: R+23.4 2012: R+19.1 2008: R+19.2
Not yet ingested
- Civics
- —
Market trends
- HPI YoY
- ▼ -95.47%
- Current HPI
- 201.6684
- Rent YoY
- ▲ 1.62%
- Metro
- Statesboro, GA
- State GDP YoY
- ▲ 2.66%
- F500 in state
- 28
Industry mix (Fortune 500 HQ in GA)
| Industry | F500 HQs | Revenue |
|---|---|---|
| Paper / Packaging | 2 | $29B |
|
||
| Retail | 1 | $160B |
|
||
| Transportation / Logistics | 1 | $91B |
|
||
| Airlines | 1 | $62B |
|
||
| Consumer Goods | 1 | $47B |
|
||
| Utilities | 1 | $25B |
|
||
Price history
+108.8% since first listed4 events — show timeline
- 2026-06-05 Listed $95,000 Hive MLS
- 2026-06-05 Listed $95,000 GAMLS
- 2019-03-22 Sold (MLS) $43,000 GAMLS
- 2019-02-03 Listed $45,500 GAMLS
Cash-flow waterfall
monthlySold comps — $/sqft
last 12 mo · ≤1 miLoading sold comps…