 🏗️ New Construction
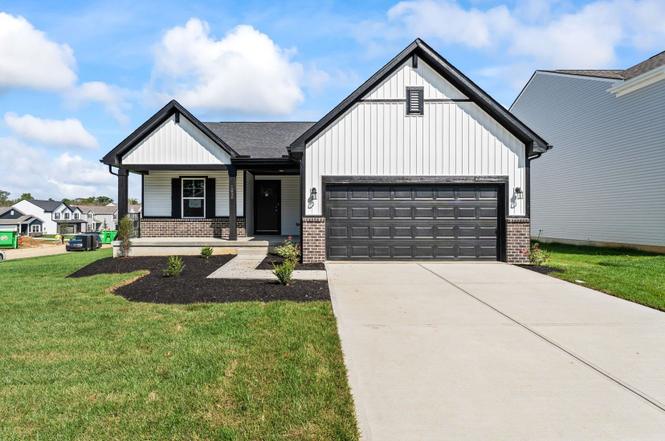
Bradford Plan · Louisville/Jefferson County metro government (balance), KY
Flood risk 1/10 · Minimal
- FEMA flood zone
- X (unshaded)
- Chance of flooding over 30 yrs
- 0.0%
- Est. flood insurance / yr
- $507 – $1,088
Fire risk 4/10 · Minor
- Est. fire insurance / yr
- $839 – $1,559
Heat risk 4/10 · Minor
- Hot days now (above 103°F)
- 7 days/yr
- Hot days in 30 yrs
- 20 days/yr
Wind risk 2/10 · Minimal
- Chance of severe wind over 30 yrs
- 2.0%
Air-quality risk 2/10 · Minimal
- Unhealthy air days now
- 1 days/yr
- Unhealthy air days in 30 yrs
- 3 days/yr
Risk factors via First Street. Map © Google.
Why this score? — see what drove the D- grade
The composite is a weighted blend of 9 inputs, each scored 0–100. Each bar is that input's sub-score; the figure is the points it added to the 100-point composite (weight × sub-score).
- Cash flow +11.9/30.0
- ARV discount +7.5/15.0
- DSCR +3.5/10.0
- 1% rule +3.4/10.0
- Rent growth +2.5/5.0
- Livability +2.5/5.0
- Condition / age +2.5/5.0
- Schools +2.3/10.0
- Appreciation +0.0/10.0
$317,990
🖨 Deal sheet (PDF) 📄 Offer letter ✓ Due diligence
Listing remarks
The Bradford is the perfect ranch-style floorplan for those looking to downsize or enjoy single-level living with plenty of space. Starting at 1,611 square feet, this three-bedroom, two-bath home can be personalized to fit your lifestyle - with an optional second-floor bonus room for even more living space. Step inside from the charming front porch and you're greeted by a versatile flex room. Use it as a dining area, home office, or creative space - the choice is yours. The L-shaped kitchen offers ample cabinet storage and counter space, with the option to add an island for extra prep area. The open layout connects seamlessly to the great room, perfect for entertaining or spending time with
Key facts
- L-shaped kitchen
- Ranch floorplan
- Flex room
Tags
Property features AI
Finance
- Other: Inventory type: Plan (new construction)
- Financial info: List price $317,990
Exterior
- Utilities: Has heating; Has cooling
- Home design: Located in Fisherville, KY (Bradford Plan address)
- Exterior features: Living area approximately 1,613
Interior
- Bedrooms: 3 bedrooms
- Bathrooms: 2 full bathrooms
- Heating & cooling: Heat pump heating; Central air conditioning
- Interior features: Plan: Bradford (new construction plan)
Neighborhood map
What this means for you Summary
Snapshot
- This is a 3-bed/2.0-bath single-family listed at $318k.
Deal economics
- At list price, monthly cash flow is $-94 ($-1k/yr) — negative.
- The deal already cash-flows at list — no discount required.
- To meet the 1% rule (rent ≥ 1% of price), the offer needs to be $300k (5.7% below list).
- Recommended offer: $280k (12.0% below list) — sets the bar for market timing.
- Cap rate 6.0% vs local median 4.0% in Louisville/Jefferson County metro government (balance) — top-decile yield for the area; either an underpriced asset or a hidden risk that comps aren't pricing in. Stress-test before assuming the spread holds.
Location & tenants
- Location reads: area grade D — affects rentability + tenant quality, not the cash-flow math above.
- Jefferson County (urban): math 19% / reading 35% proficiency, ranked #121 of 165 in KY (top 73%) — low school quality limits family demand, transient renter base, plan for 1-2y turnover.
- Zoned schools: Tully Elementary (math 35% / reading 49%, grade F, #178 of 676 statewide, top 29%, 788 students, 38% FRL); Crosby Middle (math 32% / reading 49%, grade F, #57 of 217 statewide, top 26%, 1,016 students, 46% FRL); Eastern High (math 44% / reading 45%, grade F, #21 of 254 statewide, top 10%, 2,036 students, 37% FRL) — zoned schools average 40% FRL vs 56% district-wide (16 pts lower); this property's tenant base skews higher-income than the district average.
- Zoned-school proficiency averages 42% at this address vs 27% district-wide (+15 pts) — the actual schools serving this property are materially stronger than the Jefferson County average implies; a family-tenant draw the district grade alone would hide.
- Market conditions: 157 active listings in the ZIP; 1 comparable units currently listed for rent nearby; 2,836 units permitted in Jefferson County in 2024 (1,558 in 5+ unit buildings).
Forward outlook
- Local home prices are declining (-3.0%/yr); year-one equity from $2k of loan paydown is wiped out by about $11k of value loss. Plan a longer hold.
- Jefferson County population projected at +13% by 2050 — modest demand growth; plan on rents tracking national, not racing it.
Negotiation context
- It's been on market 522 days — a 12% lower offer ($280k) is reasonable based on typical stale-listing flexibility.
Questions for the listing agent
- What do current leases actually rent for vs. the listed asking? Can we see a recent rent roll and the last 12 months of T-12 income?
- It's been on market 522 days. Have you received any prior offers? Is the seller open to a 12% concession, seller financing, or rate buy-down credit?
- Why hasn't it sold? Are there any deal-killer items the seller is aware of (foundation, flood, title, zoning, code violations)?
- Is there a deadline driving the sale (1031 exchange, divorce, estate, relocation)? That informs how much negotiation room exists.
- The area grade is low — what's the realistic commute time and amenity access for the typical tenant pool here? Any planned neighborhood developments (good or bad) we should know about?
- What's the average days-on-market for RENTAL listings here right now (not sales)? A rising rental-DOM trend means longer vacancies and softer asking-rent achievability than the comps imply.
- What's the recent tenant-quality profile in this submarket — average credit score on applications, eviction rate, late-payment / NSF rate, and stable-employment percentage? A property-management company in the area should have these aggregated.
- How much new for-sale + rental construction is in the pipeline within 1–3 miles? Heavy new supply typically softens prices + rents 12–24 months out; constrained supply supports both.
Investment metrics
- 1% rule
- 0.84% ✗
- Cap rate
- 5.98%
- Cash-on-cash
- -1.12%
- DSCR
- 0.95
- GRM
- 9.9
CMA / ARV
- ARV (on-the-fly)
- $356,473
- Comps found
- 1
Show comp detail 1 sale within ~0.75 mi
| Address | Dist | Beds/Ba | Sqft | Sold | Price | $/sf | Match |
|---|---|---|---|---|---|---|---|
| 2212 Clark Station Rd | 0.46mi | 2/2.0 (-1) | 1,506 (-7%) | 10mo | $332,583 | $221 | 54 |
Match score weights: distance 35% · size 25% · config 20% · recency 20%. Top-matched comps best support the ARV.
Projected returns pro-forma
-3.0% appreciation · 3.0% rent growth · sell at horizon
- IRR
- -18.1%
- Equity multiple
- 0.36×
- Total profit
- $-63,674
- Equity at exit
- $53,151
- IRR
- -10.4%
- Equity multiple
- 0.37×
- Total profit
- $-62,931
- Equity at exit
- $30,821
Cash invested: $99,812 (down + closing). Projections, not guarantees.
Landlord ↔ Tenant lean methodology
- Overall (STATE)
- 83 Strongly Landlord-Friendly
- State Kentucky
- 83 Strongly Landlord-Friendly · R+16
- County
- — inherits STATE
- City
- — inherits STATE
ZIP-level market 40023
- Home prices YoY
- -17.5%
- Active inventory
- 157
- Price-to-rent
- 8.8×
Monthly cashflow live
- Estimated rent
- $3,000 medium interval (Pro) →
- Mortgage (P&I)
- −$1,869
- Tax est. 1.5%
- −$446 /mo · $5,347/yr
- Insurance
- −$149
- HOA
- −$0
- Vacancy / Maint / Mgmt
- −$630
- Net cashflow
- $-94
Break-even live
Sensitivity live
| Price | -10% $153 | -5% $30 | +0% $-94 | +5% $-217 | +10% $-340 |
|---|---|---|---|---|---|
| Rent | -10% $-331 | -5% $-212 | +0% $-94 | +5% $25 | +10% $143 |
| Rate | -1.0pp $86 | -0.5pp $-3 | base $-94 | +0.5pp $-186 | +1.0pp $-280 |
UW: 25.0% down · 7.5% · 30yr · 1.5% tax · 5.0% vac · 8.0% maint · 8.0% mgmt
Financing live
Cash to close
- Down payment
- $89,118
- Closing costs
- $10,694
- Reserves months
- —
- Total cash needed
- —
Loan-product check · same deal, 3 products live
Conventional
25% down · 7.5% · 30yr
- Down + closing
- —
- Monthly P&I
- —
- Monthly cashflow
- —
- DSCR
- —
- Eligible?
- —
Personal DTI + credit; lowest rate.
DSCR
20% down · 8.5% · 30yr
- Down + closing
- —
- Monthly P&I
- —
- Monthly cashflow
- —
- DSCR
- —
- Eligible?
- —
No personal income docs; deal must DSCR.
Hard money
10% down · 12.0% · 12mo
- Down + closing
- —
- Monthly P&I
- —
- Monthly cashflow
- —
- DSCR
- —
- Eligible?
- —
Short-term bridge; refi at stabilization.
Rent comps 1 comps
| Address | Beds | Baths | Sqft | Rent | $/sqft | DOM | Units | Dist |
|---|---|---|---|---|---|---|---|---|
| 3222 Catalpa Farms Dr Fisherville, KY | 3.0 | 2.5 | 2004 | $3,000 | $1.50 | 25d | 1 | 0.29mi |
Listing history 14 events
-
2026-06-21days on market $317,990 Active 522 DOM
-
2026-06-18days on market $317,990 Active 519 DOM
-
2026-06-17days on market $317,990 Active 518 DOM
-
2026-06-16days on market $317,990 Active 517 DOM
-
2026-06-15days on market $317,990 Active 516 DOM
-
2026-06-13days on market $317,990 Active 514 DOM
-
2026-06-10days on market $317,990 Active 511 DOM
-
2026-06-09days on market $317,990 Active 510 DOM
-
2026-06-08days on market $317,990 Active 509 DOM
-
2026-06-07days on market $317,990 Active 508 DOM
-
2026-06-03days on market $317,990 Active 504 DOM
-
2026-06-02days on market $317,990 Active 503 DOM
-
2026-06-01days on market $317,990 Active 502 DOM
-
2026-05-31days on market $317,990 Active 501 DOM
ⓘ Source: listings_history table (triggers on properties + properties_extension) + one-shot
backfill from property_details.listing_events for pre-trigger history.
Climate risk First Street
- Flood 1/10 Low FEMA zone X (unshaded) · 0% chance over 30 yrs
- Wildfire 4/10 Moderate
- Heat 4/10 Moderate 7 d/yr ≥103°F today · 20 d/yr by 30 yrs out
- Wind 2/10 Low 2% chance of damaging wind over 30 yrs
- Air quality 2/10 Low 1 unhealthy d/yr today · 3 by 30 yrs out
Nearby sold comps map
Loading sold comps map…
Walkable amenities ~0.75 mi
Loading nearby amenities…
Taxation est. · year 1
- Rental income
- $36,000
- − Mortgage interest
- −$19,968
- − Property taxes
- −$5,347
- − Insurance
- −$1,782
- − Repairs & maintenance
- −$2,880
- − Management
- −$2,880
- − Depreciation
- −$10,370
- Taxable loss
- −$7,228
- Est. tax savings @ 24.0%
- +$1,735
- After-tax cash flow
- $613/yr
For passive investors: Depreciation is non-cash, so a rental often shows a tax loss while cash-flowing — sheltering income. Rental losses are passive: they offset passive income freely, and up to $25,000/yr can offset ordinary (W-2) income if you actively participate and your MAGI is under $100k (phasing out to $0 by $150k); unused losses carry forward. On sale, claimed depreciation is recaptured at up to 25%, and gains may owe capital-gains tax (a 1031 exchange can defer both). Figures are a year-1 estimate at your 24.0% rate — not tax advice; consult a CPA.
Schools (NCES district)
- District
- Jefferson County
- NCES district ID
- 2102990
- Math proficiency
- 19% ▼ -17.00%
- Reading proficiency
- 35% ▼ -11.00%
- Median HH income
- $47,885
- Composite
- 23.45/100
- National rank
- #7884
- State rank
- #121 of 165 in KY
Livability — Louisville/Jefferson County metro government (balance)
No livability data for this city. (Only ~50 U.S. cities are tracked.)
Census & demographics
- Census place
- Louisville/Jefferson County metro government (balance), KY
- City population
- 419,741
- Population (ZIP)
- 6,484
Population outlook (Jefferson County) Hauer SSP2
- Today (2025)
- 823,112 people
- By 2030
- 849,343 · +3.2%
- By 2040
- 895,696 · +8.8%
- By 2050
- 933,630 · +13.4%
- By 2075
- 1,028,262 · +24.9%
- By 2100
- 1,072,675 · +30.3%
Race, ethnicity, and origin ACS 2023
- Neighborhood character
- Predominantly White (84%)
- Race & ethnicity
- White 84% Black 7% Hispanic / Latino 4% Asian 3% Two or more races 2%
- Common ancestry
- Slovak 4% Iranian 3% Romanian 2%
- Foreign-born
- 3% · Canada, South Korea, China
- Languages at home
- 95% English-only · Spanish 3% Korean 1% Other Indo-European 1%
Political lean MEDSL · Jefferson
- 2024 margin
- D (+16.6) · D 57.4% · R 40.9% · Other 1.7%
- 2008→2024 swing
- +4.5pp toward D · 2008: 12.0pp · 2024: 16.6pp
- All cycles
- 2024: D+16.6 2020: D+20.1 2016: D+13.3 2012: D+11.1 2008: D+12.0
Not yet ingested
- Civics
- —
Market trends
- HPI YoY
- ▼ -48.35%
- Current HPI
- 227.4205
- Rent YoY
- —
- Metro
- —
- State GDP YoY
- ▲ 1.81%
- F500 in state
- 4
Industry mix (Fortune 500 HQ in KY)
| Industry | F500 HQs | Revenue |
|---|---|---|
| Healthcare | 1 | $118B |
|
||
| Food / Beverage | 1 | $7B |
|
||
Cash-flow waterfall
monthlySold comps — $/sqft
last 12 mo · ≤1 miLoading sold comps…