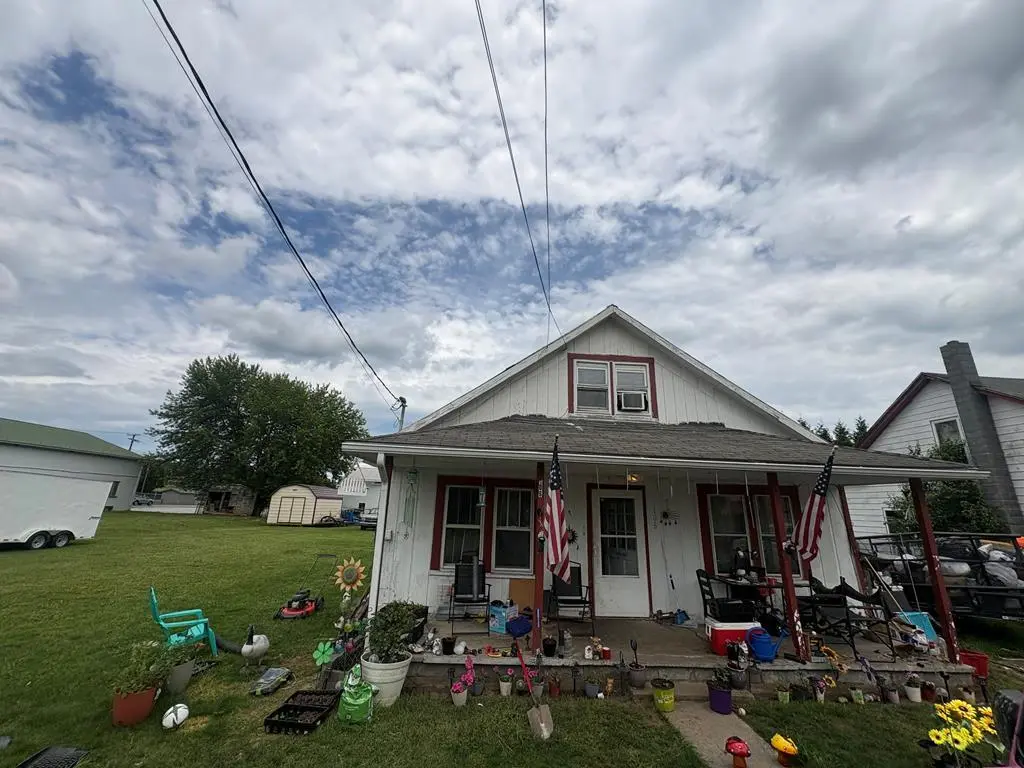
106 Riverside Dr · Galax, VA
Flood risk 5/10 · Moderate
- FEMA flood zone
- X (unshaded)
- Chance of flooding over 30 yrs
- 0.24%
- Est. flood insurance / yr
- $473 – $860
Fire risk 4/10 · Minor
- Est. fire insurance / yr
- $666 – $1,236
Heat risk 3/10 · Minor
- Hot days now (above 92°F)
- 7 days/yr
- Hot days in 30 yrs
- 20 days/yr
Wind risk 2/10 · Minimal
- Chance of severe wind over 30 yrs
- 0.0%
Air-quality risk 1/10 · Minimal
- Unhealthy air days now
- 0 days/yr
- Unhealthy air days in 30 yrs
- 0 days/yr
Risk factors via First Street. Map © Google.
Why this score? — see what drove the B+ grade
The composite is a weighted blend of 9 inputs, each scored 0–100. Each bar is that input's sub-score; the figure is the points it added to the 100-point composite (weight × sub-score).
- Cash flow +30.0/30.0
- ARV discount +14.6/15.0
- DSCR +10.0/10.0
- 1% rule +8.7/10.0
- Schools +5.0/10.0
- Livability +3.3/5.0
- Rent growth +2.5/5.0
- Condition / age +2.5/5.0
- Appreciation +0.0/10.0
$69,999
🖨 Deal sheet (PDF) 📄 Offer letter ✓ Due diligence
Listing remarks MLS
Discover the potential in this 3-bedroom, 1-bath home with nearly 1,000 sq. ft. of living space on a 0.2-acre lot within Galax city limits. This property includes an additional building on site and is conveniently located within walking distance to Chestnut Creek, the Rec Department, and other local attractions. Featuring public utilities and an oil monitor for heat, this home just needs a clean-out and a few updates to shine again. Perfect opportunity for a fixer-upper, first-time homebuyer, or investment property!
Key facts
- Easy access
- Investor special
- Dining
Tags
Property features AI
Exterior
- Utilities: Public water; Public sewer
- Home design: Single family residence; One and one-half stories
- Construction: Wood siding; Metal and shingle roof
- Exterior features: Level lot; Shed(s)
Interior
- Kitchen: Electric oven; Refrigerator
- Flooring: Carpet; Wood
- Bathrooms: 1 full bathroom
- Heating & cooling: Oil heating
- Interior features: Electric oven; Refrigerator; Partial basement
Neighborhood map
What this means for you Summary
Snapshot
- This is a 3-bed/1.0-bath single-family listed at $70k.
Deal economics
- At list price, monthly cash flow is $275 ($3k/yr) — positive.
- The deal already cash-flows at list — no discount required.
- Meets the 1% rule at list price ($961 rent vs $70k).
- Recommended offer: $69k (1.5% below list) — sets the bar for market timing.
- Cap rate 11.0% vs local median 3.7% in Galax — top-decile yield for the area; either an underpriced asset or a hidden risk that comps aren't pricing in. Stress-test before assuming the spread holds.
Location & tenants
- Location reads 66/100 on livability (#327 in VA) — a middle-class / working-renter tenant base. Strengths: cost of living A+, health & safety A+, housing A-; Watch: crime F, amenities F, commute F.
- Galax City Public School District (town): math 54% / reading 68% proficiency, ranked #64 of 131 in VA (top 49%) — acceptable for families but not a draw, mixed tenant base, ~2y average lease.
- Zoned schools: Galax Elementary (math 53% / reading 63%, grade C+, #583 of 1,108 statewide, top 53%, 686 students, 96% FRL); Galax Middle (math 52% / reading 70%, grade B+, #151 of 342 statewide, top 45%, 329 students, 101% FRL); Galax High (math 62% / reading 77%, grade B, #159 of 319 statewide, top 53%, 378 students, 88% FRL) — zoned schools average 95% FRL vs 57% district-wide (38 pts higher); higher-poverty schools than district average — tighter screening recommended.
- Market conditions: 123 active listings in the ZIP; 16 units permitted in Galax city in 2024 (0 in 5+ unit buildings).
Forward outlook
- Local home prices are declining (-3.0%/yr); year-one equity from $484 of loan paydown is wiped out by about $2k of value loss. Plan a longer hold.
- Galax County population projected at -12% by 2050 — secular population decline; favor cash flow + early exit over multi-decade hold.
- At projected returns (-3.0% appreciation + 3.0% rent growth), your $20k cash investment doubles in ~8 years — after that, you're playing with house money.
Negotiation context
- It's been on market 17 days — a 2% lower offer ($69k) is reasonable based on typical stale-listing flexibility.
- 6 sale attempts; this cycle's ask has dropped $20k (22%) from the opening price — seller is motivated, your offer sets the floor, not the list.
- Current owner paid $40k; list at $70k implies a 75% gain — meaningful room to come down on a strong offer.
Risks & watch-outs
- Watch-outs: built in 1937 — expect roof / HVAC / electrical / plumbing capex.
- Climate carrying-cost: moderate flood risk — expect insurance premiums to compound above CPI over the hold.
Questions for the listing agent
- Built in 1937 — when were the roof, HVAC, electrical panel, plumbing, and water heater last replaced?
- Is there a deadline driving the sale (1031 exchange, divorce, estate, relocation)? That informs how much negotiation room exists.
- Schools are B-rated — typically a magnet for longer-tenancy family renters. What's the average tenant stay here, and is there a school-zone premium baked into asking?
- Crime grade is F in this area — have there been break-ins, vandalism, or insurance claims at this property in the last 3 years? What carrier currently insures it and at what premium?
- What's the average days-on-market for RENTAL listings here right now (not sales)? A rising rental-DOM trend means longer vacancies and softer asking-rent achievability than the comps imply.
- What's the recent tenant-quality profile in this submarket — average credit score on applications, eviction rate, late-payment / NSF rate, and stable-employment percentage? A property-management company in the area should have these aggregated.
- How much new for-sale + rental construction is in the pipeline within 1–3 miles? Heavy new supply typically softens prices + rents 12–24 months out; constrained supply supports both.
Investment metrics
- 1% rule
- 1.37% ✓
- Cap rate
- 11.01%
- Cash-on-cash
- 16.86%
- DSCR
- 1.75
- GRM
- 6.1
CMA / ARV
- ARV (on-the-fly)
- $83,162
- Comps found
- 6
Show comp detail 6 sales within ~0.75 mi
| Address | Dist | Beds/Ba | Sqft | Sold | Price | $/sf | Match |
|---|---|---|---|---|---|---|---|
| 106 Riverside Dr | 0.00mi | 3/1.0 | 967 (0%) | 5mo | $40,000 | $41 | 96 |
| 117 Circle Dr | 0.41mi | 3/1.0 | 980 (+1%) | 3mo | $125,000 | $128 | 76 |
| 203 Anderson St | 0.28mi | 3/1.0 | 948 (-2%) | 23mo | $82,000 | $86 | 65 |
| 98 Spring St | 0.74mi | 3/1.0 | 980 (+1%) | 4mo | $150,000 | $153 | 60 |
| 202 Calhoun St | 0.52mi | 2/1.0 (-1) | 1,002 (+4%) | 15mo | $49,900 | $50 | 52 |
| 220 Swanson St | 0.49mi | 3/1.0 | 1,092 (+13%) | 14mo | $86,500 | $79 | 44 |
Match score weights: distance 35% · size 25% · config 20% · recency 20%. Top-matched comps best support the ARV.
Projected returns pro-forma
-3.0% appreciation · 3.0% rent growth · sell at horizon
- IRR
- 8.1%
- Equity multiple
- 1.32×
- Total profit
- $6,214
- Equity at exit
- $10,437
- IRR
- 17.4%
- Equity multiple
- 2.43×
- Total profit
- $28,058
- Equity at exit
- $6,052
Cash invested: $19,600 (down + closing). Projections, not guarantees.
Landlord ↔ Tenant lean methodology
- Overall (STATE)
- 55 Moderately Landlord-Leaning
- State Virginia
- 55 Moderately Landlord-Leaning · D+2
- County
- — inherits STATE
- City
- — inherits STATE
ZIP-level market 24333
- Home prices YoY
- -29.1%
- Active inventory
- 123
- Price-to-rent
- 6.1×
Monthly cashflow live
- Estimated rent
- $961 medium interval (Pro) →
- Mortgage (P&I)
- −$367
- Tax est. 1.5%
- −$87 /mo · $1,050/yr
- Insurance
- −$29
- HOA
- −$0
- Vacancy / Maint / Mgmt
- −$202
- Net cashflow
- $275
Break-even live
Sensitivity live
| Price | -10% $324 | -5% $300 | +0% $275 | +5% $251 | +10% $227 |
|---|---|---|---|---|---|
| Rent | -10% $200 | -5% $237 | +0% $275 | +5% $313 | +10% $351 |
| Rate | -1.0pp $311 | -0.5pp $293 | base $275 | +0.5pp $257 | +1.0pp $239 |
UW: 25.0% down · 7.5% · 30yr · 1.5% tax · 5.0% vac · 8.0% maint · 8.0% mgmt
Financing live
Cash to close
- Down payment
- $17,500
- Closing costs
- $2,100
- Reserves months
- —
- Total cash needed
- —
Loan-product check · same deal, 3 products live
Conventional
25% down · 7.5% · 30yr
- Down + closing
- —
- Monthly P&I
- —
- Monthly cashflow
- —
- DSCR
- —
- Eligible?
- —
Personal DTI + credit; lowest rate.
DSCR
20% down · 8.5% · 30yr
- Down + closing
- —
- Monthly P&I
- —
- Monthly cashflow
- —
- DSCR
- —
- Eligible?
- —
No personal income docs; deal must DSCR.
Hard money
10% down · 12.0% · 12mo
- Down + closing
- —
- Monthly P&I
- —
- Monthly cashflow
- —
- DSCR
- —
- Eligible?
- —
Short-term bridge; refi at stabilization.
Listing history 16 events
-
2026-06-18status $69,999 Pending 17 DOM
-
2026-06-18days on market $69,999 Active 17 DOM
-
2026-06-17days on market $69,999 Active 16 DOM
-
2026-06-16days on market $69,999 Active 15 DOM
-
2026-06-16price $69,999 Active 14 DOM
-
2026-06-15days on market $75,000 Active 14 DOM
-
2026-06-15days on market $75,000 Active 13 DOM
-
2026-06-13days on market $75,000 Active 12 DOM
-
2026-06-12days on market $75,000 Active 11 DOM
-
2026-06-09days on market $75,000 Active 8 DOM
-
2026-06-08days on market $75,000 Active 7 DOM
-
2026-06-08days on market $75,000 Active 6 DOM
-
2026-06-07pricedays on market $75,000 Active 5 DOM
-
2026-06-03days on market $89,999 Active 2 DOM
-
2026-06-02remarks 699-char remark
-
2026-06-02$89,999 Active 1 DOM
ⓘ Source: listings_history table (triggers on properties + properties_extension) + one-shot
backfill from property_details.listing_events for pre-trigger history.
Climate risk First Street
- Flood 5/10 Major FEMA zone X (unshaded) · 24% chance over 30 yrs
- Wildfire 4/10 Moderate
- Heat 3/10 Moderate 7 d/yr ≥92°F today · 20 d/yr by 30 yrs out
- Wind 2/10 Low 0% chance of damaging wind over 30 yrs
- Air quality 1/10 Low 0 unhealthy d/yr today · 0 by 30 yrs out
Nearby sold comps map
Loading sold comps map…
Walkable amenities ~0.75 mi
Loading nearby amenities…
Taxation est. · year 1
- Rental income
- $11,532
- − Mortgage interest
- −$3,921
- − Property taxes
- −$1,050
- − Insurance
- −$350
- − Repairs & maintenance
- −$923
- − Management
- −$923
- − Depreciation
- −$2,036
- Taxable income
- $2,329
- Est. tax owed @ 24.0%
- −$559
- After-tax cash flow
- $2,746/yr
For passive investors: Depreciation is non-cash, so a rental often shows a tax loss while cash-flowing — sheltering income. Rental losses are passive: they offset passive income freely, and up to $25,000/yr can offset ordinary (W-2) income if you actively participate and your MAGI is under $100k (phasing out to $0 by $150k); unused losses carry forward. On sale, claimed depreciation is recaptured at up to 25%, and gains may owe capital-gains tax (a 1031 exchange can defer both). Figures are a year-1 estimate at your 24.0% rate — not tax advice; consult a CPA.
Schools (NCES district)
- District
- Galax City Public School District
- NCES district ID
- 5101560
- Math proficiency
- 54% ▼ -34.00%
- Reading proficiency
- 68% ▼ -10.00%
- Median HH income
- $29,679
- Composite
- 49.91/100
- National rank
- #1941
- State rank
- #64 of 131 in VA
Livability — Galax
- Score
- 66/100
- State rank
- #327
- US rank
- #12370
Category grades
Schools grade is shown separately in the Schools card above.
Census & demographics
- Census place
- Galax, VA
- Population (ZIP)
- 17,841
Population outlook (Galax County) Hauer SSP2
- Today (2025)
- 6,548 people
- By 2030
- 6,418 · -2.0%
- By 2040
- 6,110 · -6.7%
- By 2050
- 5,785 · -11.7%
- By 2075
- 5,168 · -21.1%
- By 2100
- 4,347 · -33.6%
Race, ethnicity, and origin ACS 2023
- Neighborhood character
- Predominantly White (84%)
- Race & ethnicity
- White 84% Hispanic / Latino 10% Two or more races 6% Black 3%
- Hispanic origin (detail)
- Mexican 5% Puerto Rican 1%
- Common ancestry
- Serbian 2% Slovak 1% Romanian 1%
- Foreign-born
- 5% · Canada, South Korea
- Languages at home
- 91% English-only · Spanish 8%
Political lean MEDSL · Galax
- 2024 margin
- Solid R (+43.9) · D 27.7% · R 71.6%
- 2008→2024 swing
- -32.9pp toward R · 2008: -11.0pp · 2024: -43.9pp
- All cycles
- 2024: R+43.9 2020: R+40.2 2016: R+39.1 2012: R+19.0 2008: R+11.0
Not yet ingested
- Civics
- —
Market trends
- HPI YoY
- ▼ -69.21%
- Current HPI
- 168.5375
- Rent YoY
- —
- Metro
- —
- State GDP YoY
- ▲ 2.40%
- F500 in state
- 50
Industry mix (Fortune 500 HQ in VA)
| Industry | F500 HQs | Revenue |
|---|---|---|
| Aerospace / Defense | 4 | $236B |
|
||
| Technology / Defense | 3 | $32B |
|
||
| Financial Services | 2 | $176B |
|
||
| Utilities | 2 | $27B |
|
||
| Insurance | 2 | $25B |
|
||
| Technology | 2 | $15B |
|
||
Price history
+34.3% since first listed15 events — show timeline
- 2026-06-01 Listed $89,999 SWVAR
- 2026-01-09 Sold (MLS) $40,000 NRVMLS
- 2026-01-09 Sold (MLS) $40,000 SWVAR
- 2025-12-18 Pending — NRVMLS
- 2025-12-18 Pending — SWVAR
- 2025-12-09 Relisted — NRVMLS
- 2025-12-09 Price Changed $50,000 NRVMLS
- 2025-12-09 Listed $50,000 SWVAR
- 2025-11-11 Price Changed $57,000 SWVAR
- 2025-11-11 Price Changed $57,000 NRVMLS
- 2025-10-31 Price Changed $63,000 SWVAR
- 2025-10-31 Price Changed $63,000 NRVMLS
- 2025-10-23 Listed $67,000 NRVMLS
- 2025-10-16 Relisted — SWVAR
- 2025-10-12 Listed $67,000 SWVAR
Cash-flow waterfall
monthlySold comps — $/sqft
last 12 mo · ≤1 miLoading sold comps…