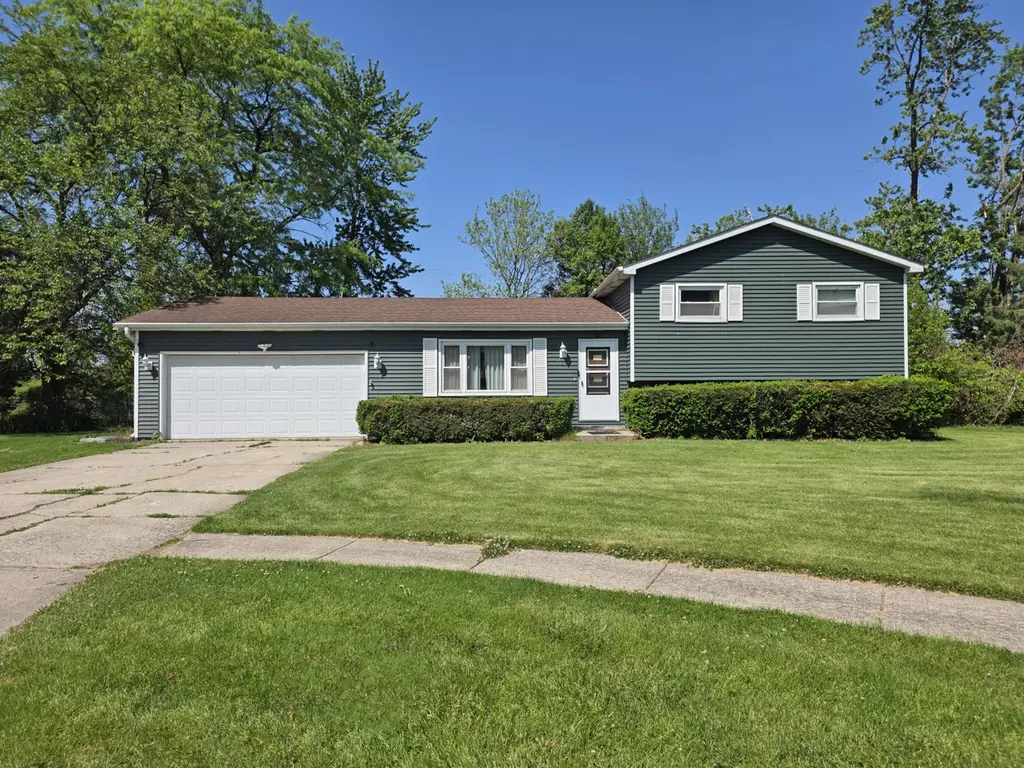
785 Aztec Ct · Lowell, IN
Flood risk 1/10 · Minimal
- FEMA flood zone
- X (unshaded)
- Chance of flooding over 30 yrs
- 0.0%
- Est. flood insurance / yr
- $507 – $1,088
Fire risk 1/10 · Minimal
- Est. fire insurance / yr
- $717 – $1,331
Heat risk 3/10 · Minor
- Hot days now (above 101°F)
- 7 days/yr
- Hot days in 30 yrs
- 16 days/yr
Wind risk 2/10 · Minimal
- Chance of severe wind over 30 yrs
- 0.0%
Air-quality risk 2/10 · Minimal
- Unhealthy air days now
- 1 days/yr
- Unhealthy air days in 30 yrs
- 2 days/yr
Risk factors via First Street. Map © Google.
Why this score? — see what drove the D grade
The composite is a weighted blend of 9 inputs, each scored 0–100. Each bar is that input's sub-score; the figure is the points it added to the 100-point composite (weight × sub-score).
- Cash flow +13.2/30.0
- ARV discount +8.3/15.0
- Schools +4.5/10.0
- DSCR +4.0/10.0
- Livability +3.8/5.0
- 1% rule +3.0/10.0
- Rent growth +2.5/5.0
- Condition / age +2.5/5.0
- Appreciation +0.0/10.0
$264,000
🖨 Deal sheet 📄 Offer letter ✓ Due diligence
Listing remarks
RARE FIND! Looking for a quiet, peaceful outdoor space? This tri level home is situated at the end of a cul-de-sac with extended back and side yards that back up to a large open field! The rear concrete patio offers plenty of seating to view the day's sunset, while a large awning provides instant shade or refuge from the rain. A fence (partially owned by the seller) secures the property. Bring your concept to life with new, cosmetic updates to this well loved, one owner home to make it match your vision. Interior features include a spacious kitchen with separate table space, and appliances included. The front, formal living room has a large window, letting in lots of natural lighting. Upst
Key facts
- Spacious kitchen
- Separate table space
- Appliances included
Tags
Property features AI
Exterior
- Parking: Attached garage; Garage faces front; Driveway; Concrete surface; Garage door opener; Approximately 2.5 garage spaces
- Security: Smoke detectors; Carbon monoxide detectors
- Utilities: Public water; Public sewer; 100 amp electric service with circuit breakers
- Home design: Tri-level home; Built in 1975
- Construction: Vinyl siding
- Exterior features: Covered rear porch and patio; Rain gutters; Partial chain link fencing in back yard; Bay windows; Window blinds; Neighborhood and trees/woods view
Interior
- Kitchen: Gas range; Refrigerator
- Bedrooms: Primary bedroom; Bedroom 2; Bedroom 3; Bonus room
- Bathrooms: 1 full bathroom; 1 half bathroom
- Heating & cooling: Forced air heating (natural gas); Central air conditioning; Ceiling fan(s)
- Interior features: Ceiling fans; Crawl space basement
- Laundry & utility: Washer hookup; Gas dryer hookup; Dryer; Washer; Utility room; Sink (lower level)
Neighborhood map
What this means for you Summary
Snapshot
- This is a 3-bed/1.5-bath single-family listed at $264k.
Deal economics
- At list price, monthly cash flow is $-4 ($-50/yr) — negative.
- To cash-flow at today's rent, offer at most $263k (0.3% below list).
- To meet the 1% rule (rent ≥ 1% of price), the offer needs to be $212k (19.7% below list).
- Recommended offer: $212k (19.7% below list) — sets the bar for 1% rule.
- Cap rate 6.3% vs local median 3.9% in Lowell — top-decile yield for the area; either an underpriced asset or a hidden risk that comps aren't pricing in. Stress-test before assuming the spread holds.
Location & tenants
- Location reads 76/100 on livability (#51 in IN, #3,455 nationally) — a middle-class / working-renter tenant base. Strengths: crime A+, cost of living A+, housing A+; Watch: health & safety C-, amenities F, commute F.
- Tri-Creek School Corporation (town): math 46% / reading 56% proficiency, ranked #39 of 301 in IN (top 13%) — acceptable for families but not a draw, mixed tenant base, ~2y average lease.
- Market conditions: 350 active listings in the ZIP; 4 comparable units currently listed for rent nearby; rentals at typical pace (median 15d on market — plan ~3-4 weeks tenant-placement turnaround); 1,642 units permitted in Lake County in 2024 (14 in 5+ unit buildings).
Forward outlook
- Local home prices are declining (-3.0%/yr); year-one equity from $2k of loan paydown is wiped out by about $8k of value loss. Plan a longer hold.
- Lake County population projected to shrink 7% by 2050 — rents likely to lag national; underwrite the cash flow, not the appreciation.
Negotiation context
- Only 10 days on market — expect competitive offers; lowballing is unlikely to land.
- 2 sale attempts with the ask held roughly flat each time — persistent listings suggest the price (not the market) is what's stuck; bring a comps-based counter.
Questions for the listing agent
- What do current leases actually rent for vs. the listed asking? Can we see a recent rent roll and the last 12 months of T-12 income?
- Built in 1975 — when were the roof, HVAC, electrical panel, plumbing, and water heater last replaced?
- Is there a deadline driving the sale (1031 exchange, divorce, estate, relocation)? That informs how much negotiation room exists.
- The area grade is low — what's the realistic commute time and amenity access for the typical tenant pool here? Any planned neighborhood developments (good or bad) we should know about?
- What's the average days-on-market for RENTAL listings here right now (not sales)? A rising rental-DOM trend means longer vacancies and softer asking-rent achievability than the comps imply.
- What's the recent tenant-quality profile in this submarket — average credit score on applications, eviction rate, late-payment / NSF rate, and stable-employment percentage? A property-management company in the area should have these aggregated.
- How much new for-sale + rental construction is in the pipeline within 1–3 miles? Heavy new supply typically softens prices + rents 12–24 months out; constrained supply supports both.
Investment metrics
- 1% rule
- 0.80% ✗
- Cap rate
- 6.27%
- Cash-on-cash
- -0.07%
- DSCR
- 1.00
- GRM
- 10.4
CMA / ARV
- ARV (on-the-fly)
- $268,928
- Comps found
- 12
Show comp detail 12 sales within ~0.75 mi
| Address | Dist | Beds/Ba | Sqft | Sold | Price | $/sf | Match |
|---|---|---|---|---|---|---|---|
| 654 Cheyenne Dr | 0.17mi | 4/2.0 (+1) | 1,475 (-4%) | 3mo | $283,000 | $192 | 77 |
| 814 Seminole Dr | 0.34mi | 3/2.0 | 1,604 (+5%) | 9mo | $349,999 | $218 | 66 |
| 203 Cherokee Dr | 0.18mi | 3/1.5 | 1,344 (-12%) | 9mo | $295,400 | $220 | 64 |
| 621 Meadow Brook Dr | 0.58mi | 3/2.0 | 1,566 (+2%) | 7mo | $274,900 | $176 | 61 |
| 455 N Nichols St | 0.38mi | 3/1.5 | 1,717 (+12%) | 2mo | $280,000 | $163 | 60 |
| 643 Cheyenne Dr | 0.17mi | 4/2.5 (+1) | 1,704 (+12%) | 8mo | $326,000 | $191 | 57 |
| 409 Greenbrier Ln | 0.67mi | 3/2.0 | 1,584 (+4%) | 8mo | $270,000 | $170 | 54 |
| 402 Greenbrier Ln | 0.64mi | 3/2.0 | 1,630 (+7%) | 6mo | $277,000 | $170 | 52 |
| 432 Briarwood Ln | 0.70mi | 2/1.5 (-1) | 1,596 (+4%) | 4mo | $235,000 | $147 | 52 |
| 711 Meadow Brook Dr | 0.62mi | 3/2.0 | 1,686 (+10%) | 2mo | $280,000 | $166 | 50 |
| 285 W Commercial Ave | 0.50mi | 3/1.0 | 1,729 (+13%) | 8mo | $197,000 | $114 | 46 |
| 648 Beech Ct | 0.56mi | 2/2.0 (-1) | 1,316 (-14%) | 2mo | $240,000 | $182 | 42 |
Match score weights: distance 35% · size 25% · config 20% · recency 20%. Top-matched comps best support the ARV.
Projected returns pro-forma
-3.0% appreciation · 3.0% rent growth · sell at horizon
- IRR
- -16.4%
- Equity multiple
- 0.42×
- Total profit
- $-43,102
- Equity at exit
- $39,363
- IRR
- -8.2%
- Equity multiple
- 0.48×
- Total profit
- $-38,107
- Equity at exit
- $22,826
Cash invested: $73,920 (down + closing). Projections, not guarantees.
Landlord ↔ Tenant lean methodology
- Overall (STATE)
- 90 Strongly Landlord-Friendly
- State Indiana
- 90 Strongly Landlord-Friendly · R+11
- County
- — inherits STATE
- City
- — inherits STATE
ZIP-level market 46356
- Home prices YoY
- -30.1%
- Active inventory
- 350
- Price-to-rent
- 10.4×
Monthly cashflow live
- Estimated rent
- $2,119 medium interval (Pro) →
- Mortgage (P&I)
- −$1,384
- Tax from tax record
- −$184 /mo · $2,208/yr
- Insurance
- −$110
- HOA
- −$0
- Vacancy / Maint / Mgmt
- −$445
- Net cashflow
- $-4
Break-even live
UW: 25.0% down · 7.5% · 30yr · 1.5% tax · 5.0% vac · 8.0% maint · 8.0% mgmt
Financing live
Cash to close
- Down payment
- $66,000
- Closing costs
- $7,920
- Reserves months
- —
- Total cash needed
- —
Loan-product check · same deal, 3 products live
Conventional
25% down · 7.5% · 30yr
- Down + closing
- —
- Monthly P&I
- —
- Monthly cashflow
- —
- DSCR
- —
- Eligible?
- —
Personal DTI + credit; lowest rate.
DSCR
20% down · 8.5% · 30yr
- Down + closing
- —
- Monthly P&I
- —
- Monthly cashflow
- —
- DSCR
- —
- Eligible?
- —
No personal income docs; deal must DSCR.
Hard money
10% down · 12.0% · 12mo
- Down + closing
- —
- Monthly P&I
- —
- Monthly cashflow
- —
- DSCR
- —
- Eligible?
- —
Short-term bridge; refi at stabilization.
Rent comps 4 comps
| Address | Beds | Baths | Sqft | Rent | $/sqft | DOM | Units | Dist |
|---|---|---|---|---|---|---|---|---|
| 445 Cheyenne Dr Lowell, IN | 4.0 | 2.0 | 1958 | $1,895 | $0.97 | 24d | 1 | 0.27mi |
| 510 Creekside Dr Lowell, IN | 1.0–2.0 | 1.0–2.0 | 962 | $1,512 | $1.57 | 1d | 7 | 0.76mi |
| 8366 Kannon Dr Lowell, IN | 3.0 | 2.5 | 1840 | $2,550 | $1.39 | 1d | 1 | 0.81mi |
| 8301 Kannon Dr Lowell, IN | 3.0 | 2.5 | 1717 | $2,800 | $1.63 | 15d | 1 | 0.85mi |
Listing history 7 events
-
2026-06-15status $264,000 Pending 10 DOM
-
2026-06-15days on market $264,000 Active 10 DOM
-
2026-06-13days on market $264,000 Active 8 DOM
-
2026-06-09days on market $264,000 Active 4 DOM
-
2026-06-08days on market $264,000 Active 3 DOM
-
2026-06-07remarks 699-char remark
-
2026-06-07$264,000 Active 2 DOM
ⓘ Source: listings_history table (triggers on properties + properties_extension) + one-shot
backfill from property_details.listing_events for pre-trigger history.
Tax reassessment forecast IN · Partial reset (capped growth)
- Current annual tax
- $2,208 · $184/mo
- Projected year-2 tax
- $2,226 · $186/mo
- Expected delta
- +$18/yr (+$1/mo · 0.8%)
ⓘ Screening estimate from a state-policy table — verify with the county assessor before closing.
Climate risk First Street
- Flood 1/10 Low FEMA zone X (unshaded) · 0% chance over 30 yrs
- Wildfire 1/10 Low
- Heat 3/10 Moderate 7 d/yr ≥101°F today · 16 d/yr by 30 yrs out
- Wind 2/10 Low 0% chance of damaging wind over 30 yrs
- Air quality 2/10 Low 1 unhealthy d/yr today · 2 by 30 yrs out
Nearby sold comps map
Loading sold comps map…
Walkable amenities ~0.75 mi
Loading nearby amenities…
Taxation est. · year 1
- Rental income
- $25,432
- − Mortgage interest
- −$14,788
- − Property taxes
- −$2,208
- − Insurance
- −$1,320
- − Repairs & maintenance
- −$2,035
- − Management
- −$2,035
- − Depreciation
- −$7,680
- Taxable loss
- −$4,633
- Est. tax savings @ 24.0%
- +$1,112
- After-tax cash flow
- $1,062/yr
For passive investors: Depreciation is non-cash, so a rental often shows a tax loss while cash-flowing — sheltering income. Rental losses are passive: they offset passive income freely, and up to $25,000/yr can offset ordinary (W-2) income if you actively participate and your MAGI is under $100k (phasing out to $0 by $150k); unused losses carry forward. On sale, claimed depreciation is recaptured at up to 25%, and gains may owe capital-gains tax (a 1031 exchange can defer both). Figures are a year-1 estimate at your 24.0% rate — not tax advice; consult a CPA.
Schools (NCES district)
- District
- Tri-Creek School Corporation
- NCES district ID
- 1811460
- Math proficiency
- 46% ▼ -8.00%
- Reading proficiency
- 56% ▼ -5.00%
- Median HH income
- $64,614
- Composite
- 44.97/100
- National rank
- #2704
- State rank
- #39 of 301 in IN
Livability — Lowell
- Score
- 76/100
- State rank
- #51
- US rank
- #3455
Category grades
Schools grade is shown separately in the Schools card above.
Census & demographics
- Census place
- Lowell, IN
- City population
- 19,396
- Population (ZIP)
- 19,396
Population outlook (Lake County) Hauer SSP2
- Today (2025)
- 484,026 people
- By 2030
- 478,091 · -1.2%
- By 2040
- 462,974 · -4.3%
- By 2050
- 449,894 · -7.1%
- By 2075
- 436,169 · -9.9%
- By 2100
- 426,607 · -11.9%
Race, ethnicity, and origin ACS 2023
- Neighborhood character
- Predominantly White (88%)
- Race & ethnicity
- White 88% Hispanic / Latino 9% Two or more races 6%
- Hispanic origin (detail)
- Mexican 8%
- Common ancestry
- Romanian 16% Iranian 10% Lithuanian 2%
- Foreign-born
- 4% · Canada
- Languages at home
- 95% English-only · Spanish 4% Russian/Polish/Slavic 1%
Political lean MEDSL · Lake
- 2024 margin
- Lean D (+5.6) · D 52.1% · R 46.5% · Other 1.5%
- 2008→2024 swing
- -28.6pp toward R · 2008: 34.3pp · 2024: 5.6pp
- All cycles
- 2024: D+5.6 2020: D+15.1 2016: D+20.6 2012: D+31.0 2008: D+34.3
Not yet ingested
- Civics
- —
Market trends
- HPI YoY
- ▼ -110.73%
- Current HPI
- 256.6224
- Rent YoY
- —
- Metro
- —
- State GDP YoY
- ▲ 2.90%
- F500 in state
- 18
Industry mix (Fortune 500 HQ in IN)
| Industry | F500 HQs | Revenue |
|---|---|---|
| Industrial Machinery | 2 | $37B |
|
||
| Healthcare | 1 | $177B |
|
||
| Pharmaceuticals | 1 | $45B |
|
||
| Metals / Steel | 1 | $18B |
|
||
| Agriculture | 1 | $17B |
|
||
| Packaging | 1 | $12B |
|
||
Price history
+0.0% since first listed3 events — show timeline
- 2026-06-05 Listed $264,000 NIRA MLS as Distributed by MLS Grid
- 2026-06-01 Listed $264,000 NIRA MLS as Distributed by MLS Grid
- 2026-06-01 Listing Removed — NIRA MLS as Distributed by MLS Grid
Property tax history
+3.5%/yrLatest (2024): $2,208 · +7.7% YoY. Source: county tax records.
Cash-flow waterfall
monthlySold comps — $/sqft
last 12 mo · ≤1 miLoading sold comps…