 Multi-family
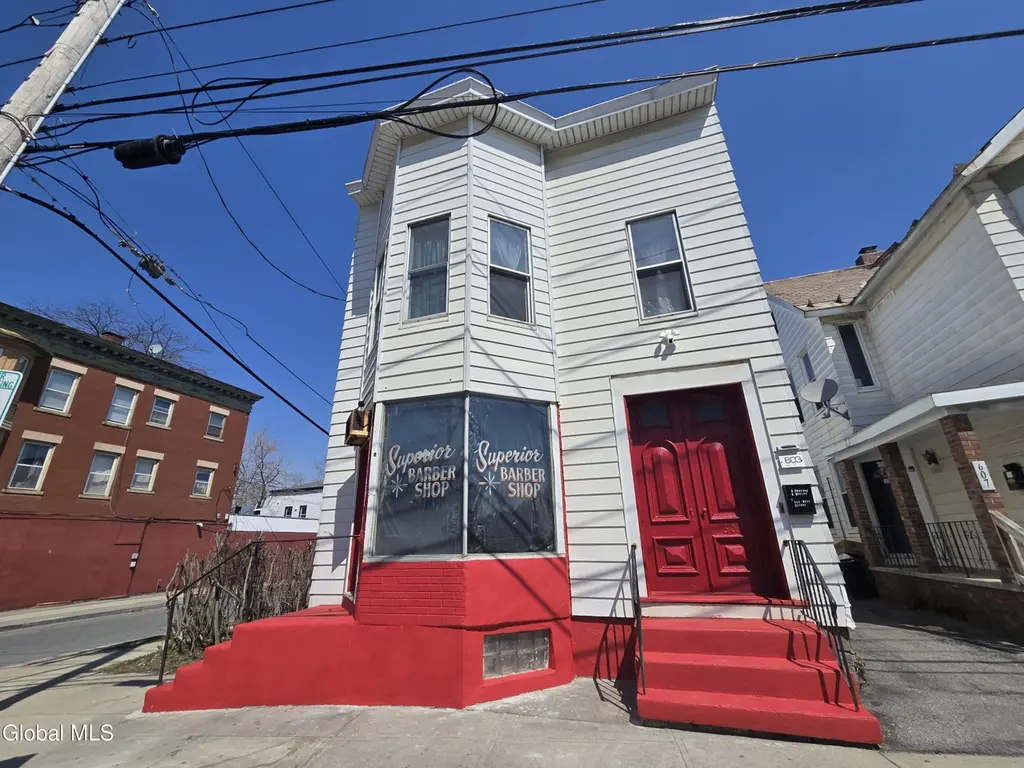
603 Nott St · Schenectady, NY
Flood risk No data
- FEMA flood zone
- —
- Chance of flooding over 30 yrs
- —
- Est. flood insurance / yr
- —
Fire risk No data
- Est. fire insurance / yr
- —
Heat risk No data
- Hot days now (above threshold)
- —
- Hot days in 30 yrs
- —
Wind risk No data
- Chance of severe wind over 30 yrs
- —
Air-quality risk No data
- Unhealthy air days now
- —
- Unhealthy air days in 30 yrs
- —
Risk factors via First Street. Map © Google.
Why this score? — see what drove the B- grade
The composite is a weighted blend of 9 inputs, each scored 0–100. Each bar is that input's sub-score; the figure is the points it added to the 100-point composite (weight × sub-score).
- Cash flow +30.0/30.0
- 1% rule +10.0/10.0
- DSCR +10.0/10.0
- ARV discount +7.5/15.0
- Livability +3.9/5.0
- Schools +3.0/10.0
- Rent growth +2.5/5.0
- Condition / age +2.2/5.0
- Appreciation +0.0/10.0
$374,900
🖨 Deal sheet 📄 Offer letter ✓ Due diligence
Multi-family units
County records classify this as Multi-Family (2-4 Unit). Listing-text estimate: 1 unit. estimate disagrees with records
Listing remarks
Excellent Opportunity to own 2 BUILDINGS and a 2 CAR GARAGE, on a corner lot, in the thriving City of Schenectady. Great for Owner Occupied or Investment. The 1st property has commercial space and an unfinished apartment on the first floor. The second floor has a 3 Bedroom apartment with many updates throughout. A new roof, new electrical and new plumbing were recently done to the building. The 2nd property is residential and in need of rehab. The Garage will provide parking, storage and has a second floor that could be finished. There are endless possibilities with these buildings. You must check them out to see all the potential. Located right across the street from Union College. Minutes
Key facts
- New plumbing
- New electrical
- 3 bedroom apartment
Tags
Property features AI
Exterior
- Parking: Detached garage (2 garage spaces, 2 parking spaces total); Off-street parking
- Utilities: Public water; Public sewer
- Home design: Quadruplex (multi-family property); Living area reported as 2,176
- Construction: Vinyl siding construction
- Exterior features: Garden; Vinyl siding
Interior
- Bedrooms: Unit 1: (bedroom count not provided); Unit 2: 1 bedroom; Unit 3: 3 bedrooms; Unit 4: 1 bedroom
- Bathrooms: Four full bathrooms total; Full baths located on 1st and 2nd levels
- Heating & cooling: Forced air heating (natural gas); Cooling present (type listed as Other)
- Interior features: Full basement; Garden (exterior feature noted under interior/exterior context)
Neighborhood map
What this means for you Summary
Snapshot
- This is a 5-bed/4.5-bath multifamily listed at $375k. Condition is rated fair.
Deal economics
- At list price, monthly cash flow is $3k ($39k/yr) — positive.
- The deal already cash-flows at list — no discount required.
- Meets the 1% rule at list price ($7k rent vs $375k).
- Cap rate 16.7% vs local median 6.3% in Schenectady — top-decile yield for the area; either an underpriced asset or a hidden risk that comps aren't pricing in. Stress-test before assuming the spread holds.
Location & tenants
- Location reads 78/100 on livability (#167 in NY, #2,597 nationally) — a middle-class / working-renter tenant base. Strengths: commute A+, health & safety A+, cost of living A; Watch: employment D+, crime F.
- Schenectady City School District (urban): math 38% / reading 34% proficiency, ranked #556 of 590 in NY (top 94%) — families likely to look elsewhere, expect single-tenant / working-renter base with shorter leases; 65% free/reduced lunch — lower-income household profile, screen leases tightly.
- Zoned schools: Schenectady High School (math 75% / reading 90%, grade A, #446 of 1,100 statewide, top 41%, 2,743 students, 71% FRL).
- Zoned-school proficiency averages 82% at this address vs 36% district-wide (+46 pts) — the actual schools serving this property are materially stronger than the Schenectady City School District average implies; a family-tenant draw the district grade alone would hide.
- Market conditions: 78 active listings in the ZIP; 4 comparable units currently listed for rent nearby; rentals lingering (median 44d on market — plan ~5-8 weeks vacancy on turnover, expect pricing pressure); 75% of comp listings sitting > 30 days — soft ceiling on asking rent; 154 units permitted in Schenectady County in 2024 (54 in 5+ unit buildings).
- At $7,395/mo this rent would consume 140% of the median local household income ($63k/yr) (locally 1016% of renters already pay >50% of income on rent) — very limited rent-growth headroom before tenants either downsize or default.
Forward outlook
- Local home prices are declining (-3.0%/yr); year-one equity from $3k of loan paydown is wiped out by about $11k of value loss. Plan a longer hold.
- Schenectady County population projected to shrink 4% by 2050 — rents likely to lag national; underwrite the cash flow, not the appreciation.
- At projected returns (-3.0% appreciation + 3.0% rent growth), your $105k cash investment doubles in ~4 years — after that, you're playing with house money.
Negotiation context
- Only 10 days on market — expect competitive offers; lowballing is unlikely to land.
- 2 sale attempts with the ask held roughly flat each time — persistent listings suggest the price (not the market) is what's stuck; bring a comps-based counter.
Questions for the listing agent
- Have any recent inspections been done? Can we get a copy of the seller's disclosures and any deferred-maintenance estimates?
- Is there a deadline driving the sale (1031 exchange, divorce, estate, relocation)? That informs how much negotiation room exists.
- Crime grade is F in this area — have there been break-ins, vandalism, or insurance claims at this property in the last 3 years? What carrier currently insures it and at what premium?
- What's the average days-on-market for RENTAL listings here right now (not sales)? A rising rental-DOM trend means longer vacancies and softer asking-rent achievability than the comps imply.
- What's the recent tenant-quality profile in this submarket — average credit score on applications, eviction rate, late-payment / NSF rate, and stable-employment percentage? A property-management company in the area should have these aggregated.
- How much new apartment / multifamily construction is in the pipeline within 1–3 miles? Heavy new supply (>2% of stock underway) typically softens rents 12–24 months out; light construction supports rent growth.
Investment metrics
- 1% rule
- 1.97% ✓
- Cap rate
- 16.70%
- Cash-on-cash
- 37.17%
- DSCR
- 2.65
- GRM
- 4.2
CMA / ARV
- ARV (median comp)
- $213,301
- List price
- $374,900
- Delta
- 87.53%
- Verdict
- OVERPRICED
- Comps
- 20 within 1.0 mi
Show comp detail 12 sales within ~0.75 mi
| Address | Dist | Beds/Ba | Sqft | Sold | Price | $/sf | Match |
|---|---|---|---|---|---|---|---|
| 1588 Foster Ave | 0.15mi | 6/2.0 (+1) | 2,200 (+1%) | 6mo | $315,000 | $143 | 71 |
| 1695 Foster Ave | 0.32mi | 6/2.0 (+1) | 2,208 (+2%) | 6mo | $244,000 | $111 | 62 |
| 515 South Ave | 0.48mi | 5/3.0 | 2,070 (-5%) | 6mo | $172,000 | $83 | 59 |
| 762 Eastern Ave | 0.51mi | 6/2.0 (+1) | 2,205 (+1%) | 3mo | $269,900 | $122 | 56 |
| 1712 Foster Ave | 0.34mi | 6/2.0 (+1) | 2,332 (+7%) | 2mo | $280,000 | $120 | 56 |
| 1610 Avenue A | 0.24mi | 6/3.0 (+1) | 2,442 (+12%) | 5mo | $268,000 | $110 | 54 |
| 113 Degraff St | 0.61mi | 4/2.0 (-1) | 2,172 (-0%) | 4mo | $198,000 | $91 | 53 |
| 1708 Avenue A | 0.39mi | 6/2.0 (+1) | 2,390 (+10%) | 4mo | $320,000 | $134 | 47 |
| 1039 Wendell Ave | 0.52mi | 4/2.0 (-1) | 1,984 (-9%) | 4mo | $220,000 | $111 | 43 |
| 16 Paulding St | 0.67mi | 6/2.0 (+1) | 2,078 (-4%) | 5mo | $205,000 | $99 | 42 |
| 1755 Avenue B | 0.47mi | 6/2.0 (+1) | 2,400 (+10%) | 6mo | $325,000 | $135 | 41 |
| 206 Front St | 0.66mi | 4/2.0 (-1) | 1,880 (-14%) | 2mo | $299,000 | $159 | 30 |
Match score weights: distance 35% · size 25% · config 20% · recency 20%. Top-matched comps best support the ARV.
Projected returns pro-forma
-3.0% appreciation · 3.0% rent growth · sell at horizon
- IRR
- 33.1%
- Equity multiple
- 2.39×
- Total profit
- $146,432
- Equity at exit
- $55,899
- IRR
- 40.1%
- Equity multiple
- 4.76×
- Total profit
- $394,601
- Equity at exit
- $32,415
Cash invested: $104,972 (down + closing). Projections, not guarantees.
Landlord ↔ Tenant lean methodology
- Overall (STATE)
- 15 Strongly Tenant-Friendly
- State New York
- 15 Strongly Tenant-Friendly · D+10
- County
- — inherits STATE
- City
- — inherits STATE
ZIP-level market 12308
- Home prices YoY
- -14.6%
- Active inventory
- 78
- Price-to-rent
- 16.9×
Monthly cashflow live
- Estimated rent
- $7,395 medium interval (Pro) →
- Mortgage (P&I)
- −$1,966
- Tax est. 1.5%
- −$469 /mo · $5,624/yr
- Insurance
- −$156
- HOA
- −$0
- Vacancy / Maint / Mgmt
- −$1,553
- Net cashflow
- $3,251
Break-even live
4-unit breakdown (identical units grouped — click to expand)
| Units | Beds | Baths | Est. rent |
|---|---|---|---|
| 4× units | 5 | 4.5 | $7,396 |
| #1 | 5 | 4.5 | $1,849 |
| #2 | 5 | 4.5 | $1,849 |
| #3 | 5 | 4.5 | $1,849 |
| #4 | 5 | 4.5 | $1,849 |
| Total (4 units) | $7,395 | ||
UW: 25.0% down · 7.5% · 30yr · 1.5% tax · 5.0% vac · 8.0% maint · 8.0% mgmt
Financing live
Cash to close
- Down payment
- $93,725
- Closing costs
- $11,247
- Reserves months
- —
- Total cash needed
- —
Loan-product check · same deal, 3 products live
Conventional
25% down · 7.5% · 30yr
- Down + closing
- —
- Monthly P&I
- —
- Monthly cashflow
- —
- DSCR
- —
- Eligible?
- —
Personal DTI + credit; lowest rate.
DSCR
20% down · 8.5% · 30yr
- Down + closing
- —
- Monthly P&I
- —
- Monthly cashflow
- —
- DSCR
- —
- Eligible?
- —
No personal income docs; deal must DSCR.
Hard money
10% down · 12.0% · 12mo
- Down + closing
- —
- Monthly P&I
- —
- Monthly cashflow
- —
- DSCR
- —
- Eligible?
- —
Short-term bridge; refi at stabilization.
Rent comps 4 comps
| Address | Beds | Baths | Sqft | Rent | $/sqft | DOM | Units | Dist |
|---|---|---|---|---|---|---|---|---|
| 509 Nott St Unit 507 Schenectady, NY | 4.0 | 1.0 | 1400 | $1,695 | $1.21 | 43d | 1 | 0.13mi |
| 1687 Avenue A Schenectady, NY | 4.0 | 1.0 | 1672 | $2,300 | $1.38 | 43d | 1 | 0.35mi |
| 1747 Oneida St Schenectady, NY | 4.0 | 2.0 | 1620 | $2,700 | $1.67 | 14d | 1 | 0.78mi |
| 1347 Union St Schenectady, NY | 4.0 | 1.5 | 2188 | $3,750 | $1.71 | 43d | 1 | 0.92mi |
Listing history 12 events
-
2026-06-18days on market $374,900 Active 10 DOM
-
2026-06-17days on market $374,900 Active 9 DOM
-
2026-06-16days on market $374,900 Active 8 DOM
-
2026-06-15days on market $374,900 Active 7 DOM
-
2026-06-14days on market $374,900 Active 5 DOM
-
2026-06-13days on market $374,900 Active 4 DOM
-
2026-06-10days on market $374,900 Active 2 DOM
-
2026-06-09pricedays on market $374,900 Active 1 DOM
-
2026-05-05price $399,999 747-char remark
-
2026-04-30price $400,000 747-char remark
-
2026-03-18$425,000 Active 747-char remark
-
2021-06-09price $129,900
ⓘ Source: listings_history table (triggers on properties + properties_extension) + one-shot
backfill from property_details.listing_events for pre-trigger history.
Nearby sold comps map
Loading sold comps map…
Walkable amenities ~0.75 mi
Loading nearby amenities…
Taxation est. · year 1
- Rental income
- $88,740
- − Mortgage interest
- −$21,000
- − Property taxes
- −$5,624
- − Insurance
- −$1,874
- − Repairs & maintenance
- −$7,099
- − Management
- −$7,099
- − Depreciation
- −$10,906
- Taxable income
- $35,137
- Est. tax owed @ 24.0%
- −$8,433
- After-tax cash flow
- $30,581/yr
For passive investors: Depreciation is non-cash, so a rental often shows a tax loss while cash-flowing — sheltering income. Rental losses are passive: they offset passive income freely, and up to $25,000/yr can offset ordinary (W-2) income if you actively participate and your MAGI is under $100k (phasing out to $0 by $150k); unused losses carry forward. On sale, claimed depreciation is recaptured at up to 25%, and gains may owe capital-gains tax (a 1031 exchange can defer both). Figures are a year-1 estimate at your 24.0% rate — not tax advice; consult a CPA.
Condition & rehab AI · 6 photos
The property presents as needing moderate repairs and updates, with potential for significant value increase through painting, landscaping, and kitchen/bathroom updates.
Repairs flagged
- Minor Kitchen cabinets — Some wear visible, but not severe.
- Minor Paint touch-ups — Some wear visible on exterior and interior walls.
- Minor Landscaping — Landscaping appears maintained, but not particularly attractive or well-maintained.
Value-add opportunities
- Both Painting and updating the exterior — Improves curb appeal and can increase both resale and rental value.
- Both Landscaping improvements — Enhances curb appeal and can attract more potential buyers or renters.
- Both Kitchen updates — Modernizes the kitchen and can increase both resale and rental value.
- Both Bathroom updates — Modernizes the bathrooms and can increase both resale and rental value.
Renovation cost estimate screening
| Repair item | Severity | Est. cost |
|---|---|---|
| Kitchen cabinets · Some wear visible, but not severe. | Minor | $500–3,000 |
| Paint touch-ups · Some wear visible on exterior and interior walls. | Minor | $500–3,000 |
| Landscaping · Landscaping appears maintained, but not particularly attractive or well-maintained. | Minor | $500–3,000 |
| Total estimated repair cost · 3 items | $1,500–9,000 |
Value-add ROI direction
- Both Painting and updating the exterior — Improves curb appeal and can increase both resale and rental value. ↑
- Both Landscaping improvements — Enhances curb appeal and can attract more potential buyers or renters. ↑
- Both Kitchen updates — Modernizes the kitchen and can increase both resale and rental value. ↑
- Both Bathroom updates — Modernizes the bathrooms and can increase both resale and rental value. ↑
ⓘ Cost ranges are severity-bucket heuristics (US national rule-of-thumb). Get contractor quotes + a written scope before underwriting a rehab budget.
Schools (NCES district)
- District
- Schenectady City School District
- NCES district ID
- 3626010
- Math proficiency
- 38% ▲ 12.00%
- Reading proficiency
- 34% ▲ 2.00%
- Median HH income
- $39,453
- Composite
- 30.2/100
- National rank
- #6309
- State rank
- #556 of 590 in NY
Livability — Schenectady
- Score
- 78/100
- State rank
- #167
- US rank
- #2597
Category grades
Schools grade is shown separately in the Schools card above.
Census & demographics
- Census place
- Schenectady, NY
- County
- Schenectady County · 141,369 people
- City population
- 141,369
- Metro
- Albany-Schenectady-Troy, NY
- Population (ZIP)
- 15,511
- Household income
- $63,434
- Rent vs Own
- Severe rent burden
- 1016.0
Population outlook (Schenectady County) Hauer SSP2
- Today (2025)
- 155,046 people
- By 2030
- 154,322 · -0.5%
- By 2040
- 151,796 · -2.1%
- By 2050
- 148,621 · -4.1%
- By 2075
- 141,229 · -8.9%
- By 2100
- 126,014 · -18.7%
Race, ethnicity, and origin ACS 2023
- Neighborhood character
- Diverse neighborhood (Simpson 0.63)
- Race & ethnicity
- White 57% Black 17% Hispanic / Latino 13% Two or more races 7% Asian 3%
- Hispanic origin (detail)
- Mexican 2% Puerto Rican 8%
- Common ancestry
- Lithuanian 4% Romanian 4% Slovak 3%
- Foreign-born
- 10% · Canada
- Languages at home
- 89% English-only · Spanish 5% Other Indo-European 2% Arabic 1%
Political lean MEDSL · Schenectady
- 2024 margin
- D (+10.8) · D 55.4% · R 44.6%
- 2008→2024 swing
- -1.8pp toward R · 2008: 12.7pp · 2024: 10.8pp
- All cycles
- 2024: D+10.8 2020: D+15.7 2016: D+5.8 2012: D+15.4 2008: D+12.7
Not yet ingested
- Civics
- —
Market trends
- HPI YoY
- ▼ -59.17%
- Current HPI
- 344.8675
- Rent YoY
- —
- Metro
- Albany-Schenectady-Troy, NY
- State GDP YoY
- ▲ 2.60%
- F500 in state
- 92
Industry mix (Fortune 500 HQ in NY)
| Industry | F500 HQs | Revenue |
|---|---|---|
| Financial Services | 10 | $950B |
|
||
| Consumer Goods | 9 | $162B |
|
||
| Insurance | 4 | $225B |
|
||
| Telecommunications | 2 | $144B |
|
||
| Pharmaceuticals | 2 | $112B |
|
||
| Media / Entertainment | 2 | $69B |
|
||
Price history
+188.6% since first listed6 events — show timeline
- 2026-06-08 Listed $374,900 Global MLS
- 2026-05-30 Listing Removed — Global MLS
- 2026-05-05 Price Changed $399,999 Global MLS
- 2026-04-30 Price Changed $400,000 Global MLS
- 2026-03-18 Listed $425,000 Global MLS
- 2021-06-09 Price Changed $129,900 Global MLS
Cash-flow waterfall
monthlySold comps — $/sqft
last 12 mo · ≤1 miLoading sold comps…