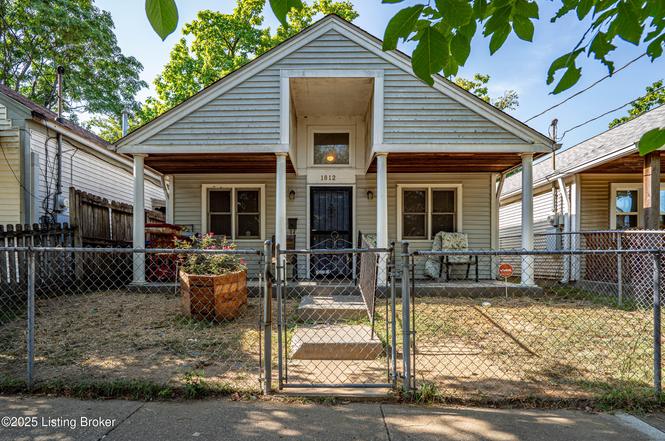
1812 Magazine St · Louisville, KY
Flood risk 1/10 · Minimal
- FEMA flood zone
- X (unshaded)
- Chance of flooding over 30 yrs
- 0.0%
- Est. flood insurance / yr
- $507 – $1,088
Fire risk 1/10 · Minimal
- Est. fire insurance / yr
- $839 – $1,559
Heat risk 5/10 · Moderate
- Hot days now (above 105°F)
- 7 days/yr
- Hot days in 30 yrs
- 20 days/yr
Wind risk 2/10 · Minimal
- Chance of severe wind over 30 yrs
- 1.0%
Air-quality risk 2/10 · Minimal
- Unhealthy air days now
- 1 days/yr
- Unhealthy air days in 30 yrs
- 2 days/yr
Risk factors via First Street. Map © Google.
Why this score? — see what drove the B- grade
The composite is a weighted blend of 9 inputs, each scored 0–100. Each bar is that input's sub-score; the figure is the points it added to the 100-point composite (weight × sub-score).
- Cash flow +25.5/30.0
- ARV discount +15.0/15.0
- DSCR +8.4/10.0
- 1% rule +6.0/10.0
- Rent growth +3.4/5.0
- Livability +3.2/5.0
- Condition / age +2.5/5.0
- Schools +2.3/10.0
- Appreciation +0.0/10.0
$109,995
🖨 Deal sheet 📄 Offer letter ✓ Due diligence
Listing remarks
This 3-bedroom home offers a comfortable layout with a warm, welcoming feel from the moment you walk in. The living room provides a great space to relax or gather, and the kitchen offers plenty of room for everyday meals and conversation. With a practical floor plan and inviting atmosphere, this home makes it easy to settle in and feel at home.
Key facts
- 0.7 acre lot
- Built 1994
- Listed 297 days
Property features AI
Finance
- Other: Subdivision: RUSSELL
- HOA & community: No monthly maintenance fees
Exterior
- Parking: No on-site parking
- Utilities: Electricity connected; Natural gas available
- Home design: Single-family ranch-style home; One story
- Construction: Built in 1994; Vinyl siding exterior; Shingle roof; Crawl space foundation
- Exterior features: Level lot; Chain link fence
Interior
- Kitchen: Kitchen located on the first floor
- Bedrooms: Three bedrooms, all on the first floor; Primary bedroom on the first floor
- Bathrooms: One full bathroom on the first floor
- Heating & cooling: Natural gas heating; Central air conditioning
- Interior features: Five rooms total; No basement
- Laundry & utility: First-floor laundry
Neighborhood map
What this means for you Summary
Snapshot
- This is a 3-bed/1.0-bath single-family listed at $110k.
Deal economics
- At list price, monthly cash flow is $256 ($3k/yr) — positive.
- The deal already cash-flows at list — no discount required.
- Meets the 1% rule at list price ($1k rent vs $110k).
- Recommended offer: $97k (12.0% below list) — sets the bar for market timing.
- Cap rate 9.1% vs local median 5.0% in Louisville — top-decile yield for the area; either an underpriced asset or a hidden risk that comps aren't pricing in. Stress-test before assuming the spread holds.
Location & tenants
- Location reads 63/100 on livability (#333 in KY) — a middle-class / working-renter tenant base. Strengths: cost of living A+, housing A+; Watch: employment C-, health & safety D+, schools D-.
- Jefferson County (urban): math 19% / reading 35% proficiency, ranked #121 of 165 in KY (top 73%) — low school quality limits family demand, transient renter base, plan for 1-2y turnover.
- Market conditions: Rents rising (+3.7%/yr); 114 active listings in the ZIP; 40 comparable units currently listed for rent nearby; rentals at typical pace (median 24d on market — plan ~3-4 weeks tenant-placement turnaround); lower-income renter base — watch delinquency; 2,836 units permitted in Jefferson County in 2024 (1,558 in 5+ unit buildings).
- At $1,213/mo this rent would consume 47% of the median local household income ($31k/yr) (locally 1603% of renters already pay >50% of income on rent) — very limited rent-growth headroom before tenants either downsize or default.
Forward outlook
- Local home prices are declining (-3.0%/yr); year-one equity from $760 of loan paydown is wiped out by about $3k of value loss. Plan a longer hold.
- Jefferson County population projected at +13% by 2050 — modest demand growth; plan on rents tracking national, not racing it.
- At projected returns (-3.0% appreciation + 3.7% rent growth), your $31k cash investment doubles in ~10 years — after that, you're playing with house money.
Negotiation context
- It's been on market 297 days — a 12% lower offer ($97k) is reasonable based on typical stale-listing flexibility.
Risks & watch-outs
- Climate carrying-cost: extreme-heat days projected 7→20/yr by 2055 (HVAC capex compounding) — expect insurance premiums to compound above CPI over the hold.
Questions for the listing agent
- It's been on market 297 days. Have you received any prior offers? Is the seller open to a 12% concession, seller financing, or rate buy-down credit?
- Why hasn't it sold? Are there any deal-killer items the seller is aware of (foundation, flood, title, zoning, code violations)?
- Is there a deadline driving the sale (1031 exchange, divorce, estate, relocation)? That informs how much negotiation room exists.
- Schools are D-rated, which usually means shorter tenancies and higher turnover. Who's the typical renter profile here, and what's been the actual vacancy rate?
- Crime grade is F in this area — have there been break-ins, vandalism, or insurance claims at this property in the last 3 years? What carrier currently insures it and at what premium?
- What's the average days-on-market for RENTAL listings here right now (not sales)? A rising rental-DOM trend means longer vacancies and softer asking-rent achievability than the comps imply.
- What's the recent tenant-quality profile in this submarket — average credit score on applications, eviction rate, late-payment / NSF rate, and stable-employment percentage? A property-management company in the area should have these aggregated.
- How much new for-sale + rental construction is in the pipeline within 1–3 miles? Heavy new supply typically softens prices + rents 12–24 months out; constrained supply supports both.
Investment metrics
- 1% rule
- 1.10% ✓
- Cap rate
- 9.09%
- Cash-on-cash
- 9.97%
- DSCR
- 1.44
- GRM
- 7.6
CMA / ARV
- ARV (on-the-fly)
- $136,032
- Comps found
- 12
Show comp detail 12 sales within ~0.75 mi
| Address | Dist | Beds/Ba | Sqft | Sold | Price | $/sf | Match |
|---|---|---|---|---|---|---|---|
| 629 S 19th St | 0.05mi | 3/2.5 | 1,358 (+9%) | 4mo | $159,900 | $118 | 74 |
| 2102 Magazine St | 0.25mi | 2/1.0 (-1) | 1,148 (-8%) | 3mo | $42,500 | $37 | 68 |
| 408 Dr W J Hodge St | 0.45mi | 2/1.5 (-1) | 1,270 (+2%) | 3mo | $120,000 | $94 | 66 |
| 720 S 24th St | 0.55mi | 3/1.5 | 1,254 (+0%) | 7mo | $155,000 | $124 | 66 |
| 1532 W Breckinridge St | 0.48mi | 3/1.0 | 1,142 (-8%) | 3mo | $120,000 | $105 | 61 |
| 2425 Elliott Ave | 0.57mi | 3/2.0 | 1,325 (+6%) | 5mo | $145,000 | $109 | 54 |
| 2338 W Madison St | 0.55mi | 4/1.0 (+1) | 1,136 (-9%) | 1mo | $125,000 | $110 | 53 |
| 2321 W Market St | 0.74mi | 3/1.0 | 1,138 (-9%) | 1mo | $110,000 | $97 | 50 |
| 2010 W Market St | 0.56mi | 3/2.0 | 1,376 (+10%) | 4mo | $135,000 | $98 | 50 |
| 510 S 15th St | 0.38mi | 2/1.5 (-1) | 1,060 (-15%) | 4mo | $76,000 | $72 | 47 |
| 2304 Date St | 0.73mi | 3/2.0 | 1,180 (-5%) | 7mo | $165,000 | $140 | 47 |
| 101 Saunders | 0.59mi | 2/2.0 (-1) | 1,148 (-8%) | 5mo | $145,000 | $126 | 46 |
Match score weights: distance 35% · size 25% · config 20% · recency 20%. Top-matched comps best support the ARV.
Projected returns pro-forma
-3.0% appreciation · 3.73% rent growth · sell at horizon
- IRR
- -0.5%
- Equity multiple
- 0.98×
- Total profit
- $-638
- Equity at exit
- $16,401
- IRR
- 9.8%
- Equity multiple
- 1.78×
- Total profit
- $24,108
- Equity at exit
- $9,510
Cash invested: $30,799 (down + closing). Projections, not guarantees.
Landlord ↔ Tenant lean methodology
- Overall (STATE)
- 83 Strongly Landlord-Friendly
- State Kentucky
- 83 Strongly Landlord-Friendly · R+16
- County
- — inherits STATE
- City
- — inherits STATE
ZIP-level market 40203
- Home prices YoY
- -13.8%
- Rents YoY
- 3.7%
- Active inventory
- 114
- Price-to-rent
- 7.6×
Monthly cashflow live
- Estimated rent
- $1,213 high interval (Pro) →
- Mortgage (P&I)
- −$577
- Tax from tax record
- −$80 /mo · $957/yr
- Insurance
- −$46
- HOA
- −$0
- Vacancy / Maint / Mgmt
- −$255
- Net cashflow
- $256
Break-even live
UW: 25.0% down · 7.5% · 30yr · 1.5% tax · 5.0% vac · 8.0% maint · 8.0% mgmt
Financing live
Cash to close
- Down payment
- $27,499
- Closing costs
- $3,300
- Reserves months
- —
- Total cash needed
- —
Loan-product check · same deal, 3 products live
Conventional
25% down · 7.5% · 30yr
- Down + closing
- —
- Monthly P&I
- —
- Monthly cashflow
- —
- DSCR
- —
- Eligible?
- —
Personal DTI + credit; lowest rate.
DSCR
20% down · 8.5% · 30yr
- Down + closing
- —
- Monthly P&I
- —
- Monthly cashflow
- —
- DSCR
- —
- Eligible?
- —
No personal income docs; deal must DSCR.
Hard money
10% down · 12.0% · 12mo
- Down + closing
- —
- Monthly P&I
- —
- Monthly cashflow
- —
- DSCR
- —
- Eligible?
- —
Short-term bridge; refi at stabilization.
Rent comps 40 comps
| Address | Beds | Baths | Sqft | Rent | $/sqft | DOM | Units | Dist |
|---|---|---|---|---|---|---|---|---|
| 1810 Magazine St Louisville, KY | 3.0 | 1.5 | 1248 | $1,450 | $1.16 | 10d | 1 | 0.01mi |
| 1700 Magazine St Unit 3 Louisville, KY | 2.0 | 1.0 | 900 | $1,150 | $1.28 | 17d | 1 | 0.12mi |
| 515 S 20th St Louisville, KY | 2.0 | 1.0 | 1000 | $995 | $0.99 | 16d | 1 | 0.27mi |
| 2221 W Madison St Louisville, KY | 3.0 | 1.0 | 1000 | $1,350 | $1.35 | 24d | 1 | 0.43mi |
| 2221 W Madison St Louisville, KY | 2.0 | 1.0 | 1000 | $1,350 | $1.35 | 21d | 1 | 0.43mi |
| 2300 W Madison St Louisville, KY | 2.0 | 1.0 | 900 | $850 | $0.94 | 24d | 1 | 0.47mi |
| 2411 Elliott Ave Louisville, KY | 2.0 | 1.0 | 892 | $895 | $1.00 | 24d | 1 | 0.54mi |
| 1723 W Kentucky St Unit 3 Louisville, KY | 3.0 | 1.0 | 1200 | $1,300 | $1.08 | 24d | 1 | 0.54mi |
| 1612 W Market St Unit 2 Louisville, KY | 2.0 | 2.0 | 900 | $1,000 | $1.11 | 24d | 1 | 0.56mi |
| 848 S 23rd St Louisville, KY | 3.0 | 1.5 | 1050 | $1,450 | $1.38 | 24d | 1 | 0.57mi |
| 1644 W Kentucky St Unit 3 Louisville, KY | 3.0 | 1.0 | 900 | $950 | $1.06 | 24d | 1 | 0.58mi |
| 1847 W Kentucky St Louisville, KY | 2.0 | 1.0 | 1368 | $895 | $0.65 | 3d | 1 | 0.62mi |
| 430 S 24th St Louisville, KY | 3.0 | 1.5 | 1288 | $1,400 | $1.09 | 24d | 1 | 0.65mi |
| 112 N 18th St Louisville, KY | 2.0 | 1.0 | 944 | $1,050 | $1.11 | 24d | 1 | 0.68mi |
| 120 N 20th St Louisville, KY | 3.0 | 1.5 | 1300 | $1,400 | $1.08 | 24d | 1 | 0.72mi |
| 1704 Rowan St Unit 1704-2 Louisville, KY | 3.0 | 1.0 | 740 | $850 | $1.15 | 24d | 1 | 0.73mi |
| 2416 Garland Ave Louisville, KY | 3.0 | 2.0 | 1172 | $1,600 | $1.37 | 24d | 1 | 0.74mi |
| 200 N 18th St Unit 200-4 Louisville, KY | 2.0 | 1.0 | 740 | $775 | $1.05 | 20d | 1 | 0.75mi |
| 2132 Rowan St Louisville, KY | 1.0–2.0 | 1.0–2.0 | 875 | $928 | $1.06 | 3d | 4 | 0.78mi |
| 1616 Gallagher St Louisville, KY | 3.0 | 1.5 | 1056 | $1,400 | $1.33 | 24d | 1 | 0.79mi |
| 1148 S 17th St Unit 2 Louisville, KY | 3.0 | 1.0 | 1000 | $895 | $0.90 | 24d | 1 | 0.81mi |
| 2631 W Madison St Unit 2 Louisville, KY | 2.0 | 1.0 | 928 | $850 | $0.92 | 17d | 1 | 0.81mi |
| 2631 W Madison St Unit 2 Louisville, KY | 2.0 | 1.0 | 928 | $850 | $0.92 | 24d | 1 | 0.81mi |
| 2631 W Madison St Unit 1 Louisville, KY | 3.0 | 1.0 | 928 | $950 | $1.02 | 24d | 1 | 0.81mi |
| 1705 1/2 Hale Ave Louisville, KY | 3.0 | 2.0 | 1257 | $1,400 | $1.11 | 10d | 1 | 0.82mi |
| 2623 Cedar St Louisville, KY | 3.0 | 1.0 | 1000 | $1,000 | $1.00 | 24d | 1 | 0.85mi |
| 980 W Liberty St Louisville, KY | 1.0–3.0 | 1.0–1.5 | 1026 | $1,535 | $1.50 | 24d | 133 | 0.86mi |
| 2733 Chase Ct Louisville, KY | 2.0 | 1.0 | 900 | $900 | $1.00 | 16d | 1 | 0.86mi |
| 2614 W Jefferson St Unit 2614-4 Louisville, KY | 2.0 | 1.0 | 740 | $795 | $1.07 | 24d | 1 | 0.88mi |
| 500 N 17th St Unit 301 Louisville, KY | 2.0 | 1.0 | 775 | $1,200 | $1.55 | 16d | 1 | 0.89mi |
| 500 N 17th St Apt 309 Louisville, KY | 2.0 | 1.0 | 775 | $1,200 | $1.55 | 24d | 1 | 0.89mi |
| 2508 W Main St Louisville, KY | 3.0 | 1.0 | 1327 | $1,500 | $1.13 | 24d | 1 | 0.89mi |
| 2634 Garland Ave Unit B Louisville, KY | 3.0 | 1.0 | 1152 | $895 | $0.78 | 20d | 1 | 0.90mi |
| 2634 Garland Ave Unit A Louisville, KY | 3.0 | 1.0 | 1152 | $940 | $0.82 | 24d | 1 | 0.90mi |
| 214 N 24th St Louisville, KY | 3.0 | 1.5 | 1012 | $915 | $0.90 | 24d | 1 | 0.94mi |
| 2529 W Main St #2 Louisville, KY | 3.0 | 1.0 | 1404 | $1,200 | $0.85 | 24d | 1 | 0.95mi |
| 409 N 20th St Louisville, KY | 3.0 | 1.0 | 1200 | $1,050 | $0.88 | 3d | 1 | 0.96mi |
| 2724 Garland Ave Unit 202 Louisville, KY | 2.0 | 1.0 | 950 | $745 | $0.78 | 3d | 1 | 0.97mi |
| 2711 W Kentucky St Louisville, KY | 3.0 | 1.0 | 1155 | $1,100 | $0.95 | 24d | 1 | 0.97mi |
| 212 N 25th St Louisville, KY | 3.0 | 1.0 | 1104 | $895 | $0.81 | 24d | 1 | 0.98mi |
Listing history 16 events
-
2026-06-18days on market $109,995 Active 297 DOM
-
2026-06-17days on market $109,995 Active 296 DOM
-
2026-06-16days on market $109,995 Active 295 DOM
-
2026-06-15days on market $109,995 Active 294 DOM
-
2026-06-13days on market $109,995 Active 292 DOM
-
2026-06-10days on market $109,995 Active 289 DOM
-
2026-06-09days on market $109,995 Active 288 DOM
-
2026-06-08days on market $109,995 Active 287 DOM
-
2026-06-07days on market $109,995 Active 286 DOM
-
2026-06-03days on market $109,995 Active 282 DOM
-
2026-06-02days on market $109,995 Active 281 DOM
-
2026-06-01days on market $109,995 Active 280 DOM
-
2026-05-31days on market $109,995 Active 279 DOM
-
2026-03-04price $109,995
-
2025-10-07price $110,000
-
2025-08-25$120,000 Active
ⓘ Source: listings_history table (triggers on properties + properties_extension) + one-shot
backfill from property_details.listing_events for pre-trigger history.
Tax reassessment forecast KY · Resets to sale price
- Current annual tax
- $957 · $80/mo
- Projected year-2 tax
- $957 · $80/mo
- Expected delta
- $0/yr ($0/mo · 0.0%)
ⓘ Screening estimate from a state-policy table — verify with the county assessor before closing.
Climate risk First Street
- Flood 1/10 Low FEMA zone X (unshaded) · 0% chance over 30 yrs
- Wildfire 1/10 Low
- Heat 5/10 Major 7 d/yr ≥105°F today · 20 d/yr by 30 yrs out
- Wind 2/10 Low 100% chance of damaging wind over 30 yrs
- Air quality 2/10 Low 1 unhealthy d/yr today · 2 by 30 yrs out
Nearby sold comps map
Loading sold comps map…
Walkable amenities ~0.75 mi
Loading nearby amenities…
Taxation est. · year 1
- Rental income
- $14,558
- − Mortgage interest
- −$6,161
- − Property taxes
- −$957
- − Insurance
- −$550
- − Repairs & maintenance
- −$1,165
- − Management
- −$1,165
- − Depreciation
- −$3,200
- Taxable income
- $1,361
- Est. tax owed @ 24.0%
- −$327
- After-tax cash flow
- $2,746/yr
For passive investors: Depreciation is non-cash, so a rental often shows a tax loss while cash-flowing — sheltering income. Rental losses are passive: they offset passive income freely, and up to $25,000/yr can offset ordinary (W-2) income if you actively participate and your MAGI is under $100k (phasing out to $0 by $150k); unused losses carry forward. On sale, claimed depreciation is recaptured at up to 25%, and gains may owe capital-gains tax (a 1031 exchange can defer both). Figures are a year-1 estimate at your 24.0% rate — not tax advice; consult a CPA.
Schools (NCES district)
- District
- Jefferson County
- NCES district ID
- 2102990
- Math proficiency
- 19% ▼ -17.00%
- Reading proficiency
- 35% ▼ -11.00%
- Median HH income
- $47,885
- Composite
- 23.45/100
- National rank
- #7884
- State rank
- #121 of 165 in KY
Livability — Louisville
- Score
- 63/100
- State rank
- #333
- US rank
- #15887
Category grades
Schools grade is shown separately in the Schools card above.
Census & demographics
- Census place
- Louisville, KY
- County
- Jefferson County · 790,184 people
- City population
- 769,292
- Metro
- Louisville/Jefferson County, KY-IN
- Population (ZIP)
- 17,742
- Household income
- $30,794
- Rent vs Own
- Severe rent burden
- 1603.0
Population outlook (Jefferson County) Hauer SSP2
- Today (2025)
- 823,112 people
- By 2030
- 849,343 · +3.2%
- By 2040
- 895,696 · +8.8%
- By 2050
- 933,630 · +13.4%
- By 2075
- 1,028,262 · +24.9%
- By 2100
- 1,072,675 · +30.3%
Race, ethnicity, and origin ACS 2023
- Neighborhood character
- Diverse neighborhood (Simpson 0.56)
- Race & ethnicity
- Black 49% White 44% Two or more races 4% Hispanic / Latino 3%
- Common ancestry
- Slovak 2% Lithuanian 2% Romanian 1%
- Foreign-born
- 3% · Canada
- Languages at home
- 97% English-only · Spanish 2%
Political lean MEDSL · Jefferson
- 2024 margin
- D (+16.6) · D 57.4% · R 40.9% · Other 1.7%
- 2008→2024 swing
- +4.5pp toward D · 2008: 12.0pp · 2024: 16.6pp
- All cycles
- 2024: D+16.6 2020: D+20.1 2016: D+13.3 2012: D+11.1 2008: D+12.0
Not yet ingested
- Civics
- —
Market trends
- HPI YoY
- ▼ -64.74%
- Current HPI
- 405.1872
- Rent YoY
- ▲ 3.73%
- Metro
- Louisville/Jefferson County, KY-IN
- State GDP YoY
- ▲ 1.81%
- F500 in state
- 4
Industry mix (Fortune 500 HQ in KY)
| Industry | F500 HQs | Revenue |
|---|---|---|
| Healthcare | 1 | $118B |
|
||
| Food / Beverage | 1 | $7B |
|
||
Price history
-8.3% since first listed3 events — show timeline
- 2026-03-04 Price Changed $109,995 Metro Search MLS
- 2025-10-07 Price Changed $110,000 Metro Search MLS
- 2025-08-25 Listed $120,000 Metro Search MLS
Property tax history
+29.0%/yrLatest (2025): $957 · -1.9% YoY. Source: county tax records.
Cash-flow waterfall
monthlySold comps — $/sqft
last 12 mo · ≤1 miLoading sold comps…