5163 Old Airport Rd · Winnsboro, SC
Flood risk 1/10 · Minimal
- FEMA flood zone
- X (unshaded)
- Chance of flooding over 30 yrs
- 0.0%
- Est. flood insurance / yr
- $507 – $1,088
Fire risk 4/10 · Minor
- Est. fire insurance / yr
- $783 – $1,453
Heat risk 6/10 · Moderate
- Hot days now (above 107°F)
- 7 days/yr
- Hot days in 30 yrs
- 15 days/yr
Wind risk 6/10 · Moderate
- Chance of severe wind over 30 yrs
- 46.0%
Air-quality risk 2/10 · Minimal
- Unhealthy air days now
- 1 days/yr
- Unhealthy air days in 30 yrs
- 1 days/yr
Risk factors via First Street. Map © Google.
Why this score? — see what drove the C+ grade
The composite is a weighted blend of 9 inputs, each scored 0–100. Each bar is that input's sub-score; the figure is the points it added to the 100-point composite (weight × sub-score).
- Cash flow +24.9/30.0
- DSCR +8.1/10.0
- ARV discount +7.5/15.0
- 1% rule +6.7/10.0
- Appreciation +5.0/10.0
- Livability +2.7/5.0
- Schools +2.6/10.0
- Rent growth +2.5/5.0
- Condition / age +2.5/5.0
$110,000
🖨 Deal sheet 📄 Offer letter ✓ Due diligence
Listing remarks
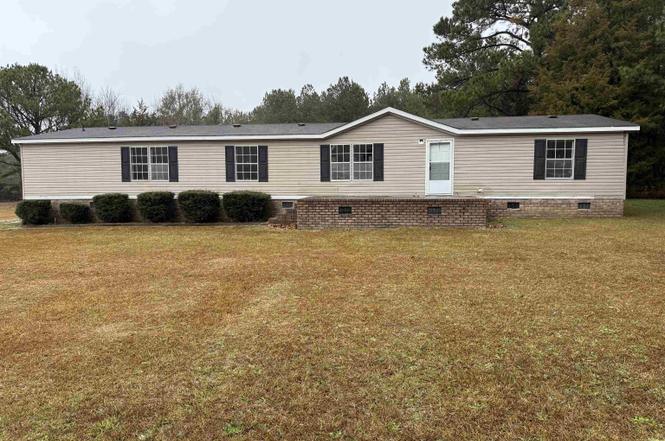
Spacious 4-Bedroom Country Retreat on 2.77 Acres in Winnsboro, SCDiscover the perfect blend of space, privacy, and potential at 5163 Old Airport Road, a welcoming manufactured home nestled on a vast 2.77-acre lot in the peaceful community of Winnsboro, SC. This property offers an exceptional layout for comfortable family living and rural tranquility. Key Features You'll Love: Generous Living Space: Enjoy a sprawling interior with 2,052 square feet of living area, including 4 well-appointed bedrooms and 2 full bathrooms. Master Suite Advantage: The master bedroom features a unique layout, additional flex space that could serve as a private nursery, a dedicated home office, or a quiet sitting
Key facts
- 2.77 acres
- 2.77 acre lot
- Built 2001
Tags
Property features AI
Exterior
- Utilities: Public water; Septic sewer
- Home design: Single-family property
- Construction: Crawlspace foundation
- Exterior features: Vinyl exterior; Paved road access; Approximately 2.77 acres
Interior
- Bedrooms: Primary bedroom on the main level
- Bathrooms: Two full bathrooms
- Heating & cooling: Central heating; Central cooling; Total heated area approximately 2,052
- Interior features: One fireplace
Neighborhood map
What this means for you Summary
Snapshot
- This is a 4-bed/2.0-bath manufactured listed at $110k.
Deal economics
- At list price, monthly cash flow is $236 ($3k/yr) — positive.
- The deal already cash-flows at list — no discount required.
- Meets the 1% rule at list price ($1k rent vs $110k).
- Recommended offer: $97k (12.0% below list) — sets the bar for market timing.
Location & tenants
- Location reads 54/100 on livability (#320 in SC) — a working-class tenant base; expect higher turnover. Strengths: cost of living A+; Watch: housing D, amenities F, commute F.
- Fairfield 01 (rural): math 26% / reading 38% proficiency, ranked #53 of 80 in SC (top 66%) — families likely to look elsewhere, expect single-tenant / working-renter base with shorter leases; 80% free/reduced lunch — lower-income household profile, screen leases tightly.
- Zoned schools: Fairfield Elementary (math 16% / reading 17%, grade F, #535 of 597 statewide, top 90%, 463 students, 100% FRL); Fairfield Central High (math 37% / reading 77%, grade C, #120 of 196 statewide, top 64%, 662 students, 100% FRL) — zoned schools average 100% FRL vs 80% district-wide (20 pts higher); higher-poverty schools than district average — tighter screening recommended.
- Market conditions: 1 active listings in the ZIP; 91 units permitted in Fairfield County in 2024 (0 in 5+ unit buildings).
Forward outlook
- In year one you build about $4k of equity ($761 loan paydown + $3k appreciation (3.0% local appreciation)).
- Fairfield County population projected at -32% by 2050 — secular population decline; favor cash flow + early exit over multi-decade hold.
- At projected returns (3.0% appreciation + 3.0% rent growth), your $31k cash investment doubles in ~5 years — after that, you're playing with house money.
- By year 8, paydown + projected appreciation supports a ~$30k cash-out refi (75% LTV) — recoverable capital for the next deal without selling this one.
Negotiation context
- It's been on market 167 days — a 12% lower offer ($97k) is reasonable based on typical stale-listing flexibility.
- 3 sale attempts; this cycle's ask has dropped $30k (21%) from the opening price — seller is motivated, your offer sets the floor, not the list.
- Current owner paid $17k; list at $110k implies a 547% gain — meaningful room to come down on a strong offer.
Risks & watch-outs
- Climate carrying-cost: major wind risk, 46% chance of damaging wind over 30y; extreme-heat days projected 7→15/yr by 2055 (HVAC capex compounding) — expect insurance premiums to compound above CPI over the hold.
Questions for the listing agent
- It's been on market 167 days. Have you received any prior offers? Is the seller open to a 12% concession, seller financing, or rate buy-down credit?
- Why hasn't it sold? Are there any deal-killer items the seller is aware of (foundation, flood, title, zoning, code violations)?
- Is there a deadline driving the sale (1031 exchange, divorce, estate, relocation)? That informs how much negotiation room exists.
- Schools are F-rated, which usually means shorter tenancies and higher turnover. Who's the typical renter profile here, and what's been the actual vacancy rate?
- What's the average days-on-market for RENTAL listings here right now (not sales)? A rising rental-DOM trend means longer vacancies and softer asking-rent achievability than the comps imply.
- What's the recent tenant-quality profile in this submarket — average credit score on applications, eviction rate, late-payment / NSF rate, and stable-employment percentage? A property-management company in the area should have these aggregated.
- How much new for-sale + rental construction is in the pipeline within 1–3 miles? Heavy new supply typically softens prices + rents 12–24 months out; constrained supply supports both.
Investment metrics
- 1% rule
- 1.17% ✓
- Cap rate
- 8.86%
- Cash-on-cash
- 9.18%
- DSCR
- 1.41
- GRM
- 7.1
CMA / ARV
No comps found within radius.
Projected returns pro-forma
3.0% appreciation · 3.0% rent growth · sell at horizon
- IRR
- 16.1%
- Equity multiple
- 1.92×
- Total profit
- $28,285
- Equity at exit
- $49,461
- IRR
- 17.7%
- Equity multiple
- 3.59×
- Total profit
- $79,737
- Equity at exit
- $76,225
Cash invested: $30,800 (down + closing). Projections, not guarantees.
Landlord ↔ Tenant lean methodology
- Overall (STATE)
- 90 Strongly Landlord-Friendly
- State South Carolina
- 90 Strongly Landlord-Friendly · R+6
- County
- — inherits STATE
- City
- — inherits STATE
ZIP-level market 29180-6805
- Active inventory
- 1
- Price-to-rent
- 7.1×
Monthly cashflow live
- Estimated rent
- $1,292 medium interval (Pro) →
- Mortgage (P&I)
- −$577
- Tax from tax record
- −$162 /mo · $1,946/yr
- Insurance
- −$46
- HOA
- −$0
- Vacancy / Maint / Mgmt
- −$271
- Net cashflow
- $236
Break-even live
UW: 25.0% down · 7.5% · 30yr · 1.5% tax · 5.0% vac · 8.0% maint · 8.0% mgmt
Financing live
Cash to close
- Down payment
- $27,500
- Closing costs
- $3,300
- Reserves months
- —
- Total cash needed
- —
Loan-product check · same deal, 3 products live
Conventional
25% down · 7.5% · 30yr
- Down + closing
- —
- Monthly P&I
- —
- Monthly cashflow
- —
- DSCR
- —
- Eligible?
- —
Personal DTI + credit; lowest rate.
DSCR
20% down · 8.5% · 30yr
- Down + closing
- —
- Monthly P&I
- —
- Monthly cashflow
- —
- DSCR
- —
- Eligible?
- —
No personal income docs; deal must DSCR.
Hard money
10% down · 12.0% · 12mo
- Down + closing
- —
- Monthly P&I
- —
- Monthly cashflow
- —
- DSCR
- —
- Eligible?
- —
Short-term bridge; refi at stabilization.
Listing history 25 events
-
2026-06-18days on market $110,000 Active 167 DOM
-
2026-06-17days on market $110,000 Active 166 DOM
-
2026-06-16days on market $110,000 Active 165 DOM
-
2026-06-15days on market $110,000 Active 164 DOM
-
2026-06-14days on market $110,000 Active 162 DOM
-
2026-06-13pricedays on market $110,000 Active 161 DOM
-
2026-06-10days on market $115,000 Active 159 DOM
-
2026-06-09days on market $115,000 Active 158 DOM
-
2026-06-08days on market $115,000 Active 157 DOM
-
2026-06-07days on market $115,000 Active 156 DOM
-
2026-06-03days on market $115,000 Active 152 DOM
-
2026-06-03days on market $115,000 Active 151 DOM
-
2026-06-01days on market $115,000 Active 150 DOM
-
2026-05-31days on market $115,000 Active 149 DOM
-
2026-05-24status Active
-
2026-05-09status Pending
-
2026-04-24historical Active - Contingent
-
2026-04-15price $115,000
-
2026-03-23status Active
-
2026-03-14status Pending
-
2026-03-07price $125,000
-
2026-02-27price $130,000
-
2026-01-09price $135,000
-
2025-12-08$140,000 Active
-
2001-05-15soldstatus $17,000
ⓘ Source: listings_history table (triggers on properties + properties_extension) + one-shot
backfill from property_details.listing_events for pre-trigger history.
Tax reassessment forecast SC · Resets to sale price
- Current annual tax
- $1,946 · $162/mo
- Projected year-2 tax
- $1,946 · $162/mo
- Expected delta
- $0/yr ($0/mo · 0.0%)
ⓘ Screening estimate from a state-policy table — verify with the county assessor before closing.
Climate risk First Street
- Flood 1/10 Low FEMA zone X (unshaded) · 0% chance over 30 yrs
- Wildfire 4/10 Moderate
- Heat 6/10 Major 7 d/yr ≥107°F today · 15 d/yr by 30 yrs out
- Wind 6/10 Major 46% chance of damaging wind over 30 yrs
- Air quality 2/10 Low 1 unhealthy d/yr today · 1 by 30 yrs out
Nearby sold comps map
Loading sold comps map…
Walkable amenities ~0.75 mi
Loading nearby amenities…
Taxation est. · year 1
- Rental income
- $15,500
- − Mortgage interest
- −$6,162
- − Property taxes
- −$1,946
- − Insurance
- −$550
- − Repairs & maintenance
- −$1,240
- − Management
- −$1,240
- − Depreciation
- −$3,200
- Taxable income
- $1,162
- Est. tax owed @ 24.0%
- −$279
- After-tax cash flow
- $2,547/yr
For passive investors: Depreciation is non-cash, so a rental often shows a tax loss while cash-flowing — sheltering income. Rental losses are passive: they offset passive income freely, and up to $25,000/yr can offset ordinary (W-2) income if you actively participate and your MAGI is under $100k (phasing out to $0 by $150k); unused losses carry forward. On sale, claimed depreciation is recaptured at up to 25%, and gains may owe capital-gains tax (a 1031 exchange can defer both). Figures are a year-1 estimate at your 24.0% rate — not tax advice; consult a CPA.
Schools (NCES district)
- District
- Fairfield 01
- NCES district ID
- 4502100
- Math proficiency
- 26% ▼ -10.00%
- Reading proficiency
- 38% ▲ 4.00%
- Median HH income
- $34,836
- Composite
- 26.37/100
- National rank
- #7232
- State rank
- #53 of 80 in SC
Livability — Winnsboro
- Score
- 54/100
- State rank
- #320
- US rank
- #23801
Category grades
Schools grade is shown separately in the Schools card above.
Census & demographics
No demographic data for this ZIP.
Market trends
- HPI YoY
- —
- Current HPI
- —
- Rent YoY
- —
- Metro
- —
- State GDP YoY
- ▲ 4.51%
- F500 in state
- 2
Industry mix (Fortune 500 HQ in SC)
| Industry | F500 HQs | Revenue |
|---|---|---|
| Packaging | 1 | $7B |
|
||
Price history
+576.5% since first listed11 events — show timeline
- 2026-05-24 Relisted — Consolidated MLS
- 2026-05-09 Pending — Consolidated MLS
- 2026-04-24 Contingent — Consolidated MLS
- 2026-04-15 Price Changed $115,000 Consolidated MLS
- 2026-03-23 Relisted — Consolidated MLS
- 2026-03-14 Pending — Consolidated MLS
- 2026-03-07 Price Changed $125,000 Consolidated MLS
- 2026-02-27 Price Changed $130,000 Consolidated MLS
- 2026-01-09 Price Changed $135,000 Consolidated MLS
- 2025-12-08 Listed $140,000 Consolidated MLS
- 2001-05-15 Sold (Public Records) $17,000 Public Records
Property tax history
+13.4%/yrLatest (2025): $1,946 · +18.7% YoY. Source: county tax records.
Cash-flow waterfall
monthlySold comps — $/sqft
last 12 mo · ≤1 miLoading sold comps…