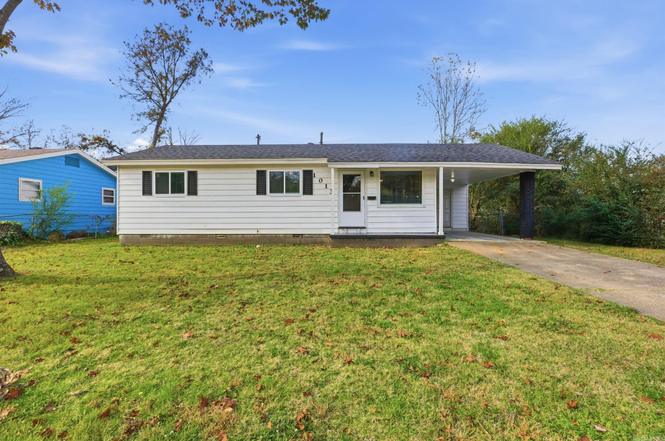
1013 Graham Ave · North Little Rock, AR
Flood risk 1/10 · Minimal
- FEMA flood zone
- AH
- Chance of flooding over 30 yrs
- 0.0%
- Est. flood insurance / yr
- $1,142 – $2,507
Fire risk 3/10 · Minor
- Est. fire insurance / yr
- $1,499 – $2,785
Heat risk 7/10 · Major
- Hot days now (above 110°F)
- 7 days/yr
- Hot days in 30 yrs
- 19 days/yr
Wind risk 4/10 · Minor
- Chance of severe wind over 30 yrs
- 9.0%
Air-quality risk 2/10 · Minimal
- Unhealthy air days now
- 2 days/yr
- Unhealthy air days in 30 yrs
- 2 days/yr
Risk factors via First Street. Map © Google.
Why this score? — see what drove the D+ grade
The composite is a weighted blend of 9 inputs, each scored 0–100. Each bar is that input's sub-score; the figure is the points it added to the 100-point composite (weight × sub-score).
- Cash flow +22.7/30.0
- DSCR +7.3/10.0
- 1% rule +5.0/10.0
- Livability +3.7/5.0
- Rent growth +2.5/5.0
- Condition / age +2.5/5.0
- Schools +2.0/10.0
- ARV discount +0.0/15.0
- Appreciation +0.0/10.0
$114,900
🖨 Deal sheet (PDF) 📄 Offer letter ✓ Due diligence
Listing remarks
Completely refreshed and ready for its next owner! This charming 3-bedroom, 1-bath home offers affordability without sacrificing peace of mind. Major updates include structural beam repairs, updated plumbing and sewer line repairs, HVAC system improvements, electrical panel repairs, replacement of floor soft spots, and extensive exterior repairs including siding, gutters, and wood replacement. Inside, you'll find a bright, functional layout with modern touches and move-in-ready appeal. Whether you're a first-time homebuyer, downsizer, or investor looking for a solid addition to your portfolio, this home delivers value, comfort, and confidence. Conveniently located near shopping, schools, an
Key facts
- Durable flooring
- Fresh paint
- Move in ready
Tags
Property features AI
Finance
- Financial info: Financing available: VA, FHA, Conventional, or Cash
Exterior
- Parking: Carport for 1 car
- Utilities: Public water; Municipal electric service (Entergy); Natural gas
- Home design: Metal/vinyl siding
- Construction: Composition roof; Crawl space foundation
- Exterior features: Patio; Fully fenced yard with chain link fence; Paved road access; Level lot; Inside city limits
Interior
- Kitchen: Free-standing stove; Electric range
- Flooring: Vinyl flooring
- Bathrooms: 1 full bathroom
- Heating & cooling: Central gas heating; Central gas cooling
- Interior features: Washer connection; Electric dryer connection; Granite slab kitchen countertops; Sheetrock walls/ceilings; Wood-burning site-built fireplace; Additional fireplace details noted in remarks
- Laundry & utility: Laundry room; Washer connection; Electric dryer connection
Neighborhood map
What this means for you Summary
Snapshot
- This is a 3-bed/2.0-bath single-family listed at $115k.
Deal economics
- At list price, monthly cash flow is $46 ($550/yr) — positive.
- The deal already cash-flows at list — no discount required.
- Meets the 1% rule at list price ($1k rent vs $115k).
- Recommended offer: $113k (1.5% below list) — sets the bar for market timing.
- Cap rate 8.4% vs local median 5.0% in North Little Rock — top-decile yield for the area; either an underpriced asset or a hidden risk that comps aren't pricing in. Stress-test before assuming the spread holds.
Location & tenants
- Location reads 73/100 on livability (#24 in AR) — a middle-class / working-renter tenant base. Strengths: commute A+, cost of living A+, housing A+; Watch: crime F, amenities F, employment D-.
- N. Little Rock School District (urban): math 21% / reading 26% proficiency, ranked #191 of 238 in AR (top 80%) — low school quality limits family demand, transient renter base, plan for 1-2y turnover; 66% free/reduced lunch — lower-income household profile, screen leases tightly.
- Zoned schools: Meadow Park Elementary School (math 17% / reading 17%, grade F, #398 of 454 statewide, top 89%, 499 students, 100% FRL); Lakewood Middle School (math 23% / reading 32%, grade F, #155 of 201 statewide, top 77%, 1,115 students, 100% FRL); North Little Rock High School (math 12% / reading 26%, grade F, #248 of 292 statewide, top 86%, 1,949 students, 100% FRL) — zoned schools average 100% FRL vs 66% district-wide (33 pts higher); higher-poverty schools than district average — tighter screening recommended.
- Market conditions: 83 active listings in the ZIP; 19 comparable units currently listed for rent nearby; rentals at typical pace (median 25d on market — plan ~3-4 weeks tenant-placement turnaround); 42% of comp listings sitting > 30 days — soft ceiling on asking rent; 1,006 units permitted in Pulaski County in 2024 (0 in 5+ unit buildings).
Forward outlook
- Local home prices are declining (-3.0%/yr); year-one equity from $794 of loan paydown is wiped out by about $3k of value loss. Plan a longer hold.
- Pulaski County population projected at +6% by 2050 — modest demand growth; plan on rents tracking national, not racing it.
Negotiation context
- It's been on market 26 days — a 2% lower offer ($113k) is reasonable based on typical stale-listing flexibility.
- 4 sale attempts since 3y ago; this cycle's ask is 5% above the opening price — seller raised mid-cycle; expect resistance to lowballs.
Risks & watch-outs
- Watch-outs: flood insurance adds $152/mo.
- Climate carrying-cost: in FEMA flood zone AH (mandatory federal flood insurance); extreme-heat days projected 7→19/yr by 2055 (HVAC capex compounding) — expect insurance premiums to compound above CPI over the hold.
Questions for the listing agent
- Built in 1965 — when were the roof, HVAC, electrical panel, plumbing, and water heater last replaced?
- What's the actual annual flood-insurance premium (NFIP or private), and is the property in a SFHA with mandatory coverage?
- Is there a deadline driving the sale (1031 exchange, divorce, estate, relocation)? That informs how much negotiation room exists.
- Schools are D-rated, which usually means shorter tenancies and higher turnover. Who's the typical renter profile here, and what's been the actual vacancy rate?
- Crime grade is F in this area — have there been break-ins, vandalism, or insurance claims at this property in the last 3 years? What carrier currently insures it and at what premium?
- The area grade is low — what's the realistic commute time and amenity access for the typical tenant pool here? Any planned neighborhood developments (good or bad) we should know about?
- What's the average days-on-market for RENTAL listings here right now (not sales)? A rising rental-DOM trend means longer vacancies and softer asking-rent achievability than the comps imply.
- What's the recent tenant-quality profile in this submarket — average credit score on applications, eviction rate, late-payment / NSF rate, and stable-employment percentage? A property-management company in the area should have these aggregated.
- How much new for-sale + rental construction is in the pipeline within 1–3 miles? Heavy new supply typically softens prices + rents 12–24 months out; constrained supply supports both.
Investment metrics
- 1% rule
- 1.00% ✓
- Cap rate
- 8.36%
- Cash-on-cash
- 7.38%
- DSCR
- 1.33
- GRM
- 8.3
CMA / ARV
- ARV (on-the-fly)
- $97,328
- Comps found
- 12
Show comp detail 12 sales within ~0.75 mi
| Address | Dist | Beds/Ba | Sqft | Sold | Price | $/sf | Match |
|---|---|---|---|---|---|---|---|
| 928 Healy St | 0.16mi | 3/1.0 | 1,196 (-3%) | 5mo | $52,000 | $43 | 79 |
| 4913 Page Mill Rd | 0.42mi | 3/2.0 | 1,260 (+2%) | 3mo | $127,000 | $101 | 74 |
| 905 Roseclair Dr | 0.18mi | 3/1.0 | 1,176 (-4%) | 10mo | $105,000 | $89 | 72 |
| 702 Blossom St | 0.35mi | 4/1.0 (+1) | 1,223 (-1%) | 10mo | $39,000 | $32 | 65 |
| 704 Graham Ave | 0.28mi | 3/2.0 | 1,115 (-10%) | 12mo | $181,000 | $162 | 62 |
| 36 Goodwin Cir | 0.58mi | 3/1.5 | 1,226 (-0%) | 11mo | $144,000 | $117 | 61 |
| 5701 Alpha St | 0.32mi | 4/2.0 (+1) | 1,360 (+10%) | 6mo | $7,000 | $5 | 58 |
| 424 Healy St | 0.50mi | 3/1.0 | 1,122 (-9%) | 4mo | $34,000 | $30 | 55 |
| 500 Kay St | 0.52mi | 3/2.0 | 1,344 (+9%) | 14mo | $20,000 | $15 | 49 |
| 5216 Lynch Dr | 0.43mi | 2/1.0 (-1) | 1,081 (-12%) | 2mo | $85,000 | $79 | 49 |
| 5202 S Woodland Dr | 0.67mi | 4/2.0 (+1) | 1,106 (-10%) | 5mo | $130,000 | $118 | 43 |
| 1517 Ben St | 0.73mi | 2/1.0 (-1) | 1,092 (-11%) | 14mo | $19,000 | $17 | 26 |
Match score weights: distance 35% · size 25% · config 20% · recency 20%. Top-matched comps best support the ARV.
Projected returns pro-forma
-3.0% appreciation · 3.0% rent growth · sell at horizon
- IRR
- -13.5%
- Equity multiple
- 0.51×
- Total profit
- $-15,639
- Equity at exit
- $17,132
- IRR
- -4.5%
- Equity multiple
- 0.70×
- Total profit
- $-9,616
- Equity at exit
- $9,934
Cash invested: $32,172 (down + closing). Projections, not guarantees.
Landlord ↔ Tenant lean methodology
- Overall (STATE)
- 92 Strongly Landlord-Friendly
- State Arkansas
- 92 Strongly Landlord-Friendly · R+14
- County
- — inherits STATE
- City
- — inherits STATE
ZIP-level market 72117
- Home prices YoY
- -30.4%
- Active inventory
- 83
- Price-to-rent
- 8.3×
Monthly cashflow live
- Estimated rent
- $1,150 high interval (Pro) →
- Mortgage (P&I)
- −$603
- Tax from tax record
- −$60 /mo · $723/yr
- Insurance
- −$48
- Flood insurance flood zone
- −$152 /mo · $1,824/yr
- HOA
- −$0
- Vacancy / Maint / Mgmt
- −$242
- Net cashflow
- $46
Break-even live
Sensitivity live
| Price | -10% $111 | -5% $78 | +0% $46 | +5% $13 | +10% $-19 |
|---|---|---|---|---|---|
| Rent | -10% $-45 | -5% $0 | +0% $46 | +5% $91 | +10% $137 |
| Rate | -1.0pp $104 | -0.5pp $75 | base $46 | +0.5pp $16 | +1.0pp $-14 |
UW: 25.0% down · 7.5% · 30yr · 1.5% tax · 5.0% vac · 8.0% maint · 8.0% mgmt
Financing live
Cash to close
- Down payment
- $28,725
- Closing costs
- $3,447
- Reserves months
- —
- Total cash needed
- —
Loan-product check · same deal, 3 products live
Conventional
25% down · 7.5% · 30yr
- Down + closing
- —
- Monthly P&I
- —
- Monthly cashflow
- —
- DSCR
- —
- Eligible?
- —
Personal DTI + credit; lowest rate.
DSCR
20% down · 8.5% · 30yr
- Down + closing
- —
- Monthly P&I
- —
- Monthly cashflow
- —
- DSCR
- —
- Eligible?
- —
No personal income docs; deal must DSCR.
Hard money
10% down · 12.0% · 12mo
- Down + closing
- —
- Monthly P&I
- —
- Monthly cashflow
- —
- DSCR
- —
- Eligible?
- —
Short-term bridge; refi at stabilization.
Rent comps 19 comps
| Address | Beds | Baths | Sqft | Rent | $/sqft | DOM | Units | Dist |
|---|---|---|---|---|---|---|---|---|
| 908 Greenlea Dr North Little Rock, AR | 3.0 | 1.0 | 912 | $1,300 | $1.43 | 23d | 1 | 0.16mi |
| 817 Greenlea Dr North Little Rock, AR | 3.0 | 1.0 | 912 | $1,195 | $1.31 | 25d | 1 | 0.20mi |
| 717 Greenlea Dr North Little Rock, AR | 3.0 | 1.0 | 912 | $1,095 | $1.20 | 45d | 1 | 0.26mi |
| 5204 Alpha St North Little Rock, AR | 3.0 | 1.0 | 753 | $850 | $1.13 | 45d | 1 | 0.39mi |
| 306 Boggs St North Little Rock, AR | 2.0 | 1.0 | 1000 | $850 | $0.85 | 25d | 1 | 0.72mi |
| 607 Prothro St North Little Rock, AR | 2.0 | 1.0 | 779 | $825 | $1.06 | 45d | 1 | 0.73mi |
| 515 Middle St North Little Rock, AR | 2.0 | 1.0 | 894 | $850 | $0.95 | 16d | 1 | 0.75mi |
| 2107 Muldrow Dr North Little Rock, AR | 3.0 | 1.0 | 900 | $1,015 | $1.13 | 45d | 1 | 0.78mi |
| 3 Neal Pl North Little Rock, AR | 3.0 | 1.0 | 1144 | $975 | $0.85 | 25d | 1 | 0.78mi |
| 3 Neal Pl North Little Rock, AR | 3.0 | 1.0 | 1144 | $975 | $0.85 | 45d | 1 | 0.78mi |
| 4701 Atkins St North Little Rock, AR | 2.0 | 1.0 | 892 | $925 | $1.04 | 20d | 1 | 0.88mi |
| 4820 Haywood St North Little Rock, AR | 4.0 | 2.0 | 1223 | $1,595 | $1.30 | 16d | 1 | 0.91mi |
| 4911 School St North Little Rock, AR | 4.0 | 2.0 | 1223 | $1,595 | $1.30 | 16d | 1 | 0.92mi |
| 4007 Rogers St North Little Rock, AR | 4.0 | 2.0 | 1157 | $1,595 | $1.38 | 45d | 1 | 0.92mi |
| 4912 School St North Little Rock, AR | 3.0 | 1.0 | 1056 | $950 | $0.90 | 25d | 1 | 0.94mi |
| 4716 School St North Little Rock, AR | 3.0 | 1.0 | 1347 | $1,150 | $0.85 | 45d | 1 | 1.00mi |
| 604 Ellen Dr North Little Rock, AR | 4.0 | 2.0 | 1114 | $1,550 | $1.39 | 16d | 1 | 1.01mi |
| 6617 Whippoorwill Ln North Little Rock, AR | 3.0 | 1.5 | 952 | $995 | $1.05 | 25d | 1 | 1.03mi |
| 6612 Whippoorwill Ln North Little Rock, AR | 3.0 | 1.5 | 952 | $1,075 | $1.13 | 45d | 1 | 1.03mi |
Listing history 9 events
-
2026-06-21statusdays on market $114,900 Active 26 DOM
-
2026-06-18days on market $114,900 Price Change 23 DOM
-
2026-06-17days on market $114,900 Price Change 22 DOM
-
2026-06-16days on market $114,900 Price Change 21 DOM
-
2026-06-16remarks 699-char remark
-
2026-06-15days on market $114,900 Price Change 20 DOM
-
2026-06-14days on market $114,900 Price Change 18 DOM
-
2026-06-13remarks 556-char remark
-
2026-06-13$114,900 Price Change 17 DOM
ⓘ Source: listings_history table (triggers on properties + properties_extension) + one-shot
backfill from property_details.listing_events for pre-trigger history.
Tax reassessment forecast AR · Resets to sale price
- Current annual tax
- $723 · $60/mo
- Projected year-2 tax
- $735 · $61/mo
- Expected delta
- +$12/yr (+$1/mo · 1.7%)
ⓘ Screening estimate from a state-policy table — verify with the county assessor before closing.
Climate risk First Street
- Flood 1/10 Low FEMA zone AH · 0% chance over 30 yrs
- Wildfire 3/10 Moderate
- Heat 7/10 Severe 7 d/yr ≥110°F today · 19 d/yr by 30 yrs out
- Wind 4/10 Moderate 9% chance of damaging wind over 30 yrs
- Air quality 2/10 Low 2 unhealthy d/yr today · 2 by 30 yrs out
Nearby sold comps map
Loading sold comps map…
Walkable amenities ~0.75 mi
Loading nearby amenities…
Taxation est. · year 1
- Rental income
- $13,801
- − Mortgage interest
- −$6,436
- − Property taxes
- −$723
- − Insurance
- −$2,399
- − Repairs & maintenance
- −$1,104
- − Management
- −$1,104
- − Depreciation
- −$3,343
- Taxable loss
- −$1,308
- Est. tax savings @ 24.0%
- +$314
- After-tax cash flow
- $864/yr
For passive investors: Depreciation is non-cash, so a rental often shows a tax loss while cash-flowing — sheltering income. Rental losses are passive: they offset passive income freely, and up to $25,000/yr can offset ordinary (W-2) income if you actively participate and your MAGI is under $100k (phasing out to $0 by $150k); unused losses carry forward. On sale, claimed depreciation is recaptured at up to 25%, and gains may owe capital-gains tax (a 1031 exchange can defer both). Figures are a year-1 estimate at your 24.0% rate — not tax advice; consult a CPA.
Schools (NCES district)
- District
- N. Little Rock School District
- NCES district ID
- 0510680
- Math proficiency
- 21% ▼ -11.00%
- Reading proficiency
- 26% ▼ -9.00%
- Median HH income
- $38,325
- Composite
- 19.69/100
- National rank
- #8728
- State rank
- #191 of 238 in AR
Livability — North Little Rock
- Score
- 73/100
- State rank
- #24
- US rank
- #5452
Category grades
Schools grade is shown separately in the Schools card above.
Census & demographics
- Census place
- North Little Rock, AR
- City population
- 55,470
- Population (ZIP)
- 14,339
Population outlook (Pulaski County) Hauer SSP2
- Today (2025)
- 415,378 people
- By 2030
- 423,720 · +2.0%
- By 2040
- 435,182 · +4.8%
- By 2050
- 440,904 · +6.1%
- By 2075
- 445,521 · +7.3%
- By 2100
- 419,173 · +0.9%
Race, ethnicity, and origin ACS 2023
- Neighborhood character
- Majority Black (63%)
- Race & ethnicity
- Black 63% White 24% Two or more races 7% Hispanic / Latino 5%
- Hispanic origin (detail)
- Mexican 5%
- Common ancestry
- Serbian 1% Slovak 1% Lithuanian 0%
- Foreign-born
- 3% · Canada
- Languages at home
- 95% English-only · Spanish 4%
Political lean MEDSL · Pulaski
- 2024 margin
- Strong D (+22.1) · D 59.8% · R 37.7% · Other 2.5%
- 2008→2024 swing
- +10.6pp toward D · 2008: 11.6pp · 2024: 22.1pp
- All cycles
- 2024: D+22.1 2020: D+22.5 2016: D+17.9 2012: D+11.4 2008: D+11.6
Not yet ingested
- Civics
- —
Market trends
- HPI YoY
- ▼ -53.78%
- Current HPI
- 123.3727
- Rent YoY
- —
- Metro
- —
- State GDP YoY
- ▲ 3.80%
- F500 in state
- 10
Industry mix (Fortune 500 HQ in AR)
| Industry | F500 HQs | Revenue |
|---|---|---|
| Retail | 1 | $681B |
|
||
| Food / Agriculture | 1 | $53B |
|
||
| Retail / Energy | 1 | $22B |
|
||
| Transportation / Logistics | 1 | $12B |
|
||
| Energy | 1 | $4B |
|
||
Price history
+4.5% since first listed11 events — show timeline
- 2026-06-12 Price Changed $114,900 CARMLS
- 2026-06-12 Relisted — CARMLS
- 2026-04-16 Listing Removed — CARMLS
- 2026-04-03 Contingent — CARMLS
- 2026-03-25 Listed $109,900 CARMLS
- 2026-02-18 Listing Removed — CARMLS
- 2025-12-14 Price Changed $115,000 CARMLS
- 2025-11-25 Listed $117,500 CARMLS
- 2023-10-03 Listing Removed — CARMLS
- 2023-08-16 Price Changed $99,900 CARMLS
- 2023-07-09 Listed $109,900 CARMLS
Property tax history
+6.2%/yrLatest (2025): $723 · +14.1% YoY. Source: county tax records.
Cash-flow waterfall
monthlySold comps — $/sqft
last 12 mo · ≤1 miLoading sold comps…