 8-Plex
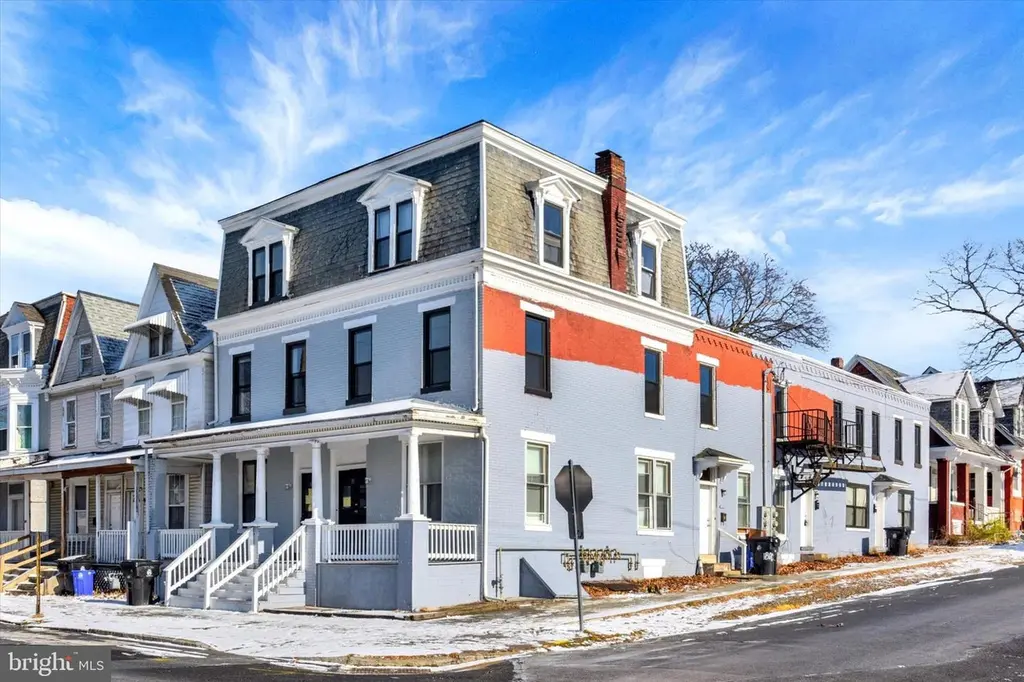
31-33 S 18th St · Harrisburg, PA
Flood risk 1/10 · Minimal
- FEMA flood zone
- X (unshaded)
- Chance of flooding over 30 yrs
- 0.0%
- Est. flood insurance / yr
- $473 – $860
Fire risk 1/10 · Minimal
- Est. fire insurance / yr
- $511 – $949
Heat risk 5/10 · Moderate
- Hot days now (above 100°F)
- 7 days/yr
- Hot days in 30 yrs
- 15 days/yr
Wind risk 3/10 · Minor
- Chance of severe wind over 30 yrs
- 6.0%
Air-quality risk 2/10 · Minimal
- Unhealthy air days now
- 1 days/yr
- Unhealthy air days in 30 yrs
- 3 days/yr
Risk factors via First Street. Map © Google.
Why this score? — see what drove the C+ grade
The composite is a weighted blend of 9 inputs, each scored 0–100. Each bar is that input's sub-score; the figure is the points it added to the 100-point composite (weight × sub-score).
- Cash flow +29.1/30.0
- DSCR +10.0/10.0
- ARV discount +7.5/15.0
- 1% rule +7.0/10.0
- Livability +4.2/5.0
- Rent growth +3.6/5.0
- Condition / age +2.5/5.0
- Schools +0.8/10.0
- Appreciation +0.0/10.0
$739,900
🖨 Deal sheet 📄 Offer letter ✓ Due diligence
Multi-family units
County records classify this as Multi-Family (5+ Unit). Listing-text estimate: 8 units. confirmed
5+ unit building — per-unit beds/baths from public records are typically unavailable; the breakdown below (if shown) is an estimate from the listing text.
Listing remarks MLS
Investor Opportunity! Renovated 8-unit apartment building situated on a desirable corner lot, offering strong visibility and long-term rental appeal. The majority of the property has been updated, featuring new flooring, fresh neutral paint, recessed lighting, and updated kitchens and bathrooms throughout many of the units. The unit mix provides an excellent balance, consisting of a combination of 2-bedroom/1-bath apartments, 1-bedroom/1-bath apartments and studio units, appealing to a wide range of tenants and supporting consistent occupancy. Kitchens have been updated with modern finishes, and bathrooms have been refreshed for a clean, contemporary look. Tenant-paid utilities include electricity and electric heat. Owner pays water, sewer, and trash. The corner location enhances accessibility and curb appeal, contributing to tenant demand. This property presents a solid opportunity for investors seeking a stabilized or value-add asset with recent improvements already in place and room for continued upside through remaining updates, rent optimization, or operational efficiencies. Conveniently located near local amenities, transportation routes, and everyday services. A strong addition to any investment portfolio. Schedule your showing today!
Key facts
- Strong visibility
- Updated bathrooms
- Modern finishes
Tags
Neighborhood map
What this means for you Summary
Snapshot
- This is a 4×2bd/1ba + 3×1bd/1ba + 1×?bd/1ba units multifamily listed at $740k.
Deal economics
- At list price, monthly cash flow is $3k ($31k/yr) — positive. Per door: $320/mo.
- The deal already cash-flows at list — no discount required.
- Meets the 1% rule at list price ($9k rent vs $740k).
- Recommended offer: $651k (12.0% below list) — sets the bar for market timing.
- Cap rate 10.4% vs local median 6.6% in Harrisburg — top-decile yield for the area; either an underpriced asset or a hidden risk that comps aren't pricing in. Stress-test before assuming the spread holds.
Location & tenants
- Location reads 84/100 on livability (#107 in PA, #826 nationally) — a professional / high-income tenant draw. Strengths: amenities A+, commute A+, cost of living A+; Watch: schools C-, employment D, crime F.
- Harrisburg City SD (urban): math 6% / reading 13% proficiency, ranked #535 of 539 in PA (top 99%) — low school quality limits family demand, transient renter base, plan for 1-2y turnover; 82% free/reduced lunch — lower-income household profile, screen leases tightly.
- Market conditions: Rents rising fast (+4.4%/yr); 67 active listings in the ZIP; 540 units permitted in Dauphin County in 2024 (194 in 5+ unit buildings).
- At $8,860/mo this rent would consume 229% of the median local household income ($47k/yr) (locally 1166% of renters already pay >50% of income on rent) — very limited rent-growth headroom before tenants either downsize or default.
Forward outlook
- Local home prices are declining (-3.0%/yr); year-one equity from $5k of loan paydown is wiped out by about $22k of value loss. Plan a longer hold.
- At projected returns (-3.0% appreciation + 4.4% rent growth), your $207k cash investment doubles in ~8 years — after that, you're playing with house money.
Negotiation context
- It's been on market 176 days — a 12% lower offer ($651k) is reasonable based on typical stale-listing flexibility.
- 2 sale attempts since 20y ago; this cycle's ask has dropped $60k (8%) from the opening price — seller is motivated, your offer sets the floor, not the list.
- Current owner paid $310k; list at $740k implies a 139% gain — meaningful room to come down on a strong offer.
Risks & watch-outs
- Watch-outs: built in 1910 — expect roof / HVAC / electrical / plumbing capex.
- Climate carrying-cost: extreme-heat days projected 7→15/yr by 2055 (HVAC capex compounding) — expect insurance premiums to compound above CPI over the hold.
Questions for the listing agent
- It's been on market 176 days. Have you received any prior offers? Is the seller open to a 12% concession, seller financing, or rate buy-down credit?
- Can we see the unit-by-unit rent roll, current vacancy, and any below-market leases? What's the average tenancy length?
- What capital expenditures (roof, boiler, parking lot, exteriors) have been made in the last 5 years, and what's planned in the next 2?
- Built in 1910 — when were the roof, HVAC, electrical panel, plumbing, and water heater last replaced?
- Why hasn't it sold? Are there any deal-killer items the seller is aware of (foundation, flood, title, zoning, code violations)?
- Is there a deadline driving the sale (1031 exchange, divorce, estate, relocation)? That informs how much negotiation room exists.
- Crime grade is F in this area — have there been break-ins, vandalism, or insurance claims at this property in the last 3 years? What carrier currently insures it and at what premium?
- What's the average days-on-market for RENTAL listings here right now (not sales)? A rising rental-DOM trend means longer vacancies and softer asking-rent achievability than the comps imply.
- What's the recent tenant-quality profile in this submarket — average credit score on applications, eviction rate, late-payment / NSF rate, and stable-employment percentage? A property-management company in the area should have these aggregated.
- How much new apartment / multifamily construction is in the pipeline within 1–3 miles? Heavy new supply (>2% of stock underway) typically softens rents 12–24 months out; light construction supports rent growth.
Investment metrics
- 1% rule
- 1.20% ✓
- Cap rate
- 10.45%
- Cash-on-cash
- 14.84%
- DSCR
- 1.66
- GRM
- 7.0
CMA / ARV
- ARV (median comp)
- $211,150
- List price
- $739,900
- Delta
- 250.41%
- Verdict
- OVERPRICED
- Comps
- 4 within 1.0 mi
Projected returns pro-forma
-3.0% appreciation · 4.43% rent growth · sell at horizon
- IRR
- 6.8%
- Equity multiple
- 1.27×
- Total profit
- $55,878
- Equity at exit
- $110,321
- IRR
- 17.3%
- Equity multiple
- 2.51×
- Total profit
- $312,190
- Equity at exit
- $63,973
Cash invested: $207,172 (down + closing). Projections, not guarantees.
Landlord ↔ Tenant lean methodology
- Overall (STATE)
- 62 Landlord-Friendly
- State Pennsylvania
- 62 Landlord-Friendly · EVEN
- County
- — inherits STATE
- City
- — inherits STATE
ZIP-level market 17104
- Home prices YoY
- -6.3%
- Rents YoY
- 4.4%
- Active inventory
- 67
- Price-to-rent
- 52.6×
Monthly cashflow live
- Estimated rent
- $8,860 high interval (Pro) →
- Mortgage (P&I)
- −$3,880
- Tax from tax record
- −$250 /mo · $2,997/yr
- Insurance
- −$308
- HOA
- −$0
- Vacancy / Maint / Mgmt
- −$1,861
- Net cashflow
- $2,561
Break-even live
8-unit breakdown (identical units grouped — click to expand)
| Units | Beds | Baths | Est. rent |
|---|---|---|---|
| 4× units | 2 | 1 | $4,684 |
| #1 | 2 | 1 | $1,171 |
| #2 | 2 | 1 | $1,171 |
| #3 | 2 | 1 | $1,171 |
| #4 | 2 | 1 | $1,171 |
| 3× units | 1 | 1 | $3,075 |
| #5 | 1 | 1 | $1,025 |
| #6 | 1 | 1 | $1,025 |
| #7 | 1 | 1 | $1,025 |
| 1× unit | 0 | 1 | $1,098 |
| Total (8 units) | $8,860 | ||
UW: 25.0% down · 7.5% · 30yr · 1.5% tax · 5.0% vac · 8.0% maint · 8.0% mgmt
Financing live
Cash to close
- Down payment
- $184,975
- Closing costs
- $22,197
- Reserves months
- —
- Total cash needed
- —
Loan-product check · same deal, 3 products live
Conventional
25% down · 7.5% · 30yr
- Down + closing
- —
- Monthly P&I
- —
- Monthly cashflow
- —
- DSCR
- —
- Eligible?
- —
Personal DTI + credit; lowest rate.
DSCR
20% down · 8.5% · 30yr
- Down + closing
- —
- Monthly P&I
- —
- Monthly cashflow
- —
- DSCR
- —
- Eligible?
- —
No personal income docs; deal must DSCR.
Hard money
10% down · 12.0% · 12mo
- Down + closing
- —
- Monthly P&I
- —
- Monthly cashflow
- —
- DSCR
- —
- Eligible?
- —
Short-term bridge; refi at stabilization.
Listing history 26 events
-
2026-06-18days on market $739,900 Active 176 DOM
-
2026-06-17days on market $739,900 Active 175 DOM
-
2026-06-16days on market $739,900 Active 174 DOM
-
2026-06-15days on market $739,900 Active 173 DOM
-
2026-06-14days on market $739,900 Active 171 DOM
-
2026-06-13days on market $739,900 Active 170 DOM
-
2026-06-10days on market $739,900 Active 168 DOM
-
2026-06-09days on market $739,900 Active 167 DOM
-
2026-06-08days on market $739,900 Active 166 DOM
-
2026-06-07days on market $739,900 Active 165 DOM
-
2026-06-03pricedays on market $739,900 Active 161 DOM
-
2026-06-02days on market $759,900 Active 160 DOM
-
2026-06-01days on market $759,900 Active 159 DOM
-
2026-05-31days on market $759,900 Active 158 DOM
-
2026-05-31days on market $759,900 Active 157 DOM
-
2026-04-02price $759,900 1261-char remark
Show marketing remark (1261 chars)
Investor Opportunity! Renovated 8-unit apartment building situated on a desirable corner lot, offering strong visibility and long-term rental appeal. The majority of the property has been updated, featuring new flooring, fresh neutral paint, recessed lighting, and updated kitchens and bathrooms throughout many of the units. The unit mix provides an excellent balance, consisting of a combination of 2-bedroom/1-bath apartments, 1-bedroom/1-bath apartments and studio units, appealing to a wide range of tenants and supporting consistent occupancy. Kitchens have been updated with modern finishes, and bathrooms have been refreshed for a clean, contemporary look. Tenant-paid utilities include electricity and electric heat. Owner pays water, sewer, and trash. The corner location enhances accessibility and curb appeal, contributing to tenant demand. This property presents a solid opportunity for investors seeking a stabilized or value-add asset with recent improvements already in place and room for continued upside through remaining updates, rent optimization, or operational efficiencies. Conveniently located near local amenities, transportation routes, and everyday services. A strong addition to any investment portfolio. Schedule your showing today!
-
2026-02-09price $779,900 1261-char remark
Show marketing remark (1261 chars)
Investor Opportunity! Renovated 8-unit apartment building situated on a desirable corner lot, offering strong visibility and long-term rental appeal. The majority of the property has been updated, featuring new flooring, fresh neutral paint, recessed lighting, and updated kitchens and bathrooms throughout many of the units. The unit mix provides an excellent balance, consisting of a combination of 2-bedroom/1-bath apartments, 1-bedroom/1-bath apartments and studio units, appealing to a wide range of tenants and supporting consistent occupancy. Kitchens have been updated with modern finishes, and bathrooms have been refreshed for a clean, contemporary look. Tenant-paid utilities include electricity and electric heat. Owner pays water, sewer, and trash. The corner location enhances accessibility and curb appeal, contributing to tenant demand. This property presents a solid opportunity for investors seeking a stabilized or value-add asset with recent improvements already in place and room for continued upside through remaining updates, rent optimization, or operational efficiencies. Conveniently located near local amenities, transportation routes, and everyday services. A strong addition to any investment portfolio. Schedule your showing today!
-
2025-12-24$800,000 Active 1261-char remark
Show marketing remark (1261 chars)
Investor Opportunity! Renovated 8-unit apartment building situated on a desirable corner lot, offering strong visibility and long-term rental appeal. The majority of the property has been updated, featuring new flooring, fresh neutral paint, recessed lighting, and updated kitchens and bathrooms throughout many of the units. The unit mix provides an excellent balance, consisting of a combination of 2-bedroom/1-bath apartments, 1-bedroom/1-bath apartments and studio units, appealing to a wide range of tenants and supporting consistent occupancy. Kitchens have been updated with modern finishes, and bathrooms have been refreshed for a clean, contemporary look. Tenant-paid utilities include electricity and electric heat. Owner pays water, sewer, and trash. The corner location enhances accessibility and curb appeal, contributing to tenant demand. This property presents a solid opportunity for investors seeking a stabilized or value-add asset with recent improvements already in place and room for continued upside through remaining updates, rent optimization, or operational efficiencies. Conveniently located near local amenities, transportation routes, and everyday services. A strong addition to any investment portfolio. Schedule your showing today!
-
2022-02-16soldstatus $310,000
-
2014-05-14soldstatus $67,500
-
2006-12-01soldstatus $150,000
-
2006-11-30soldstatus $150,000 212-char remark
Show marketing remark (212 chars)
Unit 6 is 1800 Chestnut. Unit 7 is 1802 Chestnut 1 BR $330. Unit 8 is 1804 Chestnut 1 BR $340. Tenants pay electric & heat. Fully rented! Units all renovated & in good condition! Excellent return.
-
2006-10-24historical 212-char remark
Show marketing remark (212 chars)
Unit 6 is 1800 Chestnut. Unit 7 is 1802 Chestnut 1 BR $330. Unit 8 is 1804 Chestnut 1 BR $340. Tenants pay electric & heat. Fully rented! Units all renovated & in good condition! Excellent return.
-
2006-09-05$169,900 212-char remark
Show marketing remark (212 chars)
Unit 6 is 1800 Chestnut. Unit 7 is 1802 Chestnut 1 BR $330. Unit 8 is 1804 Chestnut 1 BR $340. Tenants pay electric & heat. Fully rented! Units all renovated & in good condition! Excellent return.
-
2004-10-07soldstatus $160,000
-
1992-06-08soldstatus $90,500
ⓘ Source: listings_history table (triggers on properties + properties_extension) + one-shot
backfill from property_details.listing_events for pre-trigger history.
Tax reassessment forecast PA · Partial reset (capped growth)
- Current annual tax
- $2,997 · $250/mo
- Projected year-2 tax
- $7,344 · $612/mo
- Expected delta
- +$4,347/yr (+$362/mo · 145.0%)
ⓘ Screening estimate from a state-policy table — verify with the county assessor before closing.
Climate risk First Street
- Flood 1/10 Low FEMA zone X (unshaded) · 0% chance over 30 yrs
- Wildfire 1/10 Low
- Heat 5/10 Major 7 d/yr ≥100°F today · 15 d/yr by 30 yrs out
- Wind 3/10 Moderate 6% chance of damaging wind over 30 yrs
- Air quality 2/10 Low 1 unhealthy d/yr today · 3 by 30 yrs out
Nearby sold comps map
Loading sold comps map…
Walkable amenities ~0.75 mi
Loading nearby amenities…
Taxation est. · year 1
- Rental income
- $106,320
- − Mortgage interest
- −$41,446
- − Property taxes
- −$2,997
- − Insurance
- −$3,700
- − Repairs & maintenance
- −$8,506
- − Management
- −$8,506
- − Depreciation
- −$21,524
- Taxable income
- $19,642
- Est. tax owed @ 24.0%
- −$4,714
- After-tax cash flow
- $26,021/yr
For passive investors: Depreciation is non-cash, so a rental often shows a tax loss while cash-flowing — sheltering income. Rental losses are passive: they offset passive income freely, and up to $25,000/yr can offset ordinary (W-2) income if you actively participate and your MAGI is under $100k (phasing out to $0 by $150k); unused losses carry forward. On sale, claimed depreciation is recaptured at up to 25%, and gains may owe capital-gains tax (a 1031 exchange can defer both). Figures are a year-1 estimate at your 24.0% rate — not tax advice; consult a CPA.
Schools (NCES district)
- District
- Harrisburg City SD
- NCES district ID
- 4211580
- Math proficiency
- 6% ▼ -6.00%
- Reading proficiency
- 13% ▼ -10.00%
- Median HH income
- $33,432
- Composite
- 7.6/100
- National rank
- #9945
- State rank
- #535 of 539 in PA
Livability — Harrisburg
- Score
- 84/100
- State rank
- #107
- US rank
- #826
Category grades
Schools grade is shown separately in the Schools card above.
Census & demographics
- Census place
- Harrisburg, PA
- County
- Dauphin County · 247,857 people
- City population
- 184,296
- Metro
- Harrisburg-Carlisle, PA
- Population (ZIP)
- 18,541
- Household income
- $46,510
- Rent vs Own
- Severe rent burden
- 1166.0
Population outlook (Dauphin County) Hauer SSP2
- Today (2025)
- 281,628 people
- By 2030
- 283,549 · +0.7%
- By 2040
- 285,385 · +1.3%
- By 2050
- 286,188 · +1.6%
- By 2075
- 291,053 · +3.3%
- By 2100
- 282,374 · +0.3%
Race, ethnicity, and origin ACS 2023
- Neighborhood character
- Diverse neighborhood (Simpson 0.69)
- Race & ethnicity
- Black 44% Hispanic / Latino 29% White 19% Two or more races 12% Asian 3% Native American 1%
- Hispanic origin (detail)
- Puerto Rican 21% Dominican 6%
- Common ancestry
- Polish 1% Romanian 1% Slovak 1%
- Foreign-born
- 10% · Canada, China, Vietnam
- Languages at home
- 73% English-only · Spanish 21% Other Indo-European 1% Chinese 1%
Political lean MEDSL · Dauphin
- 2024 margin
- Lean D (+5.9) · D 52.4% · R 46.5% · Other 1.1%
- 2008→2024 swing
- -3.1pp toward R · 2008: 9.1pp · 2024: 5.9pp
- All cycles
- 2024: D+5.9 2020: D+8.5 2016: D+2.8 2012: D+6.0 2008: D+9.1
Not yet ingested
- Civics
- —
Market trends
- HPI YoY
- ▼ -22.83%
- Current HPI
- 340.2808
- Rent YoY
- ▲ 4.43%
- Metro
- Harrisburg-Carlisle, PA
- State GDP YoY
- ▲ 1.68%
- F500 in state
- 34
Industry mix (Fortune 500 HQ in PA)
| Industry | F500 HQs | Revenue |
|---|---|---|
| Healthcare | 2 | $309B |
|
||
| Insurance | 2 | $27B |
|
||
| Telecommunications / Media | 1 | $124B |
|
||
| Industrial Distribution | 1 | $22B |
|
||
| Financial Services | 1 | $20B |
|
||
| Chemicals / Materials | 1 | $18B |
|
||
Price history
+739.7% since first listed11 events — show timeline
- 2026-04-02 Price Changed $759,900 BRIGHT MLS
- 2026-02-09 Price Changed $779,900 BRIGHT MLS
- 2025-12-24 Listed $800,000 BRIGHT MLS
- 2022-02-16 Sold (Public Records) $310,000 Public Records
- 2014-05-14 Sold (Public Records) $67,500 Public Records
- 2006-12-01 Sold (Public Records) $150,000 Public Records
- 2006-11-30 Sold (MLS) $150,000 BRIGHT MLS
- 2006-10-24 Listing Removed — BRIGHT MLS
- 2006-09-05 Listed $169,900 BRIGHT MLS
- 2004-10-07 Sold (Public Records) $160,000 Public Records
- 1992-06-08 Sold (Public Records) $90,500 Public Records
Property tax history
+1.0%/yrLatest (2026): $2,997 · +1.7% YoY. Source: county tax records.
Cash-flow waterfall
monthlySold comps — $/sqft
last 12 mo · ≤1 miLoading sold comps…