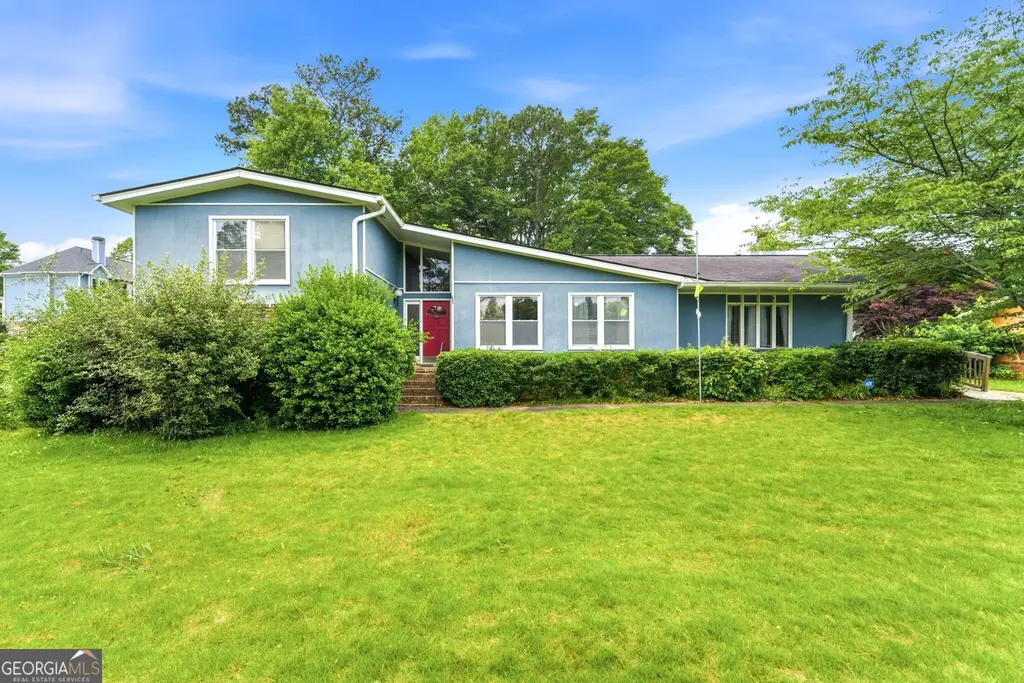
4078 Floyd Rd · Mableton, GA
Flood risk 1/10 · Minimal
- FEMA flood zone
- X (unshaded)
- Chance of flooding over 30 yrs
- 0.0%
- Est. flood insurance / yr
- $473 – $860
Fire risk 1/10 · Minimal
- Est. fire insurance / yr
- $963 – $1,789
Heat risk 5/10 · Moderate
- Hot days now (above 103°F)
- 7 days/yr
- Hot days in 30 yrs
- 18 days/yr
Wind risk 5/10 · Moderate
- Chance of severe wind over 30 yrs
- 25.0%
Air-quality risk 4/10 · Minor
- Unhealthy air days now
- 5 days/yr
- Unhealthy air days in 30 yrs
- 6 days/yr
Risk factors via First Street. Map © Google.
Why this score? — see what drove the C+ grade
The composite is a weighted blend of 9 inputs, each scored 0–100. Each bar is that input's sub-score; the figure is the points it added to the 100-point composite (weight × sub-score).
- Cash flow +22.5/30.0
- ARV discount +15.0/15.0
- DSCR +7.2/10.0
- 1% rule +4.5/10.0
- Schools +3.8/10.0
- Livability +3.5/5.0
- Rent growth +2.8/5.0
- Condition / age +2.5/5.0
- Appreciation +0.0/10.0
$240,000
🖨 Deal sheet 📄 Offer letter ✓ Due diligence
Listing remarks
Welcome to this split-level home in Austell, GA! Offering 4 bedrooms, 2 full bathrooms, and 2,200 sq ft of living space across three levels. The main level features an open and inviting layout with a generous living room, formal dining area, and a bright, functional kitchen. The family room provides the perfect space for gathering and entertaining. Outside you'll find a large backyard with a covered deck and patio. With a versatile floor plan, and a convenient location close to shopping, dining, and major commuter routes, this home is full of character and potential. Schedule your showing today!
Key facts
- Covered deck
- Functional kitchen
- Large backyard
Tags
Property features AI
Finance
- Other: Lot size approximately 0.39 acre (public records); Located in Oak Estates subdivision; Address: 4078 Floyd Rd SW, Austell, GA 30106
- HOA & community: No HOA
Exterior
- Parking: Parking pad with open parking
- Security: No community security features listed
- Utilities: Public water; Public sewer; Electricity available
- Home design: Single-family house; Residential resale; Built in 1969
- Construction: Stucco construction; Composition roof; Crawl space foundation
- Exterior features: Deck; Patio; City lot
Interior
- Kitchen: Cooktop; Oven; Microwave; Dishwasher
- Bedrooms: 4 bedrooms total, 2 located on the lower level
- Flooring: Carpet; Laminate; Tile
- Bathrooms: 2 full bathrooms (one on the lower level)
- Heating & cooling: Central heating; Central air conditioning
- Interior features: Multi/split levels; Family room and foyer; Fireplace in family room; Crawl space
- Laundry & utility: No built-in laundry features listed
Neighborhood map
What this means for you Summary
Snapshot
- This is a 3-bed/2.0-bath single-family listed at $240k.
Deal economics
- At list price, monthly cash flow is $402 ($5k/yr) — positive.
- The deal already cash-flows at list — no discount required.
- To meet the 1% rule (rent ≥ 1% of price), the offer needs to be $228k (5.0% below list).
- Recommended offer: $228k (5.0% below list) — sets the bar for 1% rule.
- Cap rate 8.3% vs local median 4.0% in Mableton — top-decile yield for the area; either an underpriced asset or a hidden risk that comps aren't pricing in. Stress-test before assuming the spread holds.
Location & tenants
- Location reads 70/100 on livability (#94 in GA) — a middle-class / working-renter tenant base. Strengths: housing A+, cost of living A-, crime B+; Watch: amenities F, commute D-.
- Cobb County (suburban): math 39% / reading 45% proficiency, ranked #25 of 174 in GA (top 14%) — families likely to look elsewhere, expect single-tenant / working-renter base with shorter leases.
- Zoned schools: Russell Elementary School (math 22% / reading 23%, grade F, #803 of 1,228 statewide, top 66%, 604 students, 71% FRL); Floyd Middle School (math 17% / reading 24%, grade F, #345 of 470 statewide, top 74%, 845 students, 80% FRL); South Cobb High School (math 21% / reading 20%, grade F, #231 of 424 statewide, top 54%, 2,127 students, 67% FRL) — zoned schools average 73% FRL vs 39% district-wide (34 pts higher); higher-poverty schools than district average — tighter screening recommended.
- Zoned-school proficiency averages 21% at this address vs 42% district-wide (-21 pts) — the specific schools serving this property underperform the Cobb County average; the district grade overstates school quality for this exact location.
- Market conditions: Rents rising (+1.3%/yr); 184 active listings in the ZIP; 25 comparable units currently listed for rent nearby; rentals at typical pace (median 22d on market — plan ~3-4 weeks tenant-placement turnaround); 1,625 units permitted in Cobb County in 2024 (389 in 5+ unit buildings).
- This rent runs 40% of the median local income ($69k/yr) — at the standard rent-burdened threshold; future hikes will face affordability resistance.
Forward outlook
- Local home prices are declining (-3.0%/yr); year-one equity from $2k of loan paydown is wiped out by about $7k of value loss. Plan a longer hold.
- Cobb County population projected at +33% by 2050 — long-run rental-demand tailwind backs the buy-and-hold thesis.
Negotiation context
- Only 6 days on market — expect competitive offers; lowballing is unlikely to land.
- Current owner paid $185k; 30% above their basis — modest negotiation headroom, anchor on the comps not their cost.
Risks & watch-outs
- Climate carrying-cost: moderate wind risk, 25% chance of damaging wind over 30y; extreme-heat days projected 7→18/yr by 2055 (HVAC capex compounding) — expect insurance premiums to compound above CPI over the hold.
Questions for the listing agent
- Built in 1969 — when were the roof, HVAC, electrical panel, plumbing, and water heater last replaced?
- Is there a deadline driving the sale (1031 exchange, divorce, estate, relocation)? That informs how much negotiation room exists.
- Schools are F-rated, which usually means shorter tenancies and higher turnover. Who's the typical renter profile here, and what's been the actual vacancy rate?
- What's the average days-on-market for RENTAL listings here right now (not sales)? A rising rental-DOM trend means longer vacancies and softer asking-rent achievability than the comps imply.
- What's the recent tenant-quality profile in this submarket — average credit score on applications, eviction rate, late-payment / NSF rate, and stable-employment percentage? A property-management company in the area should have these aggregated.
- How much new for-sale + rental construction is in the pipeline within 1–3 miles? Heavy new supply typically softens prices + rents 12–24 months out; constrained supply supports both.
Investment metrics
- 1% rule
- 0.95% ✗
- Cap rate
- 8.30%
- Cash-on-cash
- 7.18%
- DSCR
- 1.32
- GRM
- 8.8
CMA / ARV
- ARV (on-the-fly)
- $363,916
- Comps found
- 12
Show comp detail 12 sales within ~0.75 mi
| Address | Dist | Beds/Ba | Sqft | Sold | Price | $/sf | Match |
|---|---|---|---|---|---|---|---|
| 4072 Elsdon Dr | 0.08mi | 3/2.5 | 2,091 (-6%) | 6mo | $375,000 | $179 | 79 |
| 4301 Cades Cove Dr | 0.42mi | 3/2.0 | 2,214 (-0%) | 1mo | $362,000 | $164 | 79 |
| 1097 Trestle Dr | 0.06mi | 3/2.0 | 2,044 (-8%) | 6mo | $300,000 | $147 | 79 |
| 4076 Elsdon Dr | 0.07mi | 4/3.5 (+1) | 2,494 (+12%) | 2mo | $430,000 | $172 | 64 |
| 3712 Auldyn Dr | 0.55mi | 4/3.0 (+1) | 2,174 (-2%) | 3mo | $345,000 | $159 | 60 |
| 1114 Hibiscus Way SW | 0.61mi | 4/2.5 (+1) | 2,175 (-2%) | 2mo | $450,000 | $207 | 59 |
| 895 Tyrell Dr | 0.56mi | 3/2.0 | 2,372 (+7%) | 6mo | $190,000 | $80 | 57 |
| 4201 Hicks Rd | 0.65mi | 3/2.0 | 2,109 (-5%) | 10mo | $245,000 | $116 | 54 |
| 4200 Citizen Cir | 0.51mi | 4/2.0 (+1) | 1,975 (-11%) | 5mo | $259,000 | $131 | 49 |
| 936 Peel Castle Ln | 0.43mi | 4/2.5 (+1) | 2,516 (+13%) | 4mo | $438,000 | $174 | 48 |
| 829 Dunes Way | 0.60mi | 4/3.0 (+1) | 2,460 (+11%) | 0mo | $340,000 | $138 | 45 |
| 790 Heyford Vw | 0.57mi | 4/2.5 (+1) | 1,887 (-15%) | 0mo | $350,000 | $185 | 41 |
Match score weights: distance 35% · size 25% · config 20% · recency 20%. Top-matched comps best support the ARV.
Projected returns pro-forma
-3.0% appreciation · 1.3% rent growth · sell at horizon
- IRR
- -7.0%
- Equity multiple
- 0.74×
- Total profit
- $-17,230
- Equity at exit
- $35,785
- IRR
- 0.5%
- Equity multiple
- 1.03×
- Total profit
- $2,268
- Equity at exit
- $20,751
Cash invested: $67,200 (down + closing). Projections, not guarantees.
Landlord ↔ Tenant lean methodology
- Overall (STATE)
- 90 Strongly Landlord-Friendly
- State Georgia
- 90 Strongly Landlord-Friendly · R+3
- County
- — inherits STATE
- City
- — inherits STATE
ZIP-level market 30106
- Home prices YoY
- -33.4%
- Rents YoY
- 1.3%
- Active inventory
- 184
- Price-to-rent
- 8.8×
Monthly cashflow live
- Estimated rent
- $2,281 high interval (Pro) →
- Mortgage (P&I)
- −$1,259
- Tax from tax record
- −$41 /mo · $491/yr
- Insurance
- −$100
- HOA
- −$0
- Vacancy / Maint / Mgmt
- −$479
- Net cashflow
- $402
Break-even live
UW: 25.0% down · 7.5% · 30yr · 1.5% tax · 5.0% vac · 8.0% maint · 8.0% mgmt
Financing live
Cash to close
- Down payment
- $60,000
- Closing costs
- $7,200
- Reserves months
- —
- Total cash needed
- —
Loan-product check · same deal, 3 products live
Conventional
25% down · 7.5% · 30yr
- Down + closing
- —
- Monthly P&I
- —
- Monthly cashflow
- —
- DSCR
- —
- Eligible?
- —
Personal DTI + credit; lowest rate.
DSCR
20% down · 8.5% · 30yr
- Down + closing
- —
- Monthly P&I
- —
- Monthly cashflow
- —
- DSCR
- —
- Eligible?
- —
No personal income docs; deal must DSCR.
Hard money
10% down · 12.0% · 12mo
- Down + closing
- —
- Monthly P&I
- —
- Monthly cashflow
- —
- DSCR
- —
- Eligible?
- —
Short-term bridge; refi at stabilization.
Rent comps 25 comps
| Address | Beds | Baths | Sqft | Rent | $/sqft | DOM | Units | Dist |
|---|---|---|---|---|---|---|---|---|
| 1056 Whistle Dr Austell, GA | 3.0 | 2.0 | 2254 | $2,255 | $1.00 | 43d | 1 | 0.36mi |
| 1314 Guilderoy Ln Austell, GA | 2.0 | 2.5 | 1675 | $1,999 | $1.19 | 16d | 1 | 0.46mi |
| 1314 Guilderoy Ct #5 Austell, GA | 2.0 | 2.5 | 1672 | $2,199 | $1.32 | 43d | 1 | 0.47mi |
| 3890 Floyd Rd Unit B1 Austell, GA | 2.0 | 2.5 | 1461 | $2,801 | $1.92 | 43d | 1 | 0.54mi |
| 1348 Yates Ave Austell, GA | 3.0 | 2.0 | 1708 | $1,656 | $0.97 | 5d | 1 | 0.59mi |
| 1073 Wisteria Dr SW Mableton, GA | 2.0 | 1.0 | 1964 | $1,295 | $0.66 | 24d | 1 | 0.60mi |
| 3753 Austell Rd Austell, GA | 1.0–3.0 | 1.0–2.0 | 1110 | $2,775 | $2.50 | 1d | 89 | 0.67mi |
| 4196 Alaina Cir Austell, GA | 3.0 | 2.0 | 1560 | $2,375 | $1.52 | 5d | 1 | 0.70mi |
| 1554 Settlers Walk Ct SW #2 Marietta, GA | 3.0 | 2.0 | 1738 | $2,300 | $1.32 | 18d | 1 | 0.79mi |
| 4292 Gregory Ln SW Smyrna, GA | 4.0 | 3.0 | 2230 | $3,625 | $1.63 | 43d | 1 | 0.86mi |
| 3642 Nature Walk Trl SW Unit A11 Marietta, GA | 3.0 | 2.0 | 1822 | $2,190 | $1.20 | 43d | 1 | 0.89mi |
| 1101 Tuscany Cir SW Marietta, GA | 3.0 | 3.0 | 2066 | $2,229 | $1.08 | 2d | 1 | 0.89mi |
| 4667 Glore Rd SW Mableton, GA | 4.0 | 2.0 | 1857 | $5,800 | $3.12 | 43d | 1 | 0.96mi |
| 3979 Covey Flush Ct SW Smyrna, GA | 3.0 | 3.5 | 2491 | $2,300 | $0.92 | 21d | 1 | 0.98mi |
| 3966 Covey Flush Ct SW #20 Smyrna, GA | 3.0 | 2.0 | 1620 | $1,750 | $1.08 | 15d | 1 | 1.00mi |
| 1802 Orange Grove Pl Austell, GA | 3.0 | 3.5 | 2578 | $2,995 | $1.16 | 24d | 1 | 1.02mi |
| 1761 Orange Grove Pl Austell, GA | 3.0 | 2.5 | 1843 | $2,400 | $1.30 | 17d | 1 | 1.03mi |
| 620 Gregory Manor Dr SW Smyrna, GA | 3.0 | 2.5 | 2429 | $2,425 | $1.00 | 21d | 1 | 1.04mi |
| 1604 Halbrook Pl SW Austell, GA | 4.0 | 3.5 | 2375 | $3,150 | $1.33 | 18d | 1 | 1.07mi |
| 4578 Oakland Ter SW Mableton, GA | 3.0 | 2.0 | 1425 | $1,800 | $1.26 | 18d | 1 | 1.16mi |
| 3874 Mulkey Cir SW Marietta, GA | 3.0 | 2.5 | 1855 | $2,100 | $1.13 | 43d | 1 | 1.21mi |
| 4250 Tin Hare Ln SW Mableton, GA | 3.0 | 2.5 | 2030 | $2,800 | $1.38 | 24d | 1 | 1.23mi |
| 3559 Ashley Station Dr SW Marietta, GA | 4.0 | 3.5 | 1800 | $1,900 | $1.06 | 21d | 1 | 1.36mi |
| 3510 Ashley Station Dr SW Marietta, GA | 3.0 | 2.5 | 1408 | $1,845 | $1.31 | 10d | 1 | 1.38mi |
| 3590 Main Station Dr SW Unit 1 Marietta, GA | 3.0 | 3.5 | 1768 | $1,895 | $1.07 | 2d | 1 | 1.42mi |
Listing history 7 events
-
2026-06-09status $240,000 Pending 6 DOM
-
2026-06-08days on market $240,000 Active Under Contract 6 DOM
-
2026-06-07days on market $240,000 Active Under Contract 5 DOM
-
2026-06-04statusdays on market $240,000 Active Under Contract 2 DOM
-
2026-06-02status $240,000 Active 1 DOM
-
2026-06-02remarks 602-char remark
-
2026-06-02$240,000 New 1 DOM
ⓘ Source: listings_history table (triggers on properties + properties_extension) + one-shot
backfill from property_details.listing_events for pre-trigger history.
Tax reassessment forecast GA · Resets to sale price
- Current annual tax
- $491 · $41/mo
- Projected year-2 tax
- $2,208 · $184/mo
- Expected delta
- +$1,717/yr (+$143/mo · 349.3%)
ⓘ Screening estimate from a state-policy table — verify with the county assessor before closing.
Climate risk First Street
- Flood 1/10 Low FEMA zone X (unshaded) · 0% chance over 30 yrs
- Wildfire 1/10 Low
- Heat 5/10 Major 7 d/yr ≥103°F today · 18 d/yr by 30 yrs out
- Wind 5/10 Major 25% chance of damaging wind over 30 yrs
- Air quality 4/10 Moderate 5 unhealthy d/yr today · 6 by 30 yrs out
Nearby sold comps map
Loading sold comps map…
Walkable amenities ~0.75 mi
Loading nearby amenities…
Taxation est. · year 1
- Rental income
- $27,369
- − Mortgage interest
- −$13,444
- − Property taxes
- −$491
- − Insurance
- −$1,200
- − Repairs & maintenance
- −$2,190
- − Management
- −$2,190
- − Depreciation
- −$6,982
- Taxable income
- $873
- Est. tax owed @ 24.0%
- −$210
- After-tax cash flow
- $4,618/yr
For passive investors: Depreciation is non-cash, so a rental often shows a tax loss while cash-flowing — sheltering income. Rental losses are passive: they offset passive income freely, and up to $25,000/yr can offset ordinary (W-2) income if you actively participate and your MAGI is under $100k (phasing out to $0 by $150k); unused losses carry forward. On sale, claimed depreciation is recaptured at up to 25%, and gains may owe capital-gains tax (a 1031 exchange can defer both). Figures are a year-1 estimate at your 24.0% rate — not tax advice; consult a CPA.
Schools (NCES district)
- District
- Cobb County
- NCES district ID
- 1301290
- Math proficiency
- 39% ▼ -15.00%
- Reading proficiency
- 45% ▼ -10.00%
- Median HH income
- $68,845
- Composite
- 37.93/100
- National rank
- #4308
- State rank
- #25 of 174 in GA
Livability — Mableton
- Score
- 70/100
- State rank
- #94
- US rank
- #7534
Category grades
Schools grade is shown separately in the Schools card above.
Census & demographics
- County
- Cobb County · 777,758 people
- City population
- 49,719
- Metro
- Atlanta-Sandy Springs-Alpharetta, GA
- Population (ZIP)
- 23,107
- Household income
- $68,881
- Rent vs Own
- Severe rent burden
- 907.0
Population outlook (Cobb County) Hauer SSP2
- Today (2025)
- 868,385 people
- By 2030
- 929,614 · +7.1%
- By 2040
- 1,047,533 · +20.6%
- By 2050
- 1,155,537 · +33.1%
- By 2075
- 1,405,030 · +61.8%
- By 2100
- 1,555,058 · +79.1%
Race, ethnicity, and origin ACS 2023
- Neighborhood character
- Diverse neighborhood (Simpson 0.62)
- Race & ethnicity
- Black 54% White 22% Hispanic / Latino 20% Two or more races 8% Asian 1%
- Hispanic origin (detail)
- Mexican 9% Puerto Rican 6%
- Common ancestry
- Italian 2% Hispanic 1% Romanian 1%
- Foreign-born
- 14% · Canada, Jamaica, Vietnam
- Languages at home
- 79% English-only · Spanish 16% Other Indo-European 1% French/Haitian/Cajun 1%
Political lean MEDSL · Cobb
- 2024 margin
- D (+14.9) · D 56.9% · R 42.0% · Other 1.1%
- 2008→2024 swing
- +24.3pp toward D · 2008: -9.4pp · 2024: 14.9pp
- All cycles
- 2024: D+14.9 2020: D+14.3 2016: D+2.1 2012: R+12.6 2008: R+9.4
Not yet ingested
- Civics
- —
Market trends
- HPI YoY
- ▼ -128.55%
- Current HPI
- 256.6988
- Rent YoY
- ▲ 1.30%
- Metro
- Atlanta-Sandy Springs-Alpharetta, GA
- State GDP YoY
- ▲ 2.66%
- F500 in state
- 28
Industry mix (Fortune 500 HQ in GA)
| Industry | F500 HQs | Revenue |
|---|---|---|
| Paper / Packaging | 2 | $29B |
|
||
| Retail | 1 | $160B |
|
||
| Transportation / Logistics | 1 | $91B |
|
||
| Airlines | 1 | $62B |
|
||
| Consumer Goods | 1 | $47B |
|
||
| Utilities | 1 | $25B |
|
||
Price history
+29.7% since first listed2 events — show timeline
- 2026-06-01 Listed $240,000 GAMLS
- 2026-05-20 Sold (Public Records) $185,000 Public Records
Property tax history
+4.8%/yrLatest (2025): $491 · -0.5% YoY. Source: county tax records.
Cash-flow waterfall
monthlySold comps — $/sqft
last 12 mo · ≤1 miLoading sold comps…