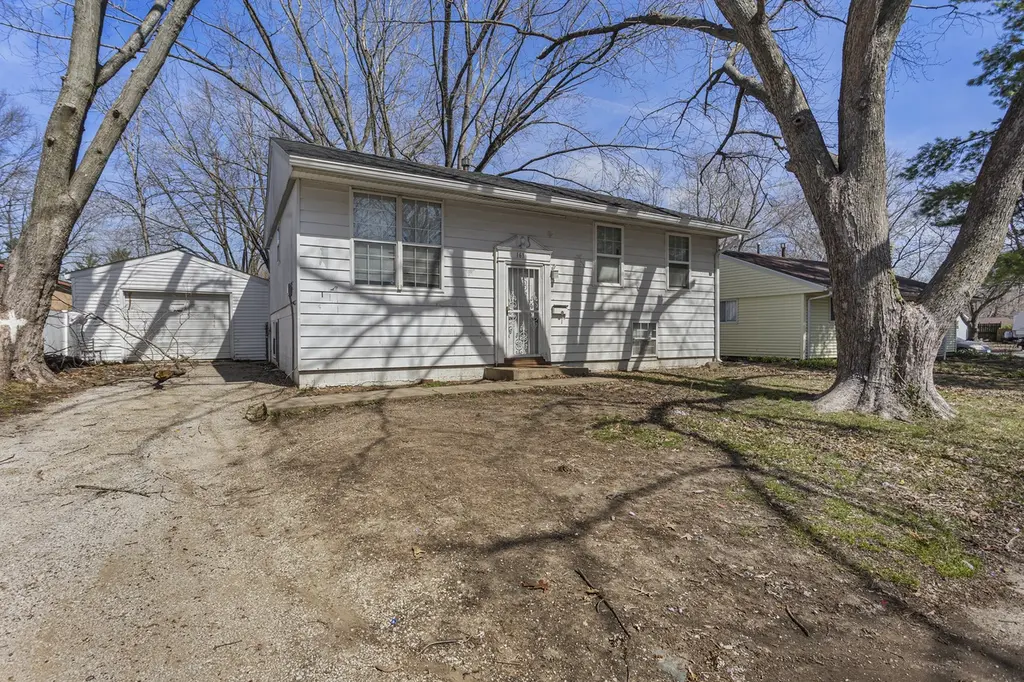
1616 Hunter St · Urbana, IL
Flood risk 1/10 · Minimal
- FEMA flood zone
- X (unshaded)
- Chance of flooding over 30 yrs
- 0.0%
- Est. flood insurance / yr
- $473 – $860
Fire risk 1/10 · Minimal
- Est. fire insurance / yr
- $804 – $1,492
Heat risk 3/10 · Minor
- Hot days now (above 103°F)
- 7 days/yr
- Hot days in 30 yrs
- 19 days/yr
Wind risk 2/10 · Minimal
- Chance of severe wind over 30 yrs
- 1.0%
Air-quality risk 2/10 · Minimal
- Unhealthy air days now
- 1 days/yr
- Unhealthy air days in 30 yrs
- 2 days/yr
Risk factors via First Street. Map © Google.
Why this score? — see what drove the B- grade
The composite is a weighted blend of 9 inputs, each scored 0–100. Each bar is that input's sub-score; the figure is the points it added to the 100-point composite (weight × sub-score).
- Cash flow +28.8/30.0
- DSCR +10.0/10.0
- ARV discount +8.6/15.0
- 1% rule +7.7/10.0
- Rent growth +5.0/5.0
- Livability +4.0/5.0
- Condition / age +2.5/5.0
- Schools +1.0/10.0
- Appreciation +0.0/10.0
$139,900
🖨 Deal sheet 📄 Offer letter ✓ Due diligence
Listing remarks MLS
Spacious and well-maintained, this 4-bedroom, 2-bath home at 1616 Hunter St in Urbana offers comfort & functionality. The property features a large backyard-perfect for outdoor entertaining or relaxing-as well as a detached garage for added convenience. Inside, you'll find tiled flooring on both the upper and lower levels, creating a clean and cohesive look throughout. The home boasts a bright and airy feel with plenty of natural light streaming in. The generously sized kitchen-dining combo provides an ideal space for gatherings, meals, and everyday living. Major updates include fresh paint to the entire home (2026) new roof in 2020, updated central heating in 2018, and an air conditioning system installed in 2014, giving peace of mind for years to come. The durable aluminum siding adds to the home's low-maintenance appeal. Conveniently located, this home offers easy access to Larson Park, local schools, and popular Urbana attractions, making it a great choice for families, students, or anyone looking to enjoy the community.
Key facts
- 6,098 sq ft lot
- Garage
- Built 1971
Neighborhood map
What this means for you Summary
Snapshot
- This is a 4-bed/2.0-bath single-family listed at $140k.
Deal economics
- At list price, monthly cash flow is $471 ($6k/yr) — positive.
- The deal already cash-flows at list — no discount required.
- Meets the 1% rule at list price ($2k rent vs $140k).
- Recommended offer: $132k (6.0% below list) — sets the bar for market timing.
- Cap rate 10.3% vs local median 3.6% in Urbana — top-decile yield for the area; either an underpriced asset or a hidden risk that comps aren't pricing in. Stress-test before assuming the spread holds.
Location & tenants
- Location reads 80/100 on livability (#110 in IL, #1,793 nationally) — a professional / high-income tenant draw. Strengths: amenities A+, commute A+, cost of living A+; Watch: employment D, schools D-, crime F.
- Urbana SD 116 (urban): math 11% / reading 13% proficiency, ranked #568 of 620 in IL (top 92%) — low school quality limits family demand, transient renter base, plan for 1-2y turnover; 64% free/reduced lunch — lower-income household profile, screen leases tightly.
- Market conditions: Rents rising fast (+11.8%/yr); 122 active listings in the ZIP; 10 comparable units currently listed for rent nearby; rentals at typical pace (median 21d on market — plan ~3-4 weeks tenant-placement turnaround); 573 units permitted in Champaign County in 2024 (359 in 5+ unit buildings).
- This rent runs 35% of the median local income ($62k/yr) — at the standard rent-burdened threshold; future hikes will face affordability resistance.
Forward outlook
- Local home prices are declining (-3.0%/yr); year-one equity from $967 of loan paydown is wiped out by about $4k of value loss. Plan a longer hold.
- Champaign County population projected at +15% by 2050 — modest demand growth; plan on rents tracking national, not racing it.
- At projected returns (-3.0% appreciation + 8.0% rent growth), your $39k cash investment doubles in ~6 years — after that, you're playing with house money.
Negotiation context
- It's been on market 84 days — a 6% lower offer ($132k) is reasonable based on typical stale-listing flexibility.
- 6 sale attempts since 22y ago; this cycle's ask is 4% above the opening price — seller raised mid-cycle; expect resistance to lowballs.
Questions for the listing agent
- It's been on market 84 days. Have you received any prior offers? Is the seller open to a 6% concession, seller financing, or rate buy-down credit?
- Built in 1971 — when were the roof, HVAC, electrical panel, plumbing, and water heater last replaced?
- Why hasn't it sold? Are there any deal-killer items the seller is aware of (foundation, flood, title, zoning, code violations)?
- Is there a deadline driving the sale (1031 exchange, divorce, estate, relocation)? That informs how much negotiation room exists.
- Schools are D-rated, which usually means shorter tenancies and higher turnover. Who's the typical renter profile here, and what's been the actual vacancy rate?
- Crime grade is F in this area — have there been break-ins, vandalism, or insurance claims at this property in the last 3 years? What carrier currently insures it and at what premium?
- What's the average days-on-market for RENTAL listings here right now (not sales)? A rising rental-DOM trend means longer vacancies and softer asking-rent achievability than the comps imply.
- What's the recent tenant-quality profile in this submarket — average credit score on applications, eviction rate, late-payment / NSF rate, and stable-employment percentage? A property-management company in the area should have these aggregated.
- How much new for-sale + rental construction is in the pipeline within 1–3 miles? Heavy new supply typically softens prices + rents 12–24 months out; constrained supply supports both.
Investment metrics
- 1% rule
- 1.27% ✓
- Cap rate
- 10.33%
- Cash-on-cash
- 14.44%
- DSCR
- 1.64
- GRM
- 6.6
CMA / ARV
- ARV (median comp)
- $143,469
- List price
- $139,900
- Delta
- -2.49%
- Verdict
- FAIR
- Comps
- 20 within 1.0 mi
Show comp detail 12 sales within ~0.75 mi
| Address | Dist | Beds/Ba | Sqft | Sold | Price | $/sf | Match |
|---|---|---|---|---|---|---|---|
| 2002 E Country Squire Dr | 0.20mi | 3/2.0 (-1) | 1,665 (+5%) | 4mo | $82,500 | $50 | 74 |
| 2101 E Pennsylvania Ave | 0.38mi | 3/2.0 (-1) | 1,508 (-5%) | 2mo | $227,000 | $151 | 67 |
| 1512 E Fairlawn Dr | 0.19mi | 3/2.0 (-1) | 1,425 (-10%) | 3mo | $212,000 | $149 | 66 |
| 1105 S Kinch St | 0.28mi | 3/2.5 (-1) | 1,470 (-7%) | 3mo | $210,000 | $143 | 65 |
| 804 Scottswood Dr | 0.74mi | 4/2.0 | 1,550 (-2%) | 3mo | $189,900 | $123 | 59 |
| 2424 E Washington Dr | 0.71mi | 3/2.0 (-1) | 1,510 (-5%) | 3mo | $72,000 | $48 | 52 |
| 705 S Wabash Ave | 0.56mi | 3/1.0 (-1) | 1,467 (-7%) | 1mo | $180,500 | $123 | 52 |
| 2110 E Pennsylvania Ave | 0.42mi | 3/2.0 (-1) | 1,357 (-14%) | 2mo | $247,900 | $183 | 50 |
| 1605 Bunker Ct | 0.56mi | 3/2.5 (-1) | 1,772 (+12%) | 1mo | $279,900 | $158 | 46 |
| 1307 S Smith Rd | 0.58mi | 3/2.5 (-1) | 1,383 (-13%) | 0mo | $248,400 | $180 | 44 |
| 909 E Washington St | 0.53mi | 3/1.5 (-1) | 1,352 (-15%) | 2mo | $170,000 | $126 | 42 |
| 1319 S Smith Rd | 0.59mi | 3/2.5 (-1) | 1,350 (-15%) | 2mo | $241,900 | $179 | 39 |
Match score weights: distance 35% · size 25% · config 20% · recency 20%. Top-matched comps best support the ARV.
Projected returns pro-forma
-3.0% appreciation · 8.0% rent growth · sell at horizon
- IRR
- 10.2%
- Equity multiple
- 1.43×
- Total profit
- $16,733
- Equity at exit
- $20,860
- IRR
- 23.0%
- Equity multiple
- 3.45×
- Total profit
- $95,950
- Equity at exit
- $12,096
Cash invested: $39,172 (down + closing). Projections, not guarantees.
Landlord ↔ Tenant lean methodology
- Overall (STATE)
- 43 Moderately Tenant-Leaning
- State Illinois
- 43 Moderately Tenant-Leaning · D+7
- County
- — inherits STATE
- City
- — inherits STATE
ZIP-level market 61802
- Home prices YoY
- -20.5%
- Rents YoY
- 11.8%
- Active inventory
- 122
- Price-to-rent
- 6.6×
Monthly cashflow live
- Estimated rent
- $1,776 high interval (Pro) →
- Mortgage (P&I)
- −$734
- Tax from tax record
- −$140 /mo · $1,676/yr
- Insurance
- −$58
- HOA
- −$0
- Vacancy / Maint / Mgmt
- −$373
- Net cashflow
- $471
Break-even live
UW: 25.0% down · 7.5% · 30yr · 1.5% tax · 5.0% vac · 8.0% maint · 8.0% mgmt
Financing live
Cash to close
- Down payment
- $34,975
- Closing costs
- $4,197
- Reserves months
- —
- Total cash needed
- —
Loan-product check · same deal, 3 products live
Conventional
25% down · 7.5% · 30yr
- Down + closing
- —
- Monthly P&I
- —
- Monthly cashflow
- —
- DSCR
- —
- Eligible?
- —
Personal DTI + credit; lowest rate.
DSCR
20% down · 8.5% · 30yr
- Down + closing
- —
- Monthly P&I
- —
- Monthly cashflow
- —
- DSCR
- —
- Eligible?
- —
No personal income docs; deal must DSCR.
Hard money
10% down · 12.0% · 12mo
- Down + closing
- —
- Monthly P&I
- —
- Monthly cashflow
- —
- DSCR
- —
- Eligible?
- —
Short-term bridge; refi at stabilization.
Rent comps 10 comps
| Address | Beds | Baths | Sqft | Rent | $/sqft | DOM | Units | Dist |
|---|---|---|---|---|---|---|---|---|
| 1109 Austin Dr Urbana, IL | 3.0 | 1.0 | 1300 | $1,350 | $1.04 | 21d | 1 | 0.08mi |
| 1907 E Florida Ave Urbana, IL | 3.0 | 2.0 | 1250 | $1,550 | $1.24 | 21d | 1 | 0.42mi |
| 1907 E Florida Ave Unit A Urbana, IL | 3.0 | 1.5 | 1250 | $1,550 | $1.24 | 21d | 1 | 0.42mi |
| 1717 S Stone Creek Blvd Urbana, IL | 3.0 | 3.5 | 1986 | $3,400 | $1.71 | 13d | 1 | 0.64mi |
| 502 E Washington St Urbana, IL | 3.0 | 2.0 | 1667 | $2,000 | $1.20 | 21d | 1 | 0.82mi |
| 602 MacArthur Dr Urbana, IL | 3.0 | 1.0 | 1200 | $1,295 | $1.08 | 21d | 1 | 0.86mi |
| 1604 S Maple St Urbana, IL | 3.0 | 2.5 | 1660 | $2,195 | $1.32 | 43d | 1 | 0.87mi |
| 615 E Colorado Ave Unit B Urbana, IL | 3.0 | 1.5 | 1056 | $1,495 | $1.42 | 13d | 1 | 0.93mi |
| 615 E Colorado Ave Unit B Urbana, IL | 3.0 | 1.5 | 1056 | $1,395 | $1.32 | 43d | 1 | 0.93mi |
| 709 N Abbey Rd Urbana, IL | 4.0 | 2.5 | 1800 | $3,150 | $1.75 | 43d | 1 | 1.36mi |
Listing history 36 events
-
2026-06-18days on market $139,900 Active 84 DOM
-
2026-06-17days on market $139,900 Active 83 DOM
-
2026-06-16days on market $139,900 Active 82 DOM
-
2026-06-15days on market $139,900 Active 81 DOM
-
2026-06-14days on market $139,900 Active 79 DOM
-
2026-06-13days on market $139,900 Active 78 DOM
-
2026-06-10days on market $139,900 Active 76 DOM
-
2026-06-09days on market $139,900 Active 75 DOM
-
2026-06-08days on market $139,900 Active 74 DOM
-
2026-06-07days on market $139,900 Active 73 DOM
-
2026-06-03days on market $139,900 Active 69 DOM
-
2026-06-02days on market $139,900 Active 68 DOM
-
2026-06-01days on market $139,900 Active 67 DOM
-
2026-05-31days on market $139,900 Active 66 DOM
-
2026-05-30days on market $139,900 Active 65 DOM
-
2026-05-12historical Contingent - Continue to Show 1044-char remark
Show marketing remark (1044 chars)
Spacious and well-maintained, this 4-bedroom, 2-bath home at 1616 Hunter St in Urbana offers comfort & functionality. The property features a large backyard-perfect for outdoor entertaining or relaxing-as well as a detached garage for added convenience. Inside, you'll find tiled flooring on both the upper and lower levels, creating a clean and cohesive look throughout. The home boasts a bright and airy feel with plenty of natural light streaming in. The generously sized kitchen-dining combo provides an ideal space for gatherings, meals, and everyday living. Major updates include fresh paint to the entire home (2026) new roof in 2020, updated central heating in 2018, and an air conditioning system installed in 2014, giving peace of mind for years to come. The durable aluminum siding adds to the home's low-maintenance appeal. Conveniently located, this home offers easy access to Larson Park, local schools, and popular Urbana attractions, making it a great choice for families, students, or anyone looking to enjoy the community.
-
2026-04-20price $139,900 1044-char remark
Show marketing remark (1044 chars)
Spacious and well-maintained, this 4-bedroom, 2-bath home at 1616 Hunter St in Urbana offers comfort & functionality. The property features a large backyard-perfect for outdoor entertaining or relaxing-as well as a detached garage for added convenience. Inside, you'll find tiled flooring on both the upper and lower levels, creating a clean and cohesive look throughout. The home boasts a bright and airy feel with plenty of natural light streaming in. The generously sized kitchen-dining combo provides an ideal space for gatherings, meals, and everyday living. Major updates include fresh paint to the entire home (2026) new roof in 2020, updated central heating in 2018, and an air conditioning system installed in 2014, giving peace of mind for years to come. The durable aluminum siding adds to the home's low-maintenance appeal. Conveniently located, this home offers easy access to Larson Park, local schools, and popular Urbana attractions, making it a great choice for families, students, or anyone looking to enjoy the community.
-
2023-07-13soldstatus $130,000
-
2023-07-10soldstatus $130,000 Closed 31-char remark
Show marketing remark (31 chars)
There are no remarks available.
-
2023-06-08historical Contingent - No Showings 31-char remark
Show marketing remark (31 chars)
There are no remarks available.
-
2023-05-30status Active 31-char remark
Show marketing remark (31 chars)
There are no remarks available.
-
2023-04-26historical Contingent - No Showings 31-char remark
Show marketing remark (31 chars)
There are no remarks available.
-
2023-03-16$135,000 Active 31-char remark
Show marketing remark (31 chars)
There are no remarks available.
-
2023-03-10historical
-
2023-03-10status Temporarily No Showings
-
2023-03-07historical
-
2022-11-02status Active
-
2022-10-31historical
-
2022-10-05price
-
2022-08-31price
-
2022-08-04price
-
2022-07-22Active
-
2012-11-07soldstatus $55,000
-
2005-01-10historical
-
2004-09-04
-
1994-07-22soldstatus $41,333
ⓘ Source: listings_history table (triggers on properties + properties_extension) + one-shot
backfill from property_details.listing_events for pre-trigger history.
Tax reassessment forecast IL · Partial reset (capped growth)
- Current annual tax
- $1,676 · $140/mo
- Projected year-2 tax
- $2,426 · $202/mo
- Expected delta
- +$750/yr (+$62/mo · 44.7%)
ⓘ Screening estimate from a state-policy table — verify with the county assessor before closing.
Climate risk First Street
- Flood 1/10 Low FEMA zone X (unshaded) · 0% chance over 30 yrs
- Wildfire 1/10 Low
- Heat 3/10 Moderate 7 d/yr ≥103°F today · 19 d/yr by 30 yrs out
- Wind 2/10 Low 100% chance of damaging wind over 30 yrs
- Air quality 2/10 Low 1 unhealthy d/yr today · 2 by 30 yrs out
Nearby sold comps map
Loading sold comps map…
Walkable amenities ~0.75 mi
Loading nearby amenities…
Taxation est. · year 1
- Rental income
- $21,309
- − Mortgage interest
- −$7,837
- − Property taxes
- −$1,676
- − Insurance
- −$700
- − Repairs & maintenance
- −$1,705
- − Management
- −$1,705
- − Depreciation
- −$4,070
- Taxable income
- $3,618
- Est. tax owed @ 24.0%
- −$868
- After-tax cash flow
- $4,787/yr
For passive investors: Depreciation is non-cash, so a rental often shows a tax loss while cash-flowing — sheltering income. Rental losses are passive: they offset passive income freely, and up to $25,000/yr can offset ordinary (W-2) income if you actively participate and your MAGI is under $100k (phasing out to $0 by $150k); unused losses carry forward. On sale, claimed depreciation is recaptured at up to 25%, and gains may owe capital-gains tax (a 1031 exchange can defer both). Figures are a year-1 estimate at your 24.0% rate — not tax advice; consult a CPA.
Schools (NCES district)
- District
- Urbana SD 116
- NCES district ID
- 1739960
- Math proficiency
- 11% ▼ -5.00%
- Reading proficiency
- 13% ▼ -7.00%
- Median HH income
- $33,678
- Composite
- 9.72/100
- National rank
- #9830
- State rank
- #568 of 620 in IL
Livability — Urbana
- Score
- 80/100
- State rank
- #110
- US rank
- #1793
Category grades
Schools grade is shown separately in the Schools card above.
Census & demographics
- Census place
- Urbana, IL
- County
- Champaign County · 182,148 people
- City population
- 48,184
- Metro
- Champaign-Urbana, IL
- Population (ZIP)
- 20,293
- Household income
- $61,620
- Rent vs Own
- Severe rent burden
- 809.0
Population outlook (Champaign County) Hauer SSP2
- Today (2025)
- 223,848 people
- By 2030
- 231,416 · +3.4%
- By 2040
- 244,321 · +9.1%
- By 2050
- 256,432 · +14.6%
- By 2075
- 285,823 · +27.7%
- By 2100
- 296,406 · +32.4%
Race, ethnicity, and origin ACS 2023
- Neighborhood character
- Diverse neighborhood (Simpson 0.58)
- Race & ethnicity
- White 61% Black 18% Hispanic / Latino 11% Asian 7% Two or more races 6%
- Hispanic origin (detail)
- Mexican 7% Puerto Rican 1%
- Common ancestry
- Romanian 3% Lithuanian 2% Italian 1%
- Foreign-born
- 12% · China, Canada, South Korea
- Languages at home
- 83% English-only · Spanish 7% Other Indo-European 2% Chinese 2%
Political lean MEDSL · Champaign
- 2024 margin
- Strong D (+24.1) · D 61.3% · R 37.2% · Other 1.5%
- 2008→2024 swing
- +6.6pp toward D · 2008: 17.5pp · 2024: 24.1pp
- All cycles
- 2024: D+24.1 2020: D+22.8 2016: D+18.4 2012: D+6.8 2008: D+17.5
Not yet ingested
- Civics
- —
Market trends
- HPI YoY
- ▼ -53.21%
- Current HPI
- 206.3079
- Rent YoY
- ▲ 11.85%
- Metro
- Champaign-Urbana, IL
- State GDP YoY
- ▲ 1.59%
- F500 in state
- 60
Industry mix (Fortune 500 HQ in IL)
| Industry | F500 HQs | Revenue |
|---|---|---|
| Insurance | 4 | $201B |
|
||
| Consumer Goods | 4 | $87B |
|
||
| Industrial Machinery | 3 | $64B |
|
||
| Healthcare | 2 | $55B |
|
||
| Retail / Pharmacy | 1 | $148B |
|
||
| Agriculture / Food | 1 | $86B |
|
||
Price history
+238.5% since first listed21 events — show timeline
- 2026-05-12 Contingent — MRED as Distributed by MLS Grid
- 2026-04-20 Price Changed $139,900 MRED as Distributed by MLS Grid
- 2023-07-13 Sold (Public Records) $130,000 Public Records
- 2023-07-10 Sold (MLS) $130,000 MRED as Distributed by MLS Grid
- 2023-06-08 Contingent — MRED as Distributed by MLS Grid
- 2023-05-30 Relisted — MRED as Distributed by MLS Grid
- 2023-04-26 Contingent — MRED as Distributed by MLS Grid
- 2023-03-16 Listed $135,000 MRED as Distributed by MLS Grid
- 2023-03-10 Listing Removed — MRED as Distributed by MLS Grid
- 2023-03-10 Relisted — MRED as Distributed by MLS Grid
- 2023-03-07 Listing Removed — MRED as Distributed by MLS Grid
- 2022-11-02 Relisted — MRED as Distributed by MLS Grid
- 2022-10-31 Listing Removed — MRED as Distributed by MLS Grid
- 2022-10-05 Price Changed — MRED as Distributed by MLS Grid
- 2022-08-31 Price Changed — MRED as Distributed by MLS Grid
- 2022-08-04 Price Changed — MRED as Distributed by MLS Grid
- 2022-07-22 Listed — MRED as Distributed by MLS Grid
- 2012-11-07 Sold (Public Records) $55,000 Public Records
- 2005-01-10 Listing Removed — MRED as Distributed by MLS Grid
- 2004-09-04 Listed — MRED as Distributed by MLS Grid
- 1994-07-22 Sold (Public Records) $41,333 Public Records
Property tax history
-1.2%/yrLatest (2024): $1,676 · -22.4% YoY. Source: county tax records.
Cash-flow waterfall
monthlySold comps — $/sqft
last 12 mo · ≤1 miLoading sold comps…