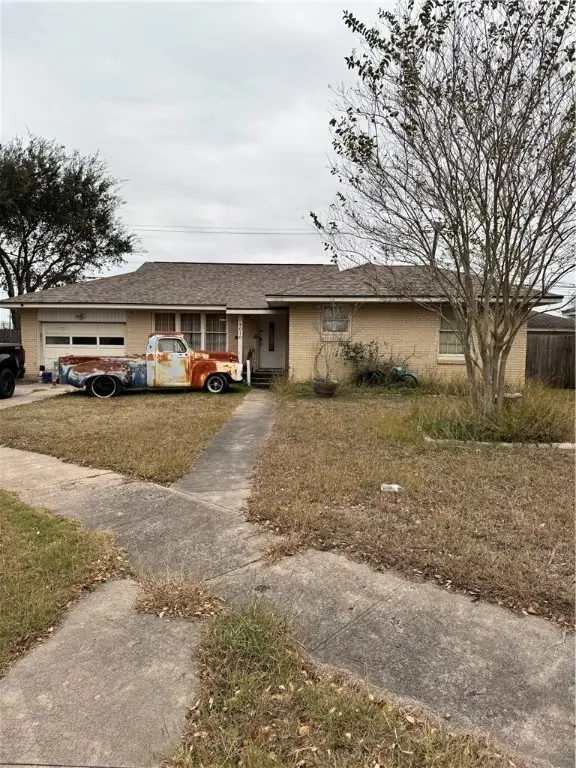
4010 Markins Dr · Corpus Christi, TX
Flood risk 1/10 · Minimal
- FEMA flood zone
- X (unshaded)
- Chance of flooding over 30 yrs
- 0.0%
- Est. flood insurance / yr
- $507 – $1,088
Fire risk 1/10 · Minimal
- Est. fire insurance / yr
- $1,222 – $2,270
Heat risk 10/10 · Severe
- Hot days now (above 107°F)
- 7 days/yr
- Hot days in 30 yrs
- 24 days/yr
Wind risk 9/10 · Severe
- Chance of severe wind over 30 yrs
- 99.0%
Air-quality risk 1/10 · Minimal
- Unhealthy air days now
- 0 days/yr
- Unhealthy air days in 30 yrs
- 0 days/yr
Risk factors via First Street. Map © Google.
Why this score? — see what drove the C grade
The composite is a weighted blend of 9 inputs, each scored 0–100. Each bar is that input's sub-score; the figure is the points it added to the 100-point composite (weight × sub-score).
- Cash flow +17.4/30.0
- ARV discount +13.8/15.0
- 1% rule +5.8/10.0
- DSCR +5.4/10.0
- Rent growth +4.5/5.0
- Livability +3.9/5.0
- Schools +2.8/10.0
- Condition / age +2.5/5.0
- Appreciation +0.0/10.0
$160,000
🖨 Deal sheet 📄 Offer letter ✓ Due diligence
Listing remarks MLS
Great investment opportunity! This 3-bedroom, 1.5-bath home is located in a desirable area and offers strong potential for a flip or rental. With the right updates, it can become a high-demand property.
Key facts
- 6,826 sq ft lot
- Garage
- Built 1954
Neighborhood map
What this means for you Summary
Snapshot
- This is a 3-bed/1.5-bath single-family listed at $160k.
Deal economics
- At list price, monthly cash flow is $121 ($1k/yr) — positive.
- The deal already cash-flows at list — no discount required.
- Meets the 1% rule at list price ($2k rent vs $160k).
- Recommended offer: $141k (12.0% below list) — sets the bar for market timing.
- Cap rate 7.2% vs local median 3.6% in Corpus Christi — top-decile yield for the area; either an underpriced asset or a hidden risk that comps aren't pricing in. Stress-test before assuming the spread holds.
Location & tenants
- Location reads 78/100 on livability (#66 in TX, #2,404 nationally) — a middle-class / working-renter tenant base. Strengths: commute A+, cost of living A+, housing A+; Watch: crime F.
- Corpus Christi ISD (urban): math 31% / reading 35% proficiency, ranked #562 of 826 in TX (top 68%) — families likely to look elsewhere, expect single-tenant / working-renter base with shorter leases; 63% free/reduced lunch — lower-income household profile, screen leases tightly.
- Market conditions: Rents rising fast (+7.9%/yr); 142 active listings in the ZIP; 34 comparable units currently listed for rent nearby; rentals lingering (median 44d on market — plan ~5-8 weeks vacancy on turnover, expect pricing pressure); 53% of comp listings sitting > 30 days — soft ceiling on asking rent; 1,397 units permitted in Nueces County in 2024 (47 in 5+ unit buildings).
- This rent runs 36% of the median local income ($58k/yr) — at the standard rent-burdened threshold; future hikes will face affordability resistance.
Forward outlook
- Local home prices are declining (-3.0%/yr); year-one equity from $1k of loan paydown is wiped out by about $5k of value loss. Plan a longer hold.
- Nueces County population projected at +36% by 2050 — long-run rental-demand tailwind backs the buy-and-hold thesis.
- At projected returns (-3.0% appreciation + 7.9% rent growth), your $45k cash investment doubles in ~10 years — after that, you're playing with house money.
Negotiation context
- It's been on market 151 days — a 12% lower offer ($141k) is reasonable based on typical stale-listing flexibility.
- 4 sale attempts since 20y ago with the ask held roughly flat each time — persistent listings suggest the price (not the market) is what's stuck; bring a comps-based counter.
Risks & watch-outs
- Watch-outs: property tax is 2.5% of price; built in 1954 — expect roof / HVAC / electrical / plumbing capex.
- Climate carrying-cost: severe wind risk, 99% chance of damaging wind over 30y; extreme-heat days projected 7→24/yr by 2055 (HVAC capex compounding) — expect insurance premiums to compound above CPI over the hold.
Questions for the listing agent
- It's been on market 151 days. Have you received any prior offers? Is the seller open to a 12% concession, seller financing, or rate buy-down credit?
- Built in 1954 — when were the roof, HVAC, electrical panel, plumbing, and water heater last replaced?
- Property tax is high relative to price — has the assessment been appealed recently, and will the sale trigger a re-assessment?
- Why hasn't it sold? Are there any deal-killer items the seller is aware of (foundation, flood, title, zoning, code violations)?
- Is there a deadline driving the sale (1031 exchange, divorce, estate, relocation)? That informs how much negotiation room exists.
- Crime grade is F in this area — have there been break-ins, vandalism, or insurance claims at this property in the last 3 years? What carrier currently insures it and at what premium?
- What's the average days-on-market for RENTAL listings here right now (not sales)? A rising rental-DOM trend means longer vacancies and softer asking-rent achievability than the comps imply.
- What's the recent tenant-quality profile in this submarket — average credit score on applications, eviction rate, late-payment / NSF rate, and stable-employment percentage? A property-management company in the area should have these aggregated.
- How much new for-sale + rental construction is in the pipeline within 1–3 miles? Heavy new supply typically softens prices + rents 12–24 months out; constrained supply supports both.
Investment metrics
- 1% rule
- 1.08% ✓
- Cap rate
- 7.20%
- Cash-on-cash
- 3.25%
- DSCR
- 1.14
- GRM
- 7.7
CMA / ARV
- ARV (median comp)
- $186,129
- List price
- $160,000
- Delta
- -14.04%
- Verdict
- UNDERPRICED
- Comps
- 20 within 1.0 mi
Show comp detail 12 sales within ~0.75 mi
| Address | Dist | Beds/Ba | Sqft | Sold | Price | $/sf | Match |
|---|---|---|---|---|---|---|---|
| 1010 Catalina | 0.23mi | 3/2.0 | 1,342 (+0%) | 3mo | $230,000 | $171 | 84 |
| 4010 Lowman St | 0.11mi | 3/2.0 | 1,234 (-8%) | 1mo | $140,000 | $113 | 79 |
| 4025 Markins Dr | 0.06mi | 3/1.0 | 1,208 (-10%) | 2mo | $174,900 | $145 | 78 |
| 3702 Harris Dr | 0.43mi | 3/1.5 | 1,312 (-2%) | 3mo | $205,700 | $157 | 74 |
| 4221 Herndon St | 0.30mi | 3/1.5 | 1,218 (-9%) | 4mo | $179,000 | $147 | 68 |
| 1013 Peerman Pl | 0.27mi | 3/1.0 | 1,196 (-10%) | 3mo | $189,000 | $158 | 66 |
| 1031 Wilshire Pl | 0.19mi | 3/1.0 | 1,159 (-13%) | 5mo | $164,000 | $142 | 63 |
| 1022 Miramar Pl | 0.65mi | 3/1.5 | 1,264 (-5%) | 1mo | $165,000 | $131 | 60 |
| 3937 Linden St | 0.47mi | 3/2.0 | 1,211 (-9%) | 5mo | $175,000 | $145 | 56 |
| 4213 Dolphin Pl | 0.48mi | 3/2.0 | 1,518 (+14%) | 4mo | $275,000 | $181 | 50 |
| 1410 Ray Dr | 0.68mi | 3/1.0 | 1,224 (-8%) | 4mo | $89,900 | $73 | 49 |
| 3402 Olsen Dr | 0.73mi | 3/2.0 | 1,446 (+8%) | 2mo | $199,900 | $138 | 49 |
Match score weights: distance 35% · size 25% · config 20% · recency 20%. Top-matched comps best support the ARV.
Projected returns pro-forma
-3.0% appreciation · 7.91% rent growth · sell at horizon
- IRR
- -5.2%
- Equity multiple
- 0.80×
- Total profit
- $-9,133
- Equity at exit
- $23,857
- IRR
- 10.0%
- Equity multiple
- 1.96×
- Total profit
- $43,133
- Equity at exit
- $13,834
Cash invested: $44,800 (down + closing). Projections, not guarantees.
Landlord ↔ Tenant lean methodology
- Overall (STATE)
- 87 Strongly Landlord-Friendly
- State Texas
- 87 Strongly Landlord-Friendly · R+5
- County
- — inherits STATE
- City
- — inherits STATE
ZIP-level market 78411
- Rents YoY
- 7.9%
- Active inventory
- 142
- Price-to-rent
- 7.7×
Monthly cashflow live
- Estimated rent
- $1,727 high interval (Pro) →
- Mortgage (P&I)
- −$839
- Tax from tax record
- −$338 /mo · $4,051/yr
- Insurance
- −$67
- HOA
- −$0
- Vacancy / Maint / Mgmt
- −$363
- Net cashflow
- $121
Break-even live
UW: 25.0% down · 7.5% · 30yr · 1.5% tax · 5.0% vac · 8.0% maint · 8.0% mgmt
Financing live
Cash to close
- Down payment
- $40,000
- Closing costs
- $4,800
- Reserves months
- —
- Total cash needed
- —
Loan-product check · same deal, 3 products live
Conventional
25% down · 7.5% · 30yr
- Down + closing
- —
- Monthly P&I
- —
- Monthly cashflow
- —
- DSCR
- —
- Eligible?
- —
Personal DTI + credit; lowest rate.
DSCR
20% down · 8.5% · 30yr
- Down + closing
- —
- Monthly P&I
- —
- Monthly cashflow
- —
- DSCR
- —
- Eligible?
- —
No personal income docs; deal must DSCR.
Hard money
10% down · 12.0% · 12mo
- Down + closing
- —
- Monthly P&I
- —
- Monthly cashflow
- —
- DSCR
- —
- Eligible?
- —
Short-term bridge; refi at stabilization.
Rent comps 34 comps
| Address | Beds | Baths | Sqft | Rent | $/sqft | DOM | Units | Dist |
|---|---|---|---|---|---|---|---|---|
| 625 Catalina Pl Corpus Christi, TX | 3.0 | 2.0 | 1750 | $2,100 | $1.20 | 13d | 1 | 0.41mi |
| 929 Dolphin Pl Corpus Christi, TX | 3.0 | 2.0 | 1508 | $2,095 | $1.39 | 21d | 1 | 0.61mi |
| 1410 Ray Dr Corpus Christi, TX | 3.0 | 1.0 | 1224 | $1,600 | $1.31 | 13d | 1 | 0.64mi |
| 3562 Topeka St Corpus Christi, TX | 3.0 | 1.0 | 1208 | $1,695 | $1.40 | 13d | 1 | 0.77mi |
| 4634 Weir Dr Corpus Christi, TX | 3.0 | 2.0 | 1540 | $1,800 | $1.17 | 43d | 1 | 0.81mi |
| 3314 Casa de Palmas Dr Corpus Christi, TX | 3.0 | 2.0 | 1869 | $2,300 | $1.23 | 13d | 1 | 0.82mi |
| 3509 Topeka St Corpus Christi, TX | 2.0 | 1.0 | 1114 | $1,850 | $1.66 | 43d | 1 | 0.82mi |
| 4110 Grossman Dr Unit B Corpus Christi, TX | 3.0 | 2.0 | 1228 | $1,500 | $1.22 | 43d | 1 | 0.85mi |
| 3333 S Alameda St Corpus Christi, TX | 3.0 | 2.0 | 1000 | $1,149 | $1.15 | 43d | 1 | 0.86mi |
| 3738 Marion St Corpus Christi, TX | 3.0 | 1.0 | 1100 | $1,295 | $1.18 | 43d | 1 | 0.89mi |
| 4322 Kostoryz Rd Corpus Christi, TX | 2.0 | 1.5 | 1100 | $1,259 | $1.14 | 43d | 1 | 0.93mi |
| 4717 Edith St Unit 1268436P Corpus Christi, TX | 4.0 | 2.0 | 1496 | $4,708 | $3.15 | 43d | 1 | 0.98mi |
| 802 Barry St Corpus Christi, TX | 2.0 | 1.5 | 1102 | $1,529 | $1.39 | 43d | 1 | 1.01mi |
| 4002 McArdle Rd Corpus Christi, TX | 3.0 | 1.0 | 1018 | $1,095 | $1.08 | 13d | 1 | 1.06mi |
| 4201 Junior Ter Corpus Christi, TX | 3.0 | 1.0 | 1016 | $1,600 | $1.57 | 43d | 1 | 1.09mi |
| 4845 Concord St Corpus Christi, TX | 4.0 | 2.0 | 1437 | $1,750 | $1.22 | 13d | 1 | 1.10mi |
| 4822 Mokry Dr Corpus Christi, TX | 2.0 | 1.0 | 903 | $1,200 | $1.33 | 21d | 1 | 1.12mi |
| 4805 Lavaca Dr Unit 1 Corpus Christi, TX | 2.0 | 1.0 | 1030 | $1,300 | $1.26 | 21d | 1 | 1.15mi |
| 318 Aberdeen Ave Unit 1268410P Corpus Christi, TX | 3.0 | 1.5 | 1076 | $4,405 | $4.09 | 43d | 1 | 1.16mi |
| 4813 Lavaca Dr Unit 1 Corpus Christi, TX | 2.0 | 1.0 | 1746 | $1,195 | $0.68 | 21d | 1 | 1.17mi |
| 4813 Lavaca Dr Unit 2 Corpus Christi, TX | 2.0 | 1.0 | 1746 | $1,095 | $0.63 | 43d | 1 | 1.17mi |
| 4830 French Dr Corpus Christi, TX | 3.0 | 2.0 | 1299 | $1,700 | $1.31 | 13d | 1 | 1.18mi |
| 4817 Lavaca Dr Unit 1 Corpus Christi, TX | 2.0 | 1.0 | 1746 | $1,195 | $0.68 | 21d | 1 | 1.19mi |
| 4942 Anthony St Corpus Christi, TX | 3.0 | 1.0 | 1014 | $1,595 | $1.57 | 13d | 1 | 1.24mi |
| 4005 Green Grove Dr Corpus Christi, TX | 3.0 | 2.0 | 1406 | $1,695 | $1.21 | 43d | 1 | 1.35mi |
| 1522 Cambridge Dr Corpus Christi, TX | 3.0 | 1.5 | 1278 | $1,600 | $1.25 | 43d | 1 | 1.36mi |
| 722 Collingswood Dr Corpus Christi, TX | 3.0 | 1.5 | 1318 | $1,595 | $1.21 | 13d | 1 | 1.38mi |
| 4241 Green Grove Dr Corpus Christi, TX | 3.0 | 2.0 | 1345 | $1,700 | $1.26 | 43d | 1 | 1.40mi |
| 4422 S Alameda St Corpus Christi, TX | 1.0–3.0 | 1.0–2.0 | 820 | $1,000 | $1.22 | 13d | 1 | 1.41mi |
| 1446 Annapolis Dr Corpus Christi, TX | 3.0 | 2.0 | 1500 | $1,700 | $1.13 | 43d | 1 | 1.44mi |
| 4302 Ocean Dr Corpus Christi, TX | 3.0 | 2.0 | 1420 | $2,100 | $1.48 | 44d | 1 | 1.47mi |
| 4302 Ocean Dr Corpus Christi, TX | 3.0 | 2.0 | 1420 | $2,050 | $1.44 | 43d | 2 | 1.47mi |
| 3936 Brushwood Ln Corpus Christi, TX | 2.0 | 1.0 | 900 | $925 | $1.03 | 43d | 1 | 1.48mi |
| 1405 Annapolis Dr Corpus Christi, TX | 3.0 | 1.5 | 1502 | $2,000 | $1.33 | 13d | 1 | 1.49mi |
Listing history 24 events
-
2026-06-18days on market $160,000 Active 151 DOM
-
2026-06-17days on market $160,000 Active 150 DOM
-
2026-06-16days on market $160,000 Active 149 DOM
-
2026-06-15days on market $160,000 Active 148 DOM
-
2026-06-14days on market $160,000 Active 146 DOM
-
2026-06-10days on market $160,000 Active 143 DOM
-
2026-06-09days on market $160,000 Active 142 DOM
-
2026-06-08days on market $160,000 Active 141 DOM
-
2026-06-07days on market $160,000 Active 140 DOM
-
2026-06-05days on market $160,000 Active 137 DOM
-
2026-06-03days on market $160,000 Active 136 DOM
-
2026-06-02days on market $160,000 Active 135 DOM
-
2026-06-01days on market $160,000 Active 134 DOM
-
2026-05-31days on market $160,000 Active 133 DOM
-
2026-05-30days on market $160,000 Active 132 DOM
-
2026-01-18$160,000 Active 202-char remark
Show marketing remark (202 chars)
Great investment opportunity! This 3-bedroom, 1.5-bath home is located in a desirable area and offers strong potential for a flip or rental. With the right updates, it can become a high-demand property.
-
2025-01-06$160,000 Active
-
2006-11-13soldstatus
-
2006-11-02soldstatus
-
2006-08-07$109,000
-
2006-05-09soldstatus
-
2006-05-09soldstatus
-
2006-05-04soldstatus
-
2006-04-01$79,500
ⓘ Source: listings_history table (triggers on properties + properties_extension) + one-shot
backfill from property_details.listing_events for pre-trigger history.
Tax reassessment forecast TX · Resets to sale price
- Current annual tax
- $4,051 · $338/mo
- Projected year-2 tax
- $4,051 · $338/mo
- Expected delta
- $0/yr ($0/mo · 0.0%)
ⓘ Screening estimate from a state-policy table — verify with the county assessor before closing.
Climate risk First Street
- Flood 1/10 Low FEMA zone X (unshaded) · 0% chance over 30 yrs
- Wildfire 1/10 Low
- Heat 10/10 Extreme 7 d/yr ≥107°F today · 24 d/yr by 30 yrs out
- Wind 9/10 Extreme 99% chance of damaging wind over 30 yrs
- Air quality 1/10 Low 0 unhealthy d/yr today · 0 by 30 yrs out
Nearby sold comps map
Loading sold comps map…
Walkable amenities ~0.75 mi
Loading nearby amenities…
Taxation est. · year 1
- Rental income
- $20,729
- − Mortgage interest
- −$8,962
- − Property taxes
- −$4,051
- − Insurance
- −$800
- − Repairs & maintenance
- −$1,658
- − Management
- −$1,658
- − Depreciation
- −$4,655
- Taxable loss
- −$1,056
- Est. tax savings @ 24.0%
- +$253
- After-tax cash flow
- $1,709/yr
For passive investors: Depreciation is non-cash, so a rental often shows a tax loss while cash-flowing — sheltering income. Rental losses are passive: they offset passive income freely, and up to $25,000/yr can offset ordinary (W-2) income if you actively participate and your MAGI is under $100k (phasing out to $0 by $150k); unused losses carry forward. On sale, claimed depreciation is recaptured at up to 25%, and gains may owe capital-gains tax (a 1031 exchange can defer both). Figures are a year-1 estimate at your 24.0% rate — not tax advice; consult a CPA.
Schools (NCES district)
- District
- Corpus Christi ISD
- NCES district ID
- 4815270
- Math proficiency
- 31% ▼ -18.00%
- Reading proficiency
- 35% ▼ -7.00%
- Median HH income
- $45,672
- Composite
- 28.27/100
- National rank
- #6793
- State rank
- #562 of 826 in TX
Livability — Corpus Christi
- Score
- 78/100
- State rank
- #66
- US rank
- #2404
Category grades
Schools grade is shown separately in the Schools card above.
Census & demographics
- Census place
- Corpus Christi, TX
- County
- Nueces County · 296,836 people
- City population
- 296,836
- Metro
- Corpus Christi, TX
- Population (ZIP)
- 23,682
- Household income
- $57,742
- Rent vs Own
- Severe rent burden
- 1284.0
Population outlook (Nueces County) Hauer SSP2
- Today (2025)
- 418,037 people
- By 2030
- 447,123 · +7.0%
- By 2040
- 505,911 · +21.0%
- By 2050
- 567,522 · +35.8%
- By 2075
- 729,686 · +74.6%
- By 2100
- 847,087 · +102.6%
Race, ethnicity, and origin ACS 2023
- Neighborhood character
- Majority Hispanic (58%)
- Race & ethnicity
- Hispanic / Latino 58% White 35% Two or more races 29% Black 3% Asian 2%
- Hispanic origin (detail)
- Mexican 51%
- Common ancestry
- Slovak 2% Italian 1% Serbian 1%
- Foreign-born
- 6% · Canada
- Languages at home
- 75% English-only · Spanish 23% Tagalog/Filipino 1% Other Indo-European 1%
Political lean MEDSL · Nueces
- 2024 margin
- R (+11.5) · D 43.8% · R 55.3%
- 2008→2024 swing
- -7.1pp toward R · 2008: -4.4pp · 2024: -11.5pp
- All cycles
- 2024: R+11.5 2020: R+2.9 2016: R+1.5 2012: R+3.2 2008: R+4.4
Not yet ingested
- Civics
- —
Market trends
- HPI YoY
- ▼ -265.71%
- Current HPI
- 191.7201
- Rent YoY
- ▲ 7.91%
- Metro
- Corpus Christi, TX
- State GDP YoY
- ▲ 3.95%
- F500 in state
- 110
Industry mix (Fortune 500 HQ in TX)
| Industry | F500 HQs | Revenue |
|---|---|---|
| Energy | 16 | $1,198B |
|
||
| Technology | 5 | $198B |
|
||
| Engineering / Construction | 4 | $72B |
|
||
| Energy Services | 3 | $60B |
|
||
| Utilities | 3 | $41B |
|
||
| Healthcare | 2 | $330B |
|
||
Price history
+101.3% since first listed9 events — show timeline
- 2026-01-18 Listed $160,000 CBMLS
- 2025-01-06 Listed $160,000 CBMLS
- 2006-11-13 Sold (Public Records) — Public Records
- 2006-11-02 Sold (MLS) — CBMLS
- 2006-08-07 Listed $109,000 CBMLS
- 2006-05-09 Sold (Public Records) — Public Records
- 2006-05-09 Sold (Public Records) — Public Records
- 2006-05-04 Sold (MLS) — CBMLS
- 2006-04-01 Listed $79,500 CBMLS
Property tax history
+6.8%/yrLatest (2025): $4,051 · +12.0% YoY. Source: county tax records.
Cash-flow waterfall
monthlySold comps — $/sqft
last 12 mo · ≤1 miLoading sold comps…