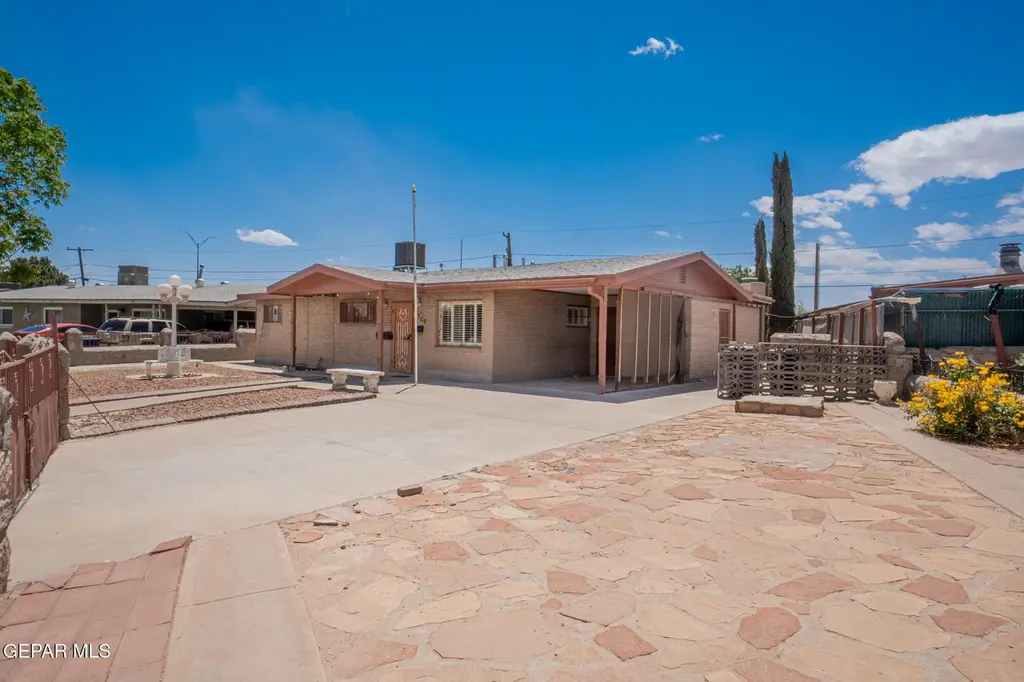
5300 Flower Dr · El Paso, TX
Flood risk 4/10 · Minor
- FEMA flood zone
- X
- Chance of flooding over 30 yrs
- 0.22%
- Est. flood insurance / yr
- $507 – $1,088
Fire risk 1/10 · Minimal
- Est. fire insurance / yr
- $1,222 – $2,270
Heat risk 6/10 · Moderate
- Hot days now (above 102°F)
- 7 days/yr
- Hot days in 30 yrs
- 25 days/yr
Wind risk 1/10 · Minimal
- Chance of severe wind over 30 yrs
- —
Air-quality risk 2/10 · Minimal
- Unhealthy air days now
- 1 days/yr
- Unhealthy air days in 30 yrs
- 2 days/yr
Risk factors via First Street. Map © Google.
Why this score? — see what drove the D grade
The composite is a weighted blend of 9 inputs, each scored 0–100. Each bar is that input's sub-score; the figure is the points it added to the 100-point composite (weight × sub-score).
- Appreciation +10.0/10.0
- ARV discount +7.5/15.0
- Cash flow +7.4/30.0
- Livability +4.0/5.0
- Schools +2.7/10.0
- Rent growth +2.5/5.0
- Condition / age +2.5/5.0
- 1% rule +2.2/10.0
- DSCR +1.6/10.0
$203,997
🖨 Deal sheet (PDF) 📄 Offer letter ✓ Due diligence
Listing remarks
Welcome to 5300 Flower Drive in El Paso, Texas. This 3-bedroom, 1.5-bathroom, 1,658 sqft home offers a functional floor plan with 2 living spaces and natural light throughout for your family gatherings. The kitchen features ample cabinet and counter space. Bedrooms are well-sized and offer flexibility for a variety of uses. This home includes two refrigerated air units and a cozy fireplace to add comfort during hot and cold weather. The front yard and private fenced back yard provide plenty of space for outdoor use, perfect for family gatherings or quiet evenings. Conveniently located with approximate driving times of 5 minutes to I-10, 15 minutes to the airport, and just under 20 minutes t
Key facts
- Two living spaces
- 9,430 sq ft lot
- Built 1957
Tags
Property features AI
Finance
- Other: Probate listing
- HOA & community: No HOA fees
Exterior
- Utilities: Has heating; Has cooling
- Home design: Single family residence
- Construction: Brick construction; Shingle roof; Total building area approximately 1658
- Exterior features: Back yard access; Fenced yard (front and back)
Interior
- Kitchen: Cooktop; Free-standing gas oven
- Flooring: Tile; Vinyl; Wood
- Bathrooms: 1 full bathroom; 1 half bathroom
- Heating & cooling: Central heating (2+ units); Refrigerated cooling; Ceiling fans
- Interior features: Multiple living areas; Ceiling fans; Shutters on windows; One fireplace
Neighborhood map
What this means for you Summary
Snapshot
- This is a 3-bed/2.0-bath single-family listed at $204k.
Deal economics
- At list price, monthly cash flow is $-259 ($-3k/yr) — negative.
- To cash-flow at today's rent, offer at most $158k (22.5% below list).
- To meet the 1% rule (rent ≥ 1% of price), the offer needs to be $148k (27.6% below list).
- Recommended offer: $148k (27.6% below list) — sets the bar for 1% rule.
Location & tenants
- Location reads 81/100 on livability (#23 in TX, #1,375 nationally) — a professional / high-income tenant draw. Strengths: commute A+, cost of living A+, housing A+; Watch: employment D+.
- El Paso ISD (urban): math 27% / reading 37% proficiency, ranked #591 of 826 in TX (top 72%) — families likely to look elsewhere, expect single-tenant / working-renter base with shorter leases; 65% free/reduced lunch — lower-income household profile, screen leases tightly.
- Zoned schools: Clardy El (math 12% / reading 17%); Henderson Middle (math 10% / reading 19%); Jefferson H S (math 17% / reading 18%, grade F, #1,451 of 1,632 statewide, top 89%, 1,107 students, 97% FRL) — zoned schools average 97% FRL vs 65% district-wide (32 pts higher); higher-poverty schools than district average — tighter screening recommended.
- Zoned-school proficiency averages 16% at this address vs 32% district-wide (-16 pts) — the specific schools serving this property underperform the El Paso ISD average; the district grade overstates school quality for this exact location.
- Market conditions: 61 active listings in the ZIP; 7 comparable units currently listed for rent nearby; rentals leasing fast (median 5d on market — plan ~1-2 weeks tenant-placement turnaround); 2,196 units permitted in El Paso County in 2024 (143 in 5+ unit buildings).
Forward outlook
- In year one you build about $22k of equity ($1k loan paydown + $20k appreciation (10.0% local appreciation)).
- El Paso County population projected at +10% by 2050 — modest demand growth; plan on rents tracking national, not racing it.
- By year 2, paydown + projected appreciation supports a ~$35k cash-out refi (75% LTV) — recoverable capital for the next deal without selling this one.
Negotiation context
- Only 12 days on market — expect competitive offers; lowballing is unlikely to land.
Risks & watch-outs
- Watch-outs: built in 1957 — expect roof / HVAC / electrical / plumbing capex.
- Climate carrying-cost: extreme-heat days projected 7→25/yr by 2055 (HVAC capex compounding) — expect insurance premiums to compound above CPI over the hold.
Questions for the listing agent
- What do current leases actually rent for vs. the listed asking? Can we see a recent rent roll and the last 12 months of T-12 income?
- Built in 1957 — when were the roof, HVAC, electrical panel, plumbing, and water heater last replaced?
- Is there a deadline driving the sale (1031 exchange, divorce, estate, relocation)? That informs how much negotiation room exists.
- Schools are B-rated — typically a magnet for longer-tenancy family renters. What's the average tenant stay here, and is there a school-zone premium baked into asking?
- The area grade is low — what's the realistic commute time and amenity access for the typical tenant pool here? Any planned neighborhood developments (good or bad) we should know about?
- What's the average days-on-market for RENTAL listings here right now (not sales)? A rising rental-DOM trend means longer vacancies and softer asking-rent achievability than the comps imply.
- What's the recent tenant-quality profile in this submarket — average credit score on applications, eviction rate, late-payment / NSF rate, and stable-employment percentage? A property-management company in the area should have these aggregated.
- How much new for-sale + rental construction is in the pipeline within 1–3 miles? Heavy new supply typically softens prices + rents 12–24 months out; constrained supply supports both.
Investment metrics
- 1% rule
- 0.72% ✗
- Cap rate
- 4.77%
- Cash-on-cash
- -5.45%
- DSCR
- 0.76
- GRM
- 11.5
CMA / ARV
No comps found within radius.
Projected returns pro-forma
10.0% appreciation · 3.0% rent growth · sell at horizon
- IRR
- 20.4%
- Equity multiple
- 2.66×
- Total profit
- $94,613
- Equity at exit
- $183,777
- IRR
- 18.6%
- Equity multiple
- 6.11×
- Total profit
- $291,677
- Equity at exit
- $396,321
Cash invested: $57,119 (down + closing). Projections, not guarantees.
Landlord ↔ Tenant lean methodology
- Overall (STATE)
- 87 Strongly Landlord-Friendly
- State Texas
- 87 Strongly Landlord-Friendly · R+5
- County
- — inherits STATE
- City
- — inherits STATE
ZIP-level market 79905
- Home prices YoY
- 12.8%
- Active inventory
- 61
- Price-to-rent
- 11.5×
Monthly cashflow live
- Estimated rent
- $1,477 high interval (Pro) →
- Mortgage (P&I)
- −$1,070
- Tax from tax record
- −$271 /mo · $3,258/yr
- Insurance
- −$85
- HOA
- −$0
- Vacancy / Maint / Mgmt
- −$310
- Net cashflow
- $-259
Break-even live
Sensitivity live
| Price | -10% $-144 | -5% $-202 | +0% $-259 | +5% $-317 | +10% $-375 |
|---|---|---|---|---|---|
| Rent | -10% $-376 | -5% $-318 | +0% $-259 | +5% $-201 | +10% $-143 |
| Rate | -1.0pp $-157 | -0.5pp $-208 | base $-259 | +0.5pp $-312 | +1.0pp $-366 |
UW: 25.0% down · 7.5% · 30yr · 1.5% tax · 5.0% vac · 8.0% maint · 8.0% mgmt
Financing live
Cash to close
- Down payment
- $50,999
- Closing costs
- $6,120
- Reserves months
- —
- Total cash needed
- —
Loan-product check · same deal, 3 products live
Conventional
25% down · 7.5% · 30yr
- Down + closing
- —
- Monthly P&I
- —
- Monthly cashflow
- —
- DSCR
- —
- Eligible?
- —
Personal DTI + credit; lowest rate.
DSCR
20% down · 8.5% · 30yr
- Down + closing
- —
- Monthly P&I
- —
- Monthly cashflow
- —
- DSCR
- —
- Eligible?
- —
No personal income docs; deal must DSCR.
Hard money
10% down · 12.0% · 12mo
- Down + closing
- —
- Monthly P&I
- —
- Monthly cashflow
- —
- DSCR
- —
- Eligible?
- —
Short-term bridge; refi at stabilization.
Rent comps 7 comps
| Address | Beds | Baths | Sqft | Rent | $/sqft | DOM | Units | Dist |
|---|---|---|---|---|---|---|---|---|
| 649 De Vargas Dr El Paso, TX | 3.0 | 1.0 | 1518 | $1,500 | $0.99 | 12d | 1 | 0.14mi |
| 517 Val Verde St Unit B El Paso, TX | 2.0 | 2.0 | 1200 | $1,300 | $1.08 | 4d | 1 | 0.43mi |
| 726 Medina St El Paso, TX | 3.0 | 2.0 | 1310 | $1,600 | $1.22 | 4d | 1 | 0.66mi |
| 339 Medina St Unit A El Paso, TX | 4.0 | 2.0 | 1300 | $1,465 | $1.13 | 45d | 1 | 0.66mi |
| 252 Trinity Pl El Paso, TX | 3.0 | 2.0 | 1876 | $1,900 | $1.01 | 4d | 1 | 0.96mi |
| 3816 Findley Ave El Paso, TX | 2.0 | 1.0 | 1149 | $1,080 | $0.94 | 4d | 1 | 1.46mi |
| 3816 Findley Ave El Paso, TX | 2.0 | 1.0 | 1149 | $1,080 | $0.94 | 25d | 1 | 1.46mi |
Listing history 2 events
-
2026-05-12status Pending 854-char remark
-
2026-04-30$203,997 Active 854-char remark
ⓘ Source: listings_history table (triggers on properties + properties_extension) + one-shot
backfill from property_details.listing_events for pre-trigger history.
Tax reassessment forecast TX · Resets to sale price
- Current annual tax
- $3,258 · $271/mo
- Projected year-2 tax
- $3,733 · $311/mo
- Expected delta
- +$475/yr (+$40/mo · 14.6%)
ⓘ Screening estimate from a state-policy table — verify with the county assessor before closing.
Climate risk First Street
- Flood 4/10 Moderate FEMA zone X · 22% chance over 30 yrs
- Wildfire 1/10 Low
- Heat 6/10 Major 7 d/yr ≥102°F today · 25 d/yr by 30 yrs out
- Wind 1/10 Low
- Air quality 2/10 Low 1 unhealthy d/yr today · 2 by 30 yrs out
Nearby sold comps map
Loading sold comps map…
Walkable amenities ~0.75 mi
Loading nearby amenities…
Taxation est. · year 1
- Rental income
- $17,725
- − Mortgage interest
- −$11,427
- − Property taxes
- −$3,258
- − Insurance
- −$1,020
- − Repairs & maintenance
- −$1,418
- − Management
- −$1,418
- − Depreciation
- −$5,934
- Taxable loss
- −$6,751
- Est. tax savings @ 24.0%
- +$1,620
- After-tax cash flow
- $-1,493/yr
For passive investors: Depreciation is non-cash, so a rental often shows a tax loss while cash-flowing — sheltering income. Rental losses are passive: they offset passive income freely, and up to $25,000/yr can offset ordinary (W-2) income if you actively participate and your MAGI is under $100k (phasing out to $0 by $150k); unused losses carry forward. On sale, claimed depreciation is recaptured at up to 25%, and gains may owe capital-gains tax (a 1031 exchange can defer both). Figures are a year-1 estimate at your 24.0% rate — not tax advice; consult a CPA.
Schools (NCES district)
- District
- El Paso ISD
- NCES district ID
- 4818300
- Math proficiency
- 27% ▼ -24.00%
- Reading proficiency
- 37% ▼ -7.00%
- Median HH income
- $38,704
- Composite
- 26.75/100
- National rank
- #7138
- State rank
- #591 of 826 in TX
Livability — El Paso
- Score
- 81/100
- State rank
- #23
- US rank
- #1375
Category grades
Schools grade is shown separately in the Schools card above.
Census & demographics
- Census place
- El Paso, TX
- City population
- 630,223
- Population (ZIP)
- 22,062
Population outlook (El Paso County) Hauer SSP2
- Today (2025)
- 897,899 people
- By 2030
- 922,694 · +2.8%
- By 2040
- 960,492 · +7.0%
- By 2050
- 982,919 · +9.5%
- By 2075
- 997,266 · +11.1%
- By 2100
- 900,630 · +0.3%
Race, ethnicity, and origin ACS 2023
- Neighborhood character
- Predominantly Hispanic (93%)
- Race & ethnicity
- Hispanic / Latino 93% Two or more races 50% White 2% Native American 1% Pacific Islander 1%
- Hispanic origin (detail)
- Mexican 89%
- Foreign-born
- 32% · Canada
- Languages at home
- 14% English-only · Spanish 86%
Political lean MEDSL · El Paso
- 2024 margin
- D (+15.1) · D 57.0% · R 41.8% · Other 1.2%
- 2008→2024 swing
- -17.4pp toward R · 2008: 32.5pp · 2024: 15.1pp
- All cycles
- 2024: D+15.1 2020: D+35.1 2016: D+43.2 2012: D+32.6 2008: D+32.5
Not yet ingested
- Civics
- —
Market trends
- HPI YoY
- ▲ 29.29%
- Current HPI
- 258.3487
- Rent YoY
- —
- Metro
- —
- State GDP YoY
- ▲ 3.95%
- F500 in state
- 110
Industry mix (Fortune 500 HQ in TX)
| Industry | F500 HQs | Revenue |
|---|---|---|
| Energy | 16 | $1,198B |
|
||
| Technology | 5 | $198B |
|
||
| Engineering / Construction | 4 | $72B |
|
||
| Energy Services | 3 | $60B |
|
||
| Utilities | 3 | $41B |
|
||
| Healthcare | 2 | $330B |
|
||
Price history
3 events — show timeline
- 2026-05-29 Sold (Public Records) — Public Records
- 2026-05-12 Pending — GEPARMLS
- 2026-04-30 Listed $203,997 GEPARMLS
Property tax history
+4.1%/yrLatest (2025): $3,258 · +12.0% YoY. Source: county tax records.
Cash-flow waterfall
monthlySold comps — $/sqft
last 12 mo · ≤1 miLoading sold comps…