 🏗️ New Construction
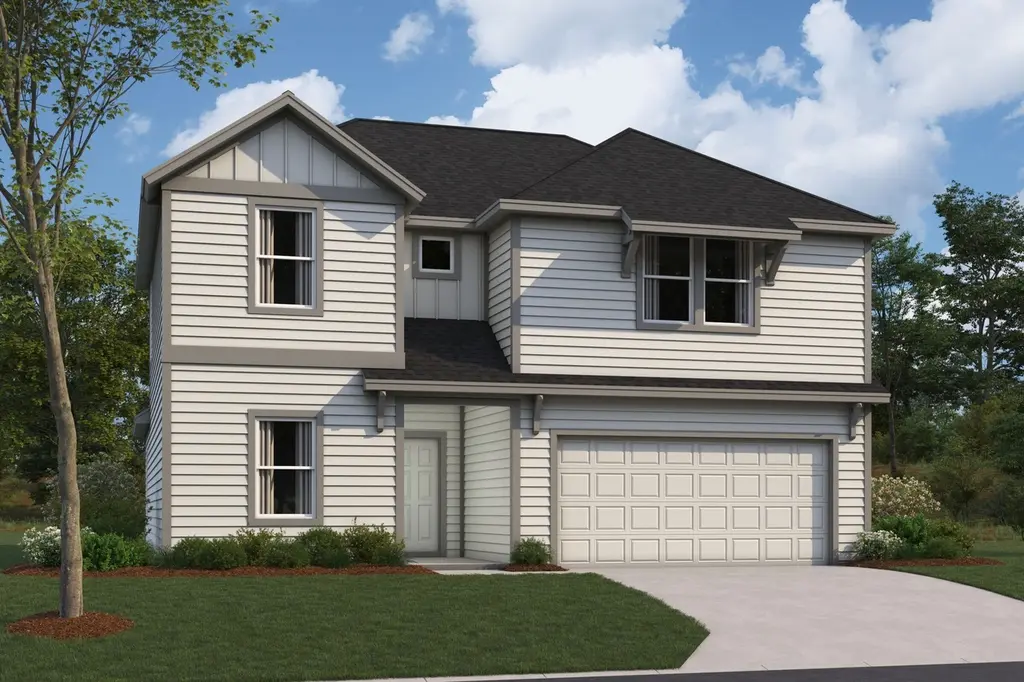
Caprock Plan · Austin, TX
Flood risk 1/10 · Minimal
- FEMA flood zone
- X (unshaded)
- Chance of flooding over 30 yrs
- 0.0%
- Est. flood insurance / yr
- $507 – $1,088
Fire risk 4/10 · Minor
- Est. fire insurance / yr
- $1,222 – $2,270
Heat risk 8/10 · Major
- Hot days now (above 108°F)
- 7 days/yr
- Hot days in 30 yrs
- 23 days/yr
Wind risk 8/10 · Major
- Chance of severe wind over 30 yrs
- 80.0%
Air-quality risk 2/10 · Minimal
- Unhealthy air days now
- 0 days/yr
- Unhealthy air days in 30 yrs
- 1 days/yr
Risk factors via First Street. Map © Google.
Why this score? — see what drove the F grade
The composite is a weighted blend of 9 inputs, each scored 0–100. Each bar is that input's sub-score; the figure is the points it added to the 100-point composite (weight × sub-score).
- ARV discount +7.5/15.0
- Cash flow +4.5/30.0
- Livability +4.1/5.0
- Schools +3.4/10.0
- Appreciation +3.2/10.0
- Condition / age +2.5/5.0
- Rent growth +2.2/5.0
- 1% rule +0.5/10.0
- DSCR +0.0/10.0
$387,990
🖨 Deal sheet 📄 Offer letter ✓ Due diligence
Listing remarks MLS
The Caprock floorplan is a versatile 2-story home offering 2,543 square feet of thoughtfully designed living space. With 4-5 bedrooms, 2.5 bathrooms, and a 2-car garage, this home is perfect for those seeking both space and comfort.
Key facts
- 2 garage spots
- Listed 470 days
Neighborhood map
What this means for you Summary
Snapshot
- This is a 4-bed/2.5-bath single-family listed at $388k.
Deal economics
- At list price, monthly cash flow is $-1k ($-15k/yr) — negative.
- To cash-flow at today's rent, offer at most $302k (22.2% below list).
- To meet the 1% rule (rent ≥ 1% of price), the offer needs to be $264k (31.9% below list).
- Recommended offer: $264k (31.9% below list) — sets the bar for 1% rule.
- Cap rate 3.2% vs local median 1.8% in Austin — top-decile yield for the area; either an underpriced asset or a hidden risk that comps aren't pricing in. Stress-test before assuming the spread holds.
Location & tenants
- Location reads 82/100 on livability (#16 in TX, #1,208 nationally) — a professional / high-income tenant draw. Strengths: amenities A+, commute A+, employment A+; Watch: cost of living D, crime F.
- Austin ISD (urban): math 33% / reading 44% proficiency, ranked #431 of 826 in TX (top 52%) — families likely to look elsewhere, expect single-tenant / working-renter base with shorter leases.
- Market conditions: Rents soft (-1.0%/yr); 391 active listings in the ZIP; 19 comparable units currently listed for rent nearby; rentals at typical pace (median 18d on market — plan ~3-4 weeks tenant-placement turnaround); solid renter incomes; 17,121 units permitted in Travis County in 2024 (11,963 in 5+ unit buildings).
- This rent runs 34% of the median local income ($93k/yr) — at the standard rent-burdened threshold; future hikes will face affordability resistance.
Forward outlook
- Local home prices are declining (-3.0%/yr); year-one equity from $3k of loan paydown is wiped out by about $14k of value loss. Plan a longer hold.
- Travis County population projected at +60% by 2050 — long-run rental-demand tailwind backs the buy-and-hold thesis.
Negotiation context
- It's been on market 470 days — a 12% lower offer ($341k) is reasonable based on typical stale-listing flexibility.
Risks & watch-outs
- Climate carrying-cost: severe wind risk, 80% chance of damaging wind over 30y; extreme-heat days projected 7→23/yr by 2055 (HVAC capex compounding) — expect insurance premiums to compound above CPI over the hold.
Questions for the listing agent
- What do current leases actually rent for vs. the listed asking? Can we see a recent rent roll and the last 12 months of T-12 income?
- It's been on market 470 days. Have you received any prior offers? Is the seller open to a 32% concession, seller financing, or rate buy-down credit?
- Why hasn't it sold? Are there any deal-killer items the seller is aware of (foundation, flood, title, zoning, code violations)?
- Is there a deadline driving the sale (1031 exchange, divorce, estate, relocation)? That informs how much negotiation room exists.
- Crime grade is F in this area — have there been break-ins, vandalism, or insurance claims at this property in the last 3 years? What carrier currently insures it and at what premium?
- The area grade is low — what's the realistic commute time and amenity access for the typical tenant pool here? Any planned neighborhood developments (good or bad) we should know about?
- What's the average days-on-market for RENTAL listings here right now (not sales)? A rising rental-DOM trend means longer vacancies and softer asking-rent achievability than the comps imply.
- What's the recent tenant-quality profile in this submarket — average credit score on applications, eviction rate, late-payment / NSF rate, and stable-employment percentage? A property-management company in the area should have these aggregated.
- How much new for-sale + rental construction is in the pipeline within 1–3 miles? Heavy new supply typically softens prices + rents 12–24 months out; constrained supply supports both.
Investment metrics
- 1% rule
- 0.55% ✗
- Cap rate
- 3.22%
- Cash-on-cash
- -10.97%
- DSCR
- 0.51
- GRM
- 15.1
CMA / ARV
- ARV (median comp)
- $479,464
- List price
- $387,990
- Delta
- -19.08%
- Verdict
- UNDERPRICED
- Comps
- 20 within 1.0 mi
Show comp detail 12 sales within ~0.75 mi
| Address | Dist | Beds/Ba | Sqft | Sold | Price | $/sf | Match |
|---|---|---|---|---|---|---|---|
| 4521 Bridal Veil Dr | 0.23mi | 4/2.5 | 2,543 (0%) | 4mo | $429,990 | $169 | 86 |
| 12112 Dillon Falls Dr | 0.25mi | 4/2.5 | 2,543 (0%) | 5mo | $404,990 | $159 | 84 |
| 4508 Bridal Veil Dr | 0.22mi | 5/3.0 (+1) | 2,543 (0%) | 0mo | $419,990 | $165 | 82 |
| 4609 Lava Island Dr | 0.28mi | 5/3.0 (+1) | 2,543 (0%) | 1mo | $414,990 | $163 | 79 |
| 4513 Lava Island Dr | 0.30mi | 5/3.0 (+1) | 2,543 (0%) | 1mo | $424,990 | $167 | 79 |
| 4529 Bridal Veil Dr | 0.23mi | 5/3.0 (+1) | 2,543 (0%) | 5mo | $454,990 | $179 | 78 |
| 4501 Lava Island Dr | 0.31mi | 5/3.0 (+1) | 2,543 (0%) | 2mo | $442,990 | $174 | 77 |
| 11921 Dillon Falls Dr | 0.17mi | 4/2.5 | 2,323 (-9%) | 6mo | $389,990 | $168 | 73 |
| 4509 Beacon Bay Dr | 0.20mi | 4/2.5 | 2,323 (-9%) | 4mo | $399,990 | $172 | 73 |
| 20117 Aqua Reef Dr | 0.19mi | 4/3.0 | 2,255 (-11%) | 4mo | $439,990 | $195 | 67 |
| 10923 Preston Trails Dr | 0.69mi | 3/2.0 (-1) | 2,438 (-4%) | 1mo | $599,900 | $246 | 53 |
| 10925 Preston Trails Dr | 0.68mi | 4/3.0 | 2,343 (-8%) | 5mo | $350,000 | $149 | 49 |
Match score weights: distance 35% · size 25% · config 20% · recency 20%. Top-matched comps best support the ARV.
Projected returns pro-forma
-3.0% appreciation · 0.0% rent growth · sell at horizon
- IRR
- -39.5%
- Equity multiple
- -0.22×
- Total profit
- $-163,555
- Equity at exit
- $71,490
- IRR
- -84.3%
- Equity multiple
- -1.03×
- Total profit
- $-272,815
- Equity at exit
- $41,455
Cash invested: $134,250 (down + closing). Projections, not guarantees.
Landlord ↔ Tenant lean methodology
- Overall (STATE)
- 87 Strongly Landlord-Friendly
- State Texas
- 87 Strongly Landlord-Friendly · R+5
- County
- — inherits STATE
- City
- — inherits STATE
ZIP-level market 78747
- Home prices YoY
- -1.9%
- Rents YoY
- -1.0%
- Active inventory
- 391
- Price-to-rent
- 12.2×
Monthly cashflow live
- Estimated rent
- $2,641 high interval (Pro) →
- Mortgage (P&I)
- −$2,514
- Tax est. 1.5%
- −$599 /mo · $7,192/yr
- Insurance
- −$200
- HOA
- −$0
- Vacancy / Maint / Mgmt
- −$555
- Net cashflow
- $-1,227
Break-even live
UW: 25.0% down · 7.5% · 30yr · 1.5% tax · 5.0% vac · 8.0% maint · 8.0% mgmt
Financing live
Cash to close
- Down payment
- $119,866
- Closing costs
- $14,384
- Reserves months
- —
- Total cash needed
- —
Loan-product check · same deal, 3 products live
Conventional
25% down · 7.5% · 30yr
- Down + closing
- —
- Monthly P&I
- —
- Monthly cashflow
- —
- DSCR
- —
- Eligible?
- —
Personal DTI + credit; lowest rate.
DSCR
20% down · 8.5% · 30yr
- Down + closing
- —
- Monthly P&I
- —
- Monthly cashflow
- —
- DSCR
- —
- Eligible?
- —
No personal income docs; deal must DSCR.
Hard money
10% down · 12.0% · 12mo
- Down + closing
- —
- Monthly P&I
- —
- Monthly cashflow
- —
- DSCR
- —
- Eligible?
- —
Short-term bridge; refi at stabilization.
Rent comps 19 comps
| Address | Beds | Baths | Sqft | Rent | $/sqft | DOM | Units | Dist |
|---|---|---|---|---|---|---|---|---|
| 4708 Sea Salt Dr Austin, TX | 3.0 | 2.5 | 2279 | $2,800 | $1.23 | 43d | 1 | 0.02mi |
| 4700 Sea Salt Dr Austin, TX | 3.0 | 2.0 | 2429 | $2,600 | $1.07 | 23d | 1 | 0.05mi |
| 11802 Hurricane Haze Dr Austin, TX | 3.0 | 2.5 | 2146 | $2,845 | $1.33 | 20d | 1 | 0.07mi |
| 4505 Cool Gray Cv Austin, TX | 4.0 | 3.0 | 2435 | $2,595 | $1.07 | 2d | 1 | 0.11mi |
| 11313 County Down Dr Austin, TX | 4.0 | 2.0 | 2334 | $2,900 | $1.24 | 14d | 1 | 0.65mi |
| 11628 Lago de Garda Dr Austin, TX | 5.0 | 2.5 | 2637 | $2,695 | $1.02 | 4d | 1 | 0.76mi |
| 11121 Mickelson Dr Austin, TX | 4.0 | 3.0 | 2656 | $2,500 | $0.94 | 43d | 1 | 0.82mi |
| 607 Allende Bnd Austin, TX | 5.0 | 3.5 | 3327 | $3,795 | $1.14 | 1d | 1 | 1.09mi |
| 601 Puerta Vallarta Ln Austin, TX | 3.0 | 2.0 | 1843 | $2,490 | $1.35 | 43d | 1 | 1.12mi |
| 12215 Coronilla Bnd Manchaca, TX | 4.0 | 3.0 | 2372 | $2,895 | $1.22 | 4d | 1 | 1.27mi |
| 12215 Coronilla Bnd Manchaca, TX | 4.0 | 3.0 | 2372 | $2,900 | $1.22 | 17d | 1 | 1.27mi |
| 12215 Coronilla Bnd Manchaca, TX | 4.0 | 3.0 | 2372 | $2,900 | $1.22 | 23d | 1 | 1.27mi |
| 5701 Southerner Way Austin, TX | 4.0 | 2.5 | 2488 | $2,399 | $0.96 | 4d | 1 | 1.30mi |
| 10412 Premier Park St Austin, TX | 4.0 | 3.5 | 2340 | $2,450 | $1.05 | 17d | 1 | 1.37mi |
| 6501 Dragride Rd Buda, TX | 5.0 | 3.0 | 2585 | $2,595 | $1.00 | 16d | 1 | 1.37mi |
| 10215 River Plantation Dr Unit B Austin, TX | 3.0 | 2.5 | 2707 | $2,550 | $0.94 | 17d | 1 | 1.37mi |
| 12600 Purple Prairie Ln Buda, TX | 5.0 | 3.5 | 3506 | $3,995 | $1.14 | 43d | 1 | 1.41mi |
| 12603 Purple Prairie Ln Buda, TX | 4.0 | 3.0 | 2691 | $2,995 | $1.11 | 4d | 1 | 1.43mi |
| 6201 Pine Leaf Trl Austin, TX | 4.0 | 2.5 | 2381 | $2,750 | $1.15 | 2d | 1 | 1.50mi |
Listing history 21 events
-
2026-06-18days on market $387,990 Active 470 DOM
-
2026-06-17days on market $387,990 Active 469 DOM
-
2026-06-16days on market $387,990 Active 468 DOM
-
2026-06-15days on market $387,990 Active 467 DOM
-
2026-06-13days on market $387,990 Active 465 DOM
-
2026-06-09days on market $387,990 Active 461 DOM
-
2026-06-08days on market $387,990 Active 460 DOM
-
2026-06-07days on market $387,990 Active 459 DOM
-
2026-06-05days on market $387,990 Active 456 DOM
-
2026-06-03days on market $387,990 Active 455 DOM
-
2026-06-02days on market $387,990 Active 454 DOM
-
2026-06-01days on market $387,990 Active 453 DOM
-
2026-05-31days on market $387,990 Active 452 DOM
-
2026-02-21price $387,990 232-char remark
Show marketing remark (232 chars)
The Caprock floorplan is a versatile 2-story home offering 2,543 square feet of thoughtfully designed living space. With 4-5 bedrooms, 2.5 bathrooms, and a 2-car garage, this home is perfect for those seeking both space and comfort.
-
2026-02-04price $386,990 232-char remark
Show marketing remark (232 chars)
The Caprock floorplan is a versatile 2-story home offering 2,543 square feet of thoughtfully designed living space. With 4-5 bedrooms, 2.5 bathrooms, and a 2-car garage, this home is perfect for those seeking both space and comfort.
-
2026-01-27price $385,990 232-char remark
Show marketing remark (232 chars)
The Caprock floorplan is a versatile 2-story home offering 2,543 square feet of thoughtfully designed living space. With 4-5 bedrooms, 2.5 bathrooms, and a 2-car garage, this home is perfect for those seeking both space and comfort.
-
2026-01-20price $384,990 232-char remark
Show marketing remark (232 chars)
The Caprock floorplan is a versatile 2-story home offering 2,543 square feet of thoughtfully designed living space. With 4-5 bedrooms, 2.5 bathrooms, and a 2-car garage, this home is perfect for those seeking both space and comfort.
-
2025-12-04price $383,990 232-char remark
Show marketing remark (232 chars)
The Caprock floorplan is a versatile 2-story home offering 2,543 square feet of thoughtfully designed living space. With 4-5 bedrooms, 2.5 bathrooms, and a 2-car garage, this home is perfect for those seeking both space and comfort.
-
2025-09-05price $428,990 232-char remark
Show marketing remark (232 chars)
The Caprock floorplan is a versatile 2-story home offering 2,543 square feet of thoughtfully designed living space. With 4-5 bedrooms, 2.5 bathrooms, and a 2-car garage, this home is perfect for those seeking both space and comfort.
-
2025-04-12price $427,990 232-char remark
Show marketing remark (232 chars)
The Caprock floorplan is a versatile 2-story home offering 2,543 square feet of thoughtfully designed living space. With 4-5 bedrooms, 2.5 bathrooms, and a 2-car garage, this home is perfect for those seeking both space and comfort.
-
2025-03-06$426,990 Active 232-char remark
Show marketing remark (232 chars)
The Caprock floorplan is a versatile 2-story home offering 2,543 square feet of thoughtfully designed living space. With 4-5 bedrooms, 2.5 bathrooms, and a 2-car garage, this home is perfect for those seeking both space and comfort.
ⓘ Source: listings_history table (triggers on properties + properties_extension) + one-shot
backfill from property_details.listing_events for pre-trigger history.
Climate risk First Street
- Flood 1/10 Low FEMA zone X (unshaded) · 0% chance over 30 yrs
- Wildfire 4/10 Moderate
- Heat 8/10 Severe 7 d/yr ≥108°F today · 23 d/yr by 30 yrs out
- Wind 8/10 Severe 80% chance of damaging wind over 30 yrs
- Air quality 2/10 Low 0 unhealthy d/yr today · 1 by 30 yrs out
Nearby sold comps map
Loading sold comps map…
Walkable amenities ~0.75 mi
Loading nearby amenities…
Taxation est. · year 1
- Rental income
- $31,690
- − Mortgage interest
- −$26,857
- − Property taxes
- −$7,192
- − Insurance
- −$2,397
- − Repairs & maintenance
- −$2,535
- − Management
- −$2,535
- − Depreciation
- −$13,948
- Taxable loss
- −$23,775
- Est. tax savings @ 24.0%
- +$5,706
- After-tax cash flow
- $-9,021/yr
For passive investors: Depreciation is non-cash, so a rental often shows a tax loss while cash-flowing — sheltering income. Rental losses are passive: they offset passive income freely, and up to $25,000/yr can offset ordinary (W-2) income if you actively participate and your MAGI is under $100k (phasing out to $0 by $150k); unused losses carry forward. On sale, claimed depreciation is recaptured at up to 25%, and gains may owe capital-gains tax (a 1031 exchange can defer both). Figures are a year-1 estimate at your 24.0% rate — not tax advice; consult a CPA.
Schools (NCES district)
- District
- Austin ISD
- NCES district ID
- 4808940
- Math proficiency
- 33% ▼ -19.00%
- Reading proficiency
- 44% ▼ -7.00%
- Median HH income
- $54,627
- Composite
- 33.65/100
- National rank
- #5397
- State rank
- #431 of 826 in TX
Livability — Austin
- Score
- 82/100
- State rank
- #16
- US rank
- #1208
Category grades
Schools grade is shown separately in the Schools card above.
Census & demographics
- Census place
- Austin, TX
- County
- Travis County · 1,299,254 people
- City population
- 1,066,854
- Metro
- Austin-Round Rock-Georgetown, TX
- Population (ZIP)
- 22,180
- Household income
- $92,748
- Rent vs Own
- Severe rent burden
- 812.0
Population outlook (Travis County) Hauer SSP2
- Today (2025)
- 1,545,133 people
- By 2030
- 1,729,269 · +11.9%
- By 2040
- 2,097,596 · +35.8%
- By 2050
- 2,463,890 · +59.5%
- By 2075
- 3,249,374 · +110.3%
- By 2100
- 3,801,868 · +146.1%
Race, ethnicity, and origin ACS 2023
- Neighborhood character
- Diverse neighborhood (Simpson 0.61)
- Race & ethnicity
- Hispanic / Latino 51% White 34% Two or more races 20% Black 7% Asian 3%
- Hispanic origin (detail)
- Mexican 40% Puerto Rican 1%
- Common ancestry
- Lithuanian 2% Slovak 1% Romanian 1%
- Foreign-born
- 13% · Canada, Vietnam, China
- Languages at home
- 64% English-only · Spanish 31% Other Asian/Pacific 1% Vietnamese 1%
Political lean MEDSL · Travis
- 2024 margin
- Solid D (+39.3) · D 68.8% · R 29.4% · Other 1.8%
- 2008→2024 swing
- +9.9pp toward D · 2008: 29.4pp · 2024: 39.3pp
- All cycles
- 2024: D+39.3 2020: D+45.0 2016: D+38.9 2012: D+23.9 2008: D+29.4
Not yet ingested
- Civics
- —
Market trends
- HPI YoY
- ▼ -3.69%
- Current HPI
- 192.9499
- Rent YoY
- ▼ -1.01%
- Metro
- Austin-Round Rock-Georgetown, TX
- State GDP YoY
- ▲ 3.95%
- F500 in state
- 110
Industry mix (Fortune 500 HQ in TX)
| Industry | F500 HQs | Revenue |
|---|---|---|
| Energy | 16 | $1,198B |
|
||
| Technology | 5 | $198B |
|
||
| Engineering / Construction | 4 | $72B |
|
||
| Energy Services | 3 | $60B |
|
||
| Utilities | 3 | $41B |
|
||
| Healthcare | 2 | $330B |
|
||
Price history
-9.1% since first listed8 events — show timeline
- 2026-02-21 Price Changed $387,990 Zillow
- 2026-02-04 Price Changed $386,990 Zillow
- 2026-01-27 Price Changed $385,990 Zillow
- 2026-01-20 Price Changed $384,990 Zillow
- 2025-12-04 Price Changed $383,990 Zillow
- 2025-09-05 Price Changed $428,990 Zillow
- 2025-04-12 Price Changed $427,990 Zillow
- 2025-03-06 Listed $426,990 Zillow
Cash-flow waterfall
monthlySold comps — $/sqft
last 12 mo · ≤1 miLoading sold comps…