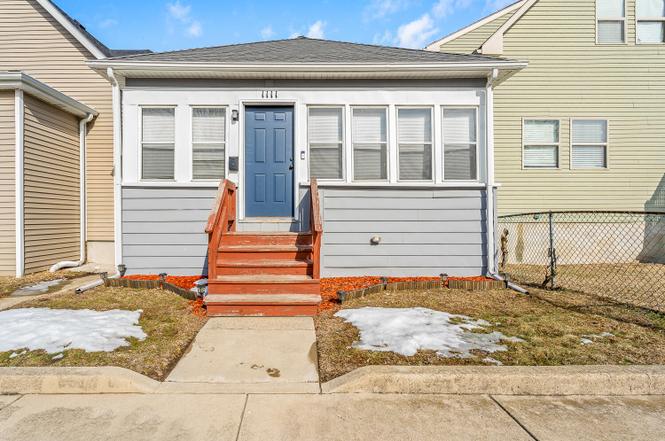
1111 Truman St · Hammond, IN
Flood risk 4/10 · Minor
- FEMA flood zone
- X (unshaded)
- Chance of flooding over 30 yrs
- 0.21%
- Est. flood insurance / yr
- $473 – $860
Fire risk 1/10 · Minimal
- Est. fire insurance / yr
- $717 – $1,331
Heat risk 3/10 · Minor
- Hot days now (above 101°F)
- 7 days/yr
- Hot days in 30 yrs
- 15 days/yr
Wind risk 2/10 · Minimal
- Chance of severe wind over 30 yrs
- 0.0%
Air-quality risk 4/10 · Minor
- Unhealthy air days now
- 5 days/yr
- Unhealthy air days in 30 yrs
- 6 days/yr
Risk factors via First Street. Map © Google.
Why this score? — see what drove the D- grade
The composite is a weighted blend of 9 inputs, each scored 0–100. Each bar is that input's sub-score; the figure is the points it added to the 100-point composite (weight × sub-score).
- Cash flow +10.0/30.0
- Appreciation +10.0/10.0
- Rent growth +4.4/5.0
- Livability +3.5/5.0
- DSCR +2.9/10.0
- Condition / age +2.5/5.0
- 1% rule +2.1/10.0
- Schools +1.1/10.0
- ARV discount +0.0/15.0
$199,988
🖨 Deal sheet (PDF) 📄 Offer letter ✓ Due diligence
Listing remarks MLS
Just Like Brand New! What a great Package. Move in and Enjoy. The House is an extensive remodel. New Kitchen and Full Bath. Very good quality Materials. Granite, Ceramic / Glass Tiles. Stainless Steel Appliances. All New Plumbing Water lines and Fixtures. . Brand New Architectural Shingled Roof. New Windows, New Doors, New Electrical, New Plumbing, New Recess and Modern Lighting, New Furnace and A/C. Full Basement and a Fenced Yard.
Key facts
- Updated electrical
- Granite countertops
- Updated plumbing
Tags
Property features AI
Exterior
- Parking: Off-street parking; On-street parking
- Utilities: Public water; Public sewer
- Home design: One story; Built in 1910
- Construction: Unfinished basement
- Exterior features: No notable view
Interior
- Kitchen: Gas range; Refrigerator
- Bedrooms: Primary bedroom; Bedroom 2; Bedroom 3; Total rooms: 6; Has unfinished basement
- Flooring: Vinyl flooring
- Bathrooms: 1 full bathroom
- Heating & cooling: Forced air heating; Other cooling
- Interior features: No additional interior features listed
- Laundry & utility: Washer; Dryer
Neighborhood map
What this means for you Summary
Snapshot
- This is a 3-bed/1.0-bath single-family listed at $200k.
Deal economics
- At list price, monthly cash flow is $-120 ($-1k/yr) — negative.
- To cash-flow at today's rent, offer at most $179k (10.6% below list).
- To meet the 1% rule (rent ≥ 1% of price), the offer needs to be $143k (28.6% below list).
- Recommended offer: $143k (28.6% below list) — sets the bar for 1% rule.
Location & tenants
- Location reads 70/100 on livability (#143 in IN) — a middle-class / working-renter tenant base. Strengths: cost of living A+, housing A+, commute A; Watch: health & safety D+, employment D, crime F.
- School City Of Hammond (suburban): math 8% / reading 18% proficiency, ranked #289 of 301 in IN (top 96%) — low school quality limits family demand, transient renter base, plan for 1-2y turnover; 74% free/reduced lunch — lower-income household profile, screen leases tightly.
- Zoned schools: Henry W Eggers Middle School (math 5% / reading 17%, grade F, #312 of 330 statewide, top 95%, 855 students, 76% FRL); Hammond Central High School (math 8% / reading 37%, grade F, #339 of 369 statewide, top 93%, 1,863 students, 73% FRL) — zoned schools at 75% FRL track the district average.
- Market conditions: Rents rising fast (+7.6%/yr); 51 active listings in the ZIP; 11 comparable units currently listed for rent nearby; rentals at typical pace (median 17d on market — plan ~3-4 weeks tenant-placement turnaround); lower-income renter base — watch delinquency; 1,642 units permitted in Lake County in 2024 (14 in 5+ unit buildings).
- At $1,428/mo this rent would consume 46% of the median local household income ($37k/yr) (locally 900% of renters already pay >50% of income on rent) — very limited rent-growth headroom before tenants either downsize or default.
Forward outlook
- In year one you build about $21k of equity ($1k loan paydown + $20k appreciation (10.0% local appreciation)).
- Lake County population projected to shrink 7% by 2050 — rents likely to lag national; underwrite the cash flow, not the appreciation.
- By year 2, paydown + projected appreciation supports a ~$34k cash-out refi (75% LTV) — recoverable capital for the next deal without selling this one.
Negotiation context
- It's been on market 79 days — a 6% lower offer ($188k) is reasonable based on typical stale-listing flexibility.
- 3 sale attempts since 5y ago with the ask held roughly flat each time — persistent listings suggest the price (not the market) is what's stuck; bring a comps-based counter.
- Current owner paid $165k; 21% above their basis — modest negotiation headroom, anchor on the comps not their cost.
Risks & watch-outs
- Watch-outs: built in 1910 — expect roof / HVAC / electrical / plumbing capex.
Questions for the listing agent
- What do current leases actually rent for vs. the listed asking? Can we see a recent rent roll and the last 12 months of T-12 income?
- It's been on market 79 days. Have you received any prior offers? Is the seller open to a 29% concession, seller financing, or rate buy-down credit?
- Built in 1910 — when were the roof, HVAC, electrical panel, plumbing, and water heater last replaced?
- Why hasn't it sold? Are there any deal-killer items the seller is aware of (foundation, flood, title, zoning, code violations)?
- Is there a deadline driving the sale (1031 exchange, divorce, estate, relocation)? That informs how much negotiation room exists.
- Schools are F-rated, which usually means shorter tenancies and higher turnover. Who's the typical renter profile here, and what's been the actual vacancy rate?
- Crime grade is F in this area — have there been break-ins, vandalism, or insurance claims at this property in the last 3 years? What carrier currently insures it and at what premium?
- The area grade is low — what's the realistic commute time and amenity access for the typical tenant pool here? Any planned neighborhood developments (good or bad) we should know about?
- What's the average days-on-market for RENTAL listings here right now (not sales)? A rising rental-DOM trend means longer vacancies and softer asking-rent achievability than the comps imply.
- What's the recent tenant-quality profile in this submarket — average credit score on applications, eviction rate, late-payment / NSF rate, and stable-employment percentage? A property-management company in the area should have these aggregated.
- How much new for-sale + rental construction is in the pipeline within 1–3 miles? Heavy new supply typically softens prices + rents 12–24 months out; constrained supply supports both.
Investment metrics
- 1% rule
- 0.71% ✗
- Cap rate
- 5.57%
- Cash-on-cash
- -2.58%
- DSCR
- 0.89
- GRM
- 11.7
CMA / ARV
- ARV (on-the-fly)
- $143,325
- Comps found
- 12
Show comp detail 12 sales within ~0.75 mi
| Address | Dist | Beds/Ba | Sqft | Sold | Price | $/sf | Match |
|---|---|---|---|---|---|---|---|
| 1250 Sherman St | 0.58mi | 3/1.0 | 828 (+1%) | 1mo | $205,000 | $248 | 70 |
| 1170 Sibley St | 0.34mi | 2/1.0 (-1) | 808 (-1%) | 10mo | $60,000 | $74 | 69 |
| 1325 Truman St | 0.32mi | 2/1.0 (-1) | 860 (+5%) | 8mo | $95,000 | $110 | 65 |
| 4922 Hickory Ave | 0.56mi | 2/1.0 (-1) | 792 (-3%) | 4mo | $85,000 | $107 | 60 |
| 918 Willow Ct | 0.18mi | 2/2.0 (-1) | 880 (+7%) | 13mo | $164,900 | $187 | 60 |
| 4927-29 Chestnut Ave | 0.67mi | 2/1.0 (-1) | 816 (-0%) | 5mo | $146,000 | $179 | 59 |
| 5640 Beall Ave | 0.55mi | 3/1.0 | 903 (+10%) | 7mo | $110,000 | $122 | 52 |
| 1049 Drackert St | 0.56mi | 2/1.0 (-1) | 864 (+6%) | 11mo | $62,505 | $72 | 50 |
| 1254 150th St | 0.53mi | 3/1.0 | 891 (+9%) | 12mo | $90,000 | $101 | 50 |
| 5405 Birch Ave | 0.57mi | 2/1.0 (-1) | 700 (-14%) | 3mo | $128,500 | $184 | 42 |
| 5421 Birch Ave | 0.58mi | 2/1.0 (-1) | 700 (-14%) | 6mo | $150,000 | $214 | 39 |
| 4826 Cedar Ave | 0.73mi | 2/1.0 (-1) | 716 (-13%) | 12mo | $125,000 | $175 | 30 |
Match score weights: distance 35% · size 25% · config 20% · recency 20%. Top-matched comps best support the ARV.
Projected returns pro-forma
10.0% appreciation · 7.61% rent growth · sell at horizon
- IRR
- 23.7%
- Equity multiple
- 2.93×
- Total profit
- $108,128
- Equity at exit
- $180,165
- IRR
- 22.2%
- Equity multiple
- 7.09×
- Total profit
- $341,237
- Equity at exit
- $388,533
Cash invested: $55,997 (down + closing). Projections, not guarantees.
Landlord ↔ Tenant lean methodology
- Overall (STATE)
- 90 Strongly Landlord-Friendly
- State Indiana
- 90 Strongly Landlord-Friendly · R+11
- County
- — inherits STATE
- City
- — inherits STATE
ZIP-level market 46320
- Home prices YoY
- 5.0%
- Rents YoY
- 7.6%
- Active inventory
- 51
- Price-to-rent
- 11.7×
Monthly cashflow live
- Estimated rent
- $1,428 high interval (Pro) →
- Mortgage (P&I)
- −$1,049
- Tax from tax record
- −$116 /mo · $1,395/yr
- Insurance
- −$83
- HOA
- −$0
- Vacancy / Maint / Mgmt
- −$300
- Net cashflow
- $-120
Break-even live
Sensitivity live
| Price | -10% $-7 | -5% $-64 | +0% $-120 | +5% $-177 | +10% $-233 |
|---|---|---|---|---|---|
| Rent | -10% $-233 | -5% $-177 | +0% $-120 | +5% $-64 | +10% $-7 |
| Rate | -1.0pp $-20 | -0.5pp $-69 | base $-120 | +0.5pp $-172 | +1.0pp $-225 |
UW: 25.0% down · 7.5% · 30yr · 1.5% tax · 5.0% vac · 8.0% maint · 8.0% mgmt
Financing live
Cash to close
- Down payment
- $49,997
- Closing costs
- $6,000
- Reserves months
- —
- Total cash needed
- —
Loan-product check · same deal, 3 products live
Conventional
25% down · 7.5% · 30yr
- Down + closing
- —
- Monthly P&I
- —
- Monthly cashflow
- —
- DSCR
- —
- Eligible?
- —
Personal DTI + credit; lowest rate.
DSCR
20% down · 8.5% · 30yr
- Down + closing
- —
- Monthly P&I
- —
- Monthly cashflow
- —
- DSCR
- —
- Eligible?
- —
No personal income docs; deal must DSCR.
Hard money
10% down · 12.0% · 12mo
- Down + closing
- —
- Monthly P&I
- —
- Monthly cashflow
- —
- DSCR
- —
- Eligible?
- —
Short-term bridge; refi at stabilization.
Rent comps 11 comps
| Address | Beds | Baths | Sqft | Rent | $/sqft | DOM | Units | Dist |
|---|---|---|---|---|---|---|---|---|
| 1227 Logan St Hammond, IN | 2.0 | 1.0 | 768 | $1,350 | $1.76 | 12d | 1 | 0.25mi |
| 1227 Logan St Hammond, IN | 2.0 | 1.0 | 768 | $1,350 | $1.76 | 17d | 1 | 0.25mi |
| 1344 Michigan St Hammond, IN | 3.0 | 1.0 | 1006 | $1,595 | $1.59 | 17d | 1 | 0.32mi |
| 1454 Sherman St Hammond, IN | 3.0 | 1.0 | 960 | $1,400 | $1.46 | 5d | 1 | 0.85mi |
| 4724 Pine Ave Unit 4726 Hammond, IN | 2.0 | 1.0 | 650 | $1,000 | $1.54 | 7d | 1 | 0.86mi |
| 6138 Ray Ave Hammond, IN | 3.0 | 1.0 | 1120 | $1,395 | $1.25 | 1d | 1 | 0.94mi |
| 3 Ruth St Hammond, IN | 2.0 | 1.0 | 900 | $1,250 | $1.39 | 26d | 1 | 1.34mi |
| 5 Ruth St Unit 2W Hammond, IN | 2.0 | 1.0 | 900 | $1,250 | $1.39 | 14d | 1 | 1.35mi |
| 115 157th St Unit 3 Calumet City, IL | 3.0 | 1.0 | 800 | $1,350 | $1.69 | 26d | 1 | 1.41mi |
| 407 Kenwood St Hammond, IN | 2.0 | 1.0 | 920 | $1,495 | $1.62 | 26d | 1 | 1.41mi |
| 407 Kenwood St Hammond, IN | 2.0 | 1.0 | 920 | $1,495 | $1.62 | 18d | 1 | 1.41mi |
Listing history 19 events
-
2026-05-04status Pending
-
2026-04-21price $199,988
-
2026-04-20price $199,989
-
2026-04-17price $199,990
-
2026-04-15price $199,991
-
2026-04-11price $199,992
-
2026-04-10price $199,993
-
2026-04-08price $199,994
-
2026-04-06price $199,995
-
2026-04-03price $199,996
-
2026-04-02price $199,997
-
2026-04-01price $199,998
-
2026-03-31price $199,999
-
2026-02-13$200,000 Active
-
2022-07-22soldstatus $165,000 Closed 437-char remark
Show marketing remark (437 chars)
Just Like Brand New! What a great Package. Move in and Enjoy. The House is an extensive remodel. New Kitchen and Full Bath. Very good quality Materials. Granite, Ceramic / Glass Tiles. Stainless Steel Appliances. All New Plumbing Water lines and Fixtures. . Brand New Architectural Shingled Roof. New Windows, New Doors, New Electrical, New Plumbing, New Recess and Modern Lighting, New Furnace and A/C. Full Basement and a Fenced Yard.
-
2022-06-08historical Active Under Contract 437-char remark
Show marketing remark (437 chars)
Just Like Brand New! What a great Package. Move in and Enjoy. The House is an extensive remodel. New Kitchen and Full Bath. Very good quality Materials. Granite, Ceramic / Glass Tiles. Stainless Steel Appliances. All New Plumbing Water lines and Fixtures. . Brand New Architectural Shingled Roof. New Windows, New Doors, New Electrical, New Plumbing, New Recess and Modern Lighting, New Furnace and A/C. Full Basement and a Fenced Yard.
-
2022-06-03$160,000 Active 437-char remark
Show marketing remark (437 chars)
Just Like Brand New! What a great Package. Move in and Enjoy. The House is an extensive remodel. New Kitchen and Full Bath. Very good quality Materials. Granite, Ceramic / Glass Tiles. Stainless Steel Appliances. All New Plumbing Water lines and Fixtures. . Brand New Architectural Shingled Roof. New Windows, New Doors, New Electrical, New Plumbing, New Recess and Modern Lighting, New Furnace and A/C. Full Basement and a Fenced Yard.
-
2021-02-19soldstatus $45,000 343-char remark
Show marketing remark (343 chars)
3- Bedroom Ranch Home with basement on the North Side of Hammond waiting for the next home owner to purchase and make this there new home to live and rasie there kids, schools near by and train station, if you know this area drive by it and you will see what is there. House does need repairs. Sold As Is Condition. Make your Appointment soon.
-
2021-01-05$47,500 343-char remark
Show marketing remark (343 chars)
3- Bedroom Ranch Home with basement on the North Side of Hammond waiting for the next home owner to purchase and make this there new home to live and rasie there kids, schools near by and train station, if you know this area drive by it and you will see what is there. House does need repairs. Sold As Is Condition. Make your Appointment soon.
ⓘ Source: listings_history table (triggers on properties + properties_extension) + one-shot
backfill from property_details.listing_events for pre-trigger history.
Tax reassessment forecast IN · Partial reset (capped growth)
- Current annual tax
- $1,395 · $116/mo
- Projected year-2 tax
- $1,548 · $129/mo
- Expected delta
- +$152/yr (+$13/mo · 10.9%)
ⓘ Screening estimate from a state-policy table — verify with the county assessor before closing.
Climate risk First Street
- Flood 4/10 Moderate FEMA zone X (unshaded) · 21% chance over 30 yrs
- Wildfire 1/10 Low
- Heat 3/10 Moderate 7 d/yr ≥101°F today · 15 d/yr by 30 yrs out
- Wind 2/10 Low 0% chance of damaging wind over 30 yrs
- Air quality 4/10 Moderate 5 unhealthy d/yr today · 6 by 30 yrs out
Nearby sold comps map
Loading sold comps map…
Walkable amenities ~0.75 mi
Loading nearby amenities…
Taxation est. · year 1
- Rental income
- $17,136
- − Mortgage interest
- −$11,202
- − Property taxes
- −$1,395
- − Insurance
- −$1,000
- − Repairs & maintenance
- −$1,371
- − Management
- −$1,371
- − Depreciation
- −$5,818
- Taxable loss
- −$5,022
- Est. tax savings @ 24.0%
- +$1,205
- After-tax cash flow
- $-238/yr
For passive investors: Depreciation is non-cash, so a rental often shows a tax loss while cash-flowing — sheltering income. Rental losses are passive: they offset passive income freely, and up to $25,000/yr can offset ordinary (W-2) income if you actively participate and your MAGI is under $100k (phasing out to $0 by $150k); unused losses carry forward. On sale, claimed depreciation is recaptured at up to 25%, and gains may owe capital-gains tax (a 1031 exchange can defer both). Figures are a year-1 estimate at your 24.0% rate — not tax advice; consult a CPA.
Schools (NCES district)
- District
- School City Of Hammond
- NCES district ID
- 1804320
- Math proficiency
- 8% ▼ -18.00%
- Reading proficiency
- 18% ▼ -15.00%
- Median HH income
- $39,970
- Composite
- 11.11/100
- National rank
- #9730
- State rank
- #289 of 301 in IN
Livability — Hammond
- Score
- 70/100
- State rank
- #143
- US rank
- #7343
Category grades
Schools grade is shown separately in the Schools card above.
Census & demographics
- Census place
- Hammond, IN
- County
- Lake County · 422,878 people
- City population
- 58,809
- Metro
- Chicago-Naperville-Elgin, IL-IN-WI
- Population (ZIP)
- 14,353
- Household income
- $37,158
- Rent vs Own
- Severe rent burden
- 900.0
Population outlook (Lake County) Hauer SSP2
- Today (2025)
- 484,026 people
- By 2030
- 478,091 · -1.2%
- By 2040
- 462,974 · -4.3%
- By 2050
- 449,894 · -7.1%
- By 2075
- 436,169 · -9.9%
- By 2100
- 426,607 · -11.9%
Race, ethnicity, and origin ACS 2023
- Neighborhood character
- Diverse neighborhood (Simpson 0.64)
- Race & ethnicity
- Black 44% Hispanic / Latino 39% White 14% Two or more races 12% Asian 1%
- Hispanic origin (detail)
- Mexican 31% Puerto Rican 4%
- Common ancestry
- Romanian 2% Lithuanian 1%
- Foreign-born
- 14% · Canada
- Languages at home
- 68% English-only · Spanish 31%
Political lean MEDSL · Lake
- 2024 margin
- Lean D (+5.6) · D 52.1% · R 46.5% · Other 1.5%
- 2008→2024 swing
- -28.6pp toward R · 2008: 34.3pp · 2024: 5.6pp
- All cycles
- 2024: D+5.6 2020: D+15.1 2016: D+20.6 2012: D+31.0 2008: D+34.3
Not yet ingested
- Civics
- —
Market trends
- HPI YoY
- ▲ 13.81%
- Current HPI
- 288.1513
- Rent YoY
- ▲ 7.61%
- Metro
- Chicago-Naperville-Elgin, IL-IN-WI
- State GDP YoY
- ▲ 2.90%
- F500 in state
- 18
Industry mix (Fortune 500 HQ in IN)
| Industry | F500 HQs | Revenue |
|---|---|---|
| Industrial Machinery | 2 | $37B |
|
||
| Healthcare | 1 | $177B |
|
||
| Pharmaceuticals | 1 | $45B |
|
||
| Metals / Steel | 1 | $18B |
|
||
| Agriculture | 1 | $17B |
|
||
| Packaging | 1 | $12B |
|
||
Price history
+321.0% since first listed19 events — show timeline
- 2026-05-04 Pending — NIRA MLS as Distributed by MLS Grid
- 2026-04-21 Price Changed $199,988 NIRA MLS as Distributed by MLS Grid
- 2026-04-20 Price Changed $199,989 NIRA MLS as Distributed by MLS Grid
- 2026-04-17 Price Changed $199,990 NIRA MLS as Distributed by MLS Grid
- 2026-04-15 Price Changed $199,991 NIRA MLS as Distributed by MLS Grid
- 2026-04-11 Price Changed $199,992 NIRA MLS as Distributed by MLS Grid
- 2026-04-10 Price Changed $199,993 NIRA MLS as Distributed by MLS Grid
- 2026-04-08 Price Changed $199,994 NIRA MLS as Distributed by MLS Grid
- 2026-04-06 Price Changed $199,995 NIRA MLS as Distributed by MLS Grid
- 2026-04-03 Price Changed $199,996 NIRA MLS as Distributed by MLS Grid
- 2026-04-02 Price Changed $199,997 NIRA MLS as Distributed by MLS Grid
- 2026-04-01 Price Changed $199,998 NIRA MLS as Distributed by MLS Grid
- 2026-03-31 Price Changed $199,999 NIRA MLS as Distributed by MLS Grid
- 2026-02-13 Listed $200,000 NIRA MLS as Distributed by MLS Grid
- 2022-07-22 Sold (MLS) $165,000 NIRA MLS as Distributed by MLS Grid
- 2022-06-08 Contingent — NIRA MLS as Distributed by MLS Grid
- 2022-06-03 Listed $160,000 NIRA MLS as Distributed by MLS Grid
- 2021-02-19 Sold (MLS) $45,000 NIRA MLS as Distributed by MLS Grid
- 2021-01-05 Listed $47,500 NIRA MLS as Distributed by MLS Grid
Property tax history
-2.7%/yrLatest (2024): $1,395 · -6.1% YoY. Source: county tax records.
Cash-flow waterfall
monthlySold comps — $/sqft
last 12 mo · ≤1 miLoading sold comps…