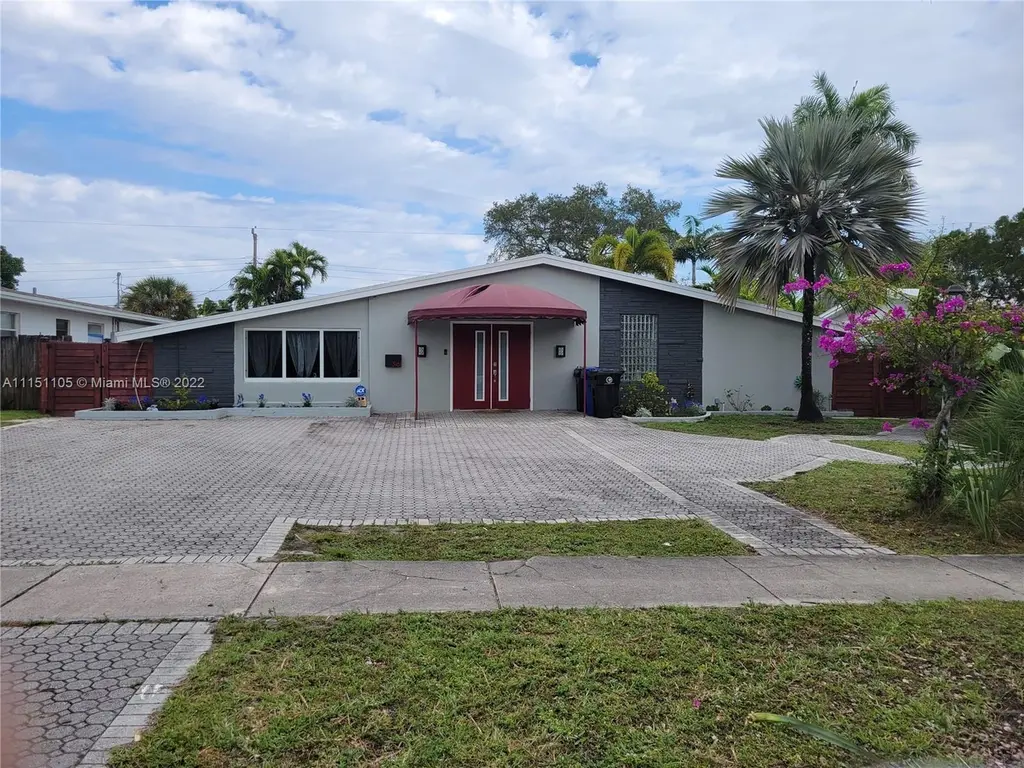
3161 Riverland Rd · Fort Lauderdale, FL
Flood risk 1/10 · Minimal
- FEMA flood zone
- X (unshaded)
- Chance of flooding over 30 yrs
- 0.0%
- Est. flood insurance / yr
- $507 – $1,088
Fire risk 1/10 · Minimal
- Est. fire insurance / yr
- $947 – $1,759
Heat risk 10/10 · Severe
- Hot days now (above 105°F)
- 7 days/yr
- Hot days in 30 yrs
- 27 days/yr
Wind risk 10/10 · Severe
- Chance of severe wind over 30 yrs
- 99.0%
Air-quality risk 2/10 · Minimal
- Unhealthy air days now
- 2 days/yr
- Unhealthy air days in 30 yrs
- 2 days/yr
Risk factors via First Street. Map © Google.
Why this score? — see what drove the D grade
The composite is a weighted blend of 9 inputs, each scored 0–100. Each bar is that input's sub-score; the figure is the points it added to the 100-point composite (weight × sub-score).
- Cash flow +12.4/30.0
- ARV discount +8.7/15.0
- Schools +4.1/10.0
- Livability +4.1/5.0
- 1% rule +3.8/10.0
- DSCR +3.7/10.0
- Rent growth +2.8/5.0
- Condition / age +2.5/5.0
- Appreciation +0.0/10.0
$644,999
🖨 Deal sheet 📄 Offer letter ✓ Due diligence
Listing remarks
Beautifully maintained home in the heart of Riverland offering incredible potential for both end-users and investors alike. This property features a spacious layout with abundant natural light, a large backyard with a pool, and no HOA restrictions. Centrally located just minutes from major highways, shopping, dining, and Fort Lauderdale beaches. Whether you’re looking to move right in or customize to your taste, this home presents a rare opportunity in a rapidly growing area. Priced to sell — schedule your private showing today before it’s gone.
Key facts
- Large backyard
- Centrally located
- No hoa restrictions
Tags
Property features AI
Exterior
- Parking: Driveway; Paver block parking
- Utilities: Public water; Public sewer
- Home design: Single-story home; Updated/remodeled; Effective year built
- Construction: Block construction; Shingle roof; Built (effective year)
- Exterior features: In-ground pool; Pool; South-facing
Interior
- Bedrooms: Bedroom on main level
- Flooring: Ceramic tile
- Bathrooms: 2 full bathrooms
- Heating & cooling: Central heating; Central air conditioning
- Interior features: First-floor entry; Bedroom on the main level; Ceramic tile flooring
- Laundry & utility: Laundry room; Utility room
Neighborhood map
What this means for you Summary
Snapshot
- This is a 4-bed/2.0-bath single-family listed at $645k.
Deal economics
- At list price, monthly cash flow is $-101 ($-1k/yr) — negative.
- To cash-flow at today's rent, offer at most $627k (2.8% below list).
- To meet the 1% rule (rent ≥ 1% of price), the offer needs to be $569k (11.8% below list).
- Recommended offer: $569k (11.8% below list) — sets the bar for 1% rule.
- Cap rate 6.1% vs local median 2.2% in Fort Lauderdale — top-decile yield for the area; either an underpriced asset or a hidden risk that comps aren't pricing in. Stress-test before assuming the spread holds.
Location & tenants
- Location reads 82/100 on livability (#78 in FL, #1,293 nationally) — a professional / high-income tenant draw. Strengths: crime A+, amenities A+, health & safety A+; Watch: cost of living D-.
- Broward (suburban): math 42% / reading 53% proficiency, ranked #46 of 73 in FL (top 63%) — families likely to look elsewhere, expect single-tenant / working-renter base with shorter leases.
- Market conditions: Rents rising (+1.3%/yr); 412 active listings in the ZIP; 38 comparable units currently listed for rent nearby; rentals at typical pace (median 15d on market — plan ~3-4 weeks tenant-placement turnaround); solid renter incomes; 2,111 units permitted in Broward County in 2024 (1,265 in 5+ unit buildings).
- At $5,687/mo this rent would consume 90% of the median local household income ($76k/yr) (locally 1903% of renters already pay >50% of income on rent) — very limited rent-growth headroom before tenants either downsize or default.
Forward outlook
- Local home prices are declining (-3.0%/yr); year-one equity from $4k of loan paydown is wiped out by about $19k of value loss. Plan a longer hold.
- Broward County population projected at +34% by 2050 — long-run rental-demand tailwind backs the buy-and-hold thesis.
Negotiation context
- It's been on market 62 days — a 6% lower offer ($606k) is reasonable based on typical stale-listing flexibility.
- 5 sale attempts since 8y ago with the ask held roughly flat each time — persistent listings suggest the price (not the market) is what's stuck; bring a comps-based counter.
- Current owner paid $525k; 23% above their basis — modest negotiation headroom, anchor on the comps not their cost.
Risks & watch-outs
- Climate carrying-cost: severe wind risk, 99% chance of damaging wind over 30y; extreme-heat days projected 7→27/yr by 2055 (HVAC capex compounding) — expect insurance premiums to compound above CPI over the hold.
Questions for the listing agent
- What do current leases actually rent for vs. the listed asking? Can we see a recent rent roll and the last 12 months of T-12 income?
- It's been on market 62 days. Have you received any prior offers? Is the seller open to a 12% concession, seller financing, or rate buy-down credit?
- Built in 1960 — when were the roof, HVAC, electrical panel, plumbing, and water heater last replaced?
- Why hasn't it sold? Are there any deal-killer items the seller is aware of (foundation, flood, title, zoning, code violations)?
- Is there a deadline driving the sale (1031 exchange, divorce, estate, relocation)? That informs how much negotiation room exists.
- Schools are B-rated — typically a magnet for longer-tenancy family renters. What's the average tenant stay here, and is there a school-zone premium baked into asking?
- The area grade is low — what's the realistic commute time and amenity access for the typical tenant pool here? Any planned neighborhood developments (good or bad) we should know about?
- What's the average days-on-market for RENTAL listings here right now (not sales)? A rising rental-DOM trend means longer vacancies and softer asking-rent achievability than the comps imply.
- What's the recent tenant-quality profile in this submarket — average credit score on applications, eviction rate, late-payment / NSF rate, and stable-employment percentage? A property-management company in the area should have these aggregated.
- How much new for-sale + rental construction is in the pipeline within 1–3 miles? Heavy new supply typically softens prices + rents 12–24 months out; constrained supply supports both.
Investment metrics
- 1% rule
- 0.88% ✗
- Cap rate
- 6.10%
- Cash-on-cash
- -0.67%
- DSCR
- 0.97
- GRM
- 9.5
CMA / ARV
- ARV (on-the-fly)
- $662,934
- Comps found
- 7
Show comp detail 7 sales within ~0.75 mi
| Address | Dist | Beds/Ba | Sqft | Sold | Price | $/sf | Match |
|---|---|---|---|---|---|---|---|
| 3021 SW 23rd St | 0.23mi | 4/3.0 | 2,198 (+4%) | 4mo | $741,000 | $337 | 76 |
| 2091 SW 29th Ave | 0.36mi | 3/2.0 (-1) | 1,998 (-6%) | 23mo | $625,000 | $313 | 50 |
| 3161 SW 20th St | 0.35mi | 3/2.0 (-1) | 1,970 (-7%) | 24mo | $499,500 | $254 | 47 |
| 2637 Sugarloaf Ln | 0.74mi | 4/3.0 | 2,292 (+8%) | 1mo | $1,900,000 | $829 | 47 |
| 3451 SW 19th St | 0.49mi | 4/3.0 | 2,400 (+13%) | 10mo | $730,000 | $304 | 42 |
| 2637 Flamingo Ln | 0.44mi | 3/2.0 (-1) | 1,816 (-14%) | 12mo | $899,000 | $495 | 41 |
| 1496 SW 30th Ter | 0.70mi | 4/2.0 | 1,885 (-11%) | 11mo | $489,900 | $260 | 40 |
Match score weights: distance 35% · size 25% · config 20% · recency 20%. Top-matched comps best support the ARV.
Projected returns pro-forma
-3.0% appreciation · 1.3% rent growth · sell at horizon
- IRR
- -19.4%
- Equity multiple
- 0.33×
- Total profit
- $-120,353
- Equity at exit
- $96,171
- IRR
- -16.1%
- Equity multiple
- 0.17×
- Total profit
- $-150,337
- Equity at exit
- $55,768
Cash invested: $180,600 (down + closing). Projections, not guarantees.
Landlord ↔ Tenant lean methodology
- Overall (STATE)
- 87 Strongly Landlord-Friendly
- State Florida
- 87 Strongly Landlord-Friendly · R+3
- County
- — inherits STATE
- City
- — inherits STATE
ZIP-level market 33312
- Rents YoY
- 1.3%
- Active inventory
- 412
- Price-to-rent
- 9.5×
Monthly cashflow live
- Estimated rent
- $5,687 high interval (Pro) →
- Mortgage (P&I)
- −$3,382
- Tax from tax record
- −$943 /mo · $11,313/yr
- Insurance
- −$269
- HOA
- −$0
- Vacancy / Maint / Mgmt
- −$1,194
- Net cashflow
- $-101
Break-even live
UW: 25.0% down · 7.5% · 30yr · 1.5% tax · 5.0% vac · 8.0% maint · 8.0% mgmt
Financing live
Cash to close
- Down payment
- $161,250
- Closing costs
- $19,350
- Reserves months
- —
- Total cash needed
- —
Loan-product check · same deal, 3 products live
Conventional
25% down · 7.5% · 30yr
- Down + closing
- —
- Monthly P&I
- —
- Monthly cashflow
- —
- DSCR
- —
- Eligible?
- —
Personal DTI + credit; lowest rate.
DSCR
20% down · 8.5% · 30yr
- Down + closing
- —
- Monthly P&I
- —
- Monthly cashflow
- —
- DSCR
- —
- Eligible?
- —
No personal income docs; deal must DSCR.
Hard money
10% down · 12.0% · 12mo
- Down + closing
- —
- Monthly P&I
- —
- Monthly cashflow
- —
- DSCR
- —
- Eligible?
- —
Short-term bridge; refi at stabilization.
Rent comps 38 comps
| Address | Beds | Baths | Sqft | Rent | $/sqft | DOM | Units | Dist |
|---|---|---|---|---|---|---|---|---|
| 3160 SW 20th Ct Fort Lauderdale, FL | 4.0 | 3.0 | 1405 | $5,500 | $3.91 | 7d | 1 | 0.30mi |
| 2518 Gulfstream Ln Fort Lauderdale, FL | 3.0 | 2.0 | 1550 | $4,800 | $3.10 | 4d | 1 | 0.37mi |
| 2518 Gulfstream Ln Fort Lauderdale, FL | 3.0 | 2.0 | 1550 | $4,800 | $3.10 | 24d | 1 | 0.37mi |
| 2120 SW 28th Way Fort Lauderdale, FL | 5.0 | 3.0 | 2778 | $14,500 | $5.22 | 5d | 1 | 0.43mi |
| 2100 SW 28th Way Fort Lauderdale, FL | 5.0 | 4.0 | 2145 | $7,495 | $3.49 | 5d | 1 | 0.45mi |
| 3340 SW 18th St Fort Lauderdale, FL | 4.0 | 2.0 | 1875 | $3,550 | $1.89 | 24d | 1 | 0.47mi |
| 1930 SW 36th Ave Fort Lauderdale, FL | 5.0 | 2.5 | 2188 | $8,295 | $3.79 | 5d | 1 | 0.55mi |
| 1930 SW 36th Ave Fort Lauderdale, FL | 5.0 | 2.5 | 2188 | $8,495 | $3.88 | 14d | 1 | 0.55mi |
| 2407 Nassau Ln Fort Lauderdale, FL | 3.0 | 2.0 | 1495 | $5,000 | $3.34 | 4d | 1 | 0.55mi |
| 2407 Nassau Ln Fort Lauderdale, FL | 3.0 | 2.0 | 1495 | $5,000 | $3.34 | 24d | 1 | 0.55mi |
| 1773 SW 28th Way Fort Lauderdale, FL | 3.0 | 2.0 | 1430 | $4,350 | $3.04 | 24d | 1 | 0.59mi |
| 1754 SW 28th Ter Fort Lauderdale, FL | 3.0 | 2.0 | 1432 | $6,750 | $4.71 | 7d | 1 | 0.66mi |
| 3138 SW 15th St Fort Lauderdale, FL | 3.0 | 2.0 | 1456 | $9,000 | $6.18 | 24d | 1 | 0.70mi |
| 3138 SW 15th St Fort Lauderdale, FL | 3.0 | 2.0 | 1456 | $9,000 | $6.18 | 7d | 1 | 0.70mi |
| 2637 Sugarloaf Ln Fort Lauderdale, FL | 4.0 | 3.0 | 2326 | $8,000 | $3.44 | 16d | 1 | 0.75mi |
| 2637 Sugarloaf Ln Fort Lauderdale, FL | 4.0 | 3.0 | 2292 | $8,000 | $3.49 | 4d | 1 | 0.75mi |
| 2637 Sugarloaf Ln Unit 2637 Fort Lauderdale, FL | 4.0 | 3.0 | 2326 | $8,000 | $3.44 | 14d | 1 | 0.75mi |
| 2613 Tortugas Ln Fort Lauderdale, FL | 3.0 | 3.0 | 1892 | $9,500 | $5.02 | 24d | 1 | 0.79mi |
| 3711 W State Road 84 Davie, FL | 1.0–3.0 | 1.0–2.0 | 1261 | $3,111 | $2.47 | 1d | 14 | 0.82mi |
| 1300 SW 34th Ave Unit n/a Fort Lauderdale, FL | 3.0 | 2.0 | 1634 | $3,500 | $2.14 | 24d | 1 | 0.89mi |
| 3120 SW 12th Pl Fort Lauderdale, FL | 3.0 | 2.0 | 1532 | $2,950 | $1.93 | 24d | 1 | 0.96mi |
| 3421 SW 12th Ct Unit A Fort Lauderdale, FL | 3.0 | 1.0 | 1691 | $2,849 | $1.68 | 24d | 1 | 1.05mi |
| 3421 SW 12th Ct Unit A Fort Lauderdale, FL | 3.0 | 1.0 | 1691 | $2,849 | $1.68 | 5d | 1 | 1.05mi |
| 3421 SW 12th Ct Fort Lauderdale, FL | 3.0 | 1.0 | 1500 | $2,850 | $1.90 | 18d | 1 | 1.05mi |
| 2600 Marina Bay Dr E Fort Lauderdale, FL | 1.0–3.0 | 1.5–2.0 | 1099 | $3,160 | $2.88 | 1d | 16 | 1.07mi |
| 2160 SW 16th Ct Fort Lauderdale, FL | 3.0 | 2.0 | 1850 | $3,900 | $2.11 | 24d | 1 | 1.15mi |
| 1837 Gardenia Rd Plantation, FL | 3.0 | 2.0 | 1635 | $3,000 | $1.83 | 2d | 1 | 1.16mi |
| 1870 SW 42nd Ter Fort Lauderdale, FL | 3.0 | 2.0 | 1460 | $3,400 | $2.33 | 7d | 1 | 1.23mi |
| 2280 SW 43rd Ave Unit 1 Fort Lauderdale, FL | 4.0 | 2.0 | 2105 | $3,600 | $1.71 | 24d | 1 | 1.24mi |
| 950 E Dayton Cir Fort Lauderdale, FL | 3.0 | 2.0 | 1521 | $2,699 | $1.77 | 15d | 1 | 1.30mi |
| 2320 SW 18th Ter #1 Fort Lauderdale, FL | 3.0 | 2.0 | 2598 | $2,700 | $1.04 | 12d | 1 | 1.36mi |
| 2320 SW 18th Ter #1 Fort Lauderdale, FL | 3.0 | 2.0 | 2598 | $2,600 | $1.00 | 4d | 1 | 1.36mi |
| 836 Pennsylvania Ave Fort Lauderdale, FL | 5.0 | 3.0 | 1837 | $3,300 | $1.80 | 24d | 1 | 1.39mi |
| 1721 SW 23rd St Unit 1475645P Fort Lauderdale, FL | 5.0 | 3.5 | 2863 | $9,358 | $3.27 | 22d | 1 | 1.45mi |
| 1759 SW 30th Pl Fort Lauderdale, FL | 5.0 | 3.0 | 2127 | $11,595 | $5.45 | 14d | 1 | 1.47mi |
| 610 Carolina Ave Unit 2 Fort Lauderdale, FL | 4.0 | 3.0 | 1865 | $2,000 | $1.07 | 14d | 1 | 1.48mi |
| 630 SW 28th Dr Fort Lauderdale, FL | 3.0 | 2.0 | 1467 | $3,300 | $2.25 | 24d | 1 | 1.48mi |
| 1110 SW 42nd Ave Plantation, FL | 3.0 | 2.0 | 1650 | $3,200 | $1.94 | 24d | 1 | 1.48mi |
Listing history 18 events
-
2026-05-04price $644,999
-
2026-04-30price $649,000
-
2026-03-25$650,000 Active
-
2023-04-26historical
-
2023-03-15price $789,000
-
2023-02-27$799,000 Active
-
2023-02-01historical
-
2022-11-29$849,950 Active
-
2022-03-17soldstatus $525,000 Closed
-
2022-01-29status Pending
-
2022-01-24$524,900 Active
-
2018-12-04soldstatus $335,000
-
2018-11-29soldstatus $335,000 Sold
-
2018-10-12status Pending
-
2018-09-12$349,000 Active
-
2005-08-09soldstatus $379,000
-
1994-03-24soldstatus $116,500
-
1978-03-01soldstatus $40,000
ⓘ Source: listings_history table (triggers on properties + properties_extension) + one-shot
backfill from property_details.listing_events for pre-trigger history.
Tax reassessment forecast FL · Resets to sale price
- Current annual tax
- $11,313 · $943/mo
- Projected year-2 tax
- $11,313 · $943/mo
- Expected delta
- $0/yr ($0/mo · 0.0%)
ⓘ Screening estimate from a state-policy table — verify with the county assessor before closing.
Climate risk First Street
- Flood 1/10 Low FEMA zone X (unshaded) · 0% chance over 30 yrs
- Wildfire 1/10 Low
- Heat 10/10 Extreme 7 d/yr ≥105°F today · 27 d/yr by 30 yrs out
- Wind 10/10 Extreme 99% chance of damaging wind over 30 yrs
- Air quality 2/10 Low 2 unhealthy d/yr today · 2 by 30 yrs out
Nearby sold comps map
Loading sold comps map…
Walkable amenities ~0.75 mi
Loading nearby amenities…
Taxation est. · year 1
- Rental income
- $68,246
- − Mortgage interest
- −$36,130
- − Property taxes
- −$11,313
- − Insurance
- −$3,225
- − Repairs & maintenance
- −$5,460
- − Management
- −$5,460
- − Depreciation
- −$18,764
- Taxable loss
- −$12,105
- Est. tax savings @ 24.0%
- +$2,905
- After-tax cash flow
- $1,692/yr
For passive investors: Depreciation is non-cash, so a rental often shows a tax loss while cash-flowing — sheltering income. Rental losses are passive: they offset passive income freely, and up to $25,000/yr can offset ordinary (W-2) income if you actively participate and your MAGI is under $100k (phasing out to $0 by $150k); unused losses carry forward. On sale, claimed depreciation is recaptured at up to 25%, and gains may owe capital-gains tax (a 1031 exchange can defer both). Figures are a year-1 estimate at your 24.0% rate — not tax advice; consult a CPA.
Schools (NCES district)
- District
- Broward
- NCES district ID
- 1200180
- Math proficiency
- 42% ▼ -18.00%
- Reading proficiency
- 53% ▼ -5.00%
- Median HH income
- $52,139
- Composite
- 40.88/100
- National rank
- #3621
- State rank
- #46 of 73 in FL
Livability — Fort Lauderdale
- Score
- 82/100
- State rank
- #78
- US rank
- #1293
Category grades
Schools grade is shown separately in the Schools card above.
Census & demographics
- Census place
- Fort Lauderdale, FL
- County
- Broward County · 1,963,430 people
- City population
- 235,769
- Metro
- Miami-Fort Lauderdale-Pompano Beach, FL
- Population (ZIP)
- 52,798
- Household income
- $75,952
- Rent vs Own
- Severe rent burden
- 1903.0
Population outlook (Broward County) Hauer SSP2
- Today (2025)
- 2,207,033 people
- By 2030
- 2,360,704 · +7.0%
- By 2040
- 2,661,208 · +20.6%
- By 2050
- 2,946,698 · +33.5%
- By 2075
- 3,602,273 · +63.2%
- By 2100
- 3,970,984 · +79.9%
Race, ethnicity, and origin ACS 2023
- Neighborhood character
- Highly diverse neighborhood (Simpson 0.70)
- Race & ethnicity
- White 34% Hispanic / Latino 32% Black 29% Two or more races 20% Asian 2%
- Hispanic origin (detail)
- Mexican 2% Puerto Rican 5% Cuban 6% Salvadoran 1%
- Common ancestry
- Hispanic 6% Romanian 3% Italian 1%
- Foreign-born
- 33% · Canada, Jamaica, Dominican Republic
- Languages at home
- 59% English-only · Spanish 29% French/Haitian/Cajun 7% Other Indo-European 2%
Political lean MEDSL · Broward
- 2024 margin
- D (+17.0) · D 58.0% · R 41.0%
- 2008→2024 swing
- -17.8pp toward R · 2008: 34.7pp · 2024: 17.0pp
- All cycles
- 2024: D+17.0 2020: D+29.8 2016: D+35.0 2012: D+34.9 2008: D+34.7
Not yet ingested
- Civics
- —
Market trends
- HPI YoY
- ▼ -323.99%
- Current HPI
- 382.6298
- Rent YoY
- ▲ 1.30%
- Metro
- Miami-Fort Lauderdale-Pompano Beach, FL
- State GDP YoY
- ▲ 3.28%
- F500 in state
- 36
Industry mix (Fortune 500 HQ in FL)
| Industry | F500 HQs | Revenue |
|---|---|---|
| Industrial Technology | 2 | $29B |
|
||
| Insurance | 2 | $17B |
|
||
| Retail | 1 | $60B |
|
||
| Technology Distribution | 1 | $58B |
|
||
| Homebuilding | 1 | $35B |
|
||
| Technology Manufacturing | 1 | $35B |
|
||
Price history
+1512.5% since first listed18 events — show timeline
- 2026-05-04 Price Changed $644,999 MARMLS
- 2026-04-30 Price Changed $649,000 MARMLS
- 2026-03-25 Listed $650,000 MARMLS
- 2023-04-26 Listing Removed — Beaches MLS
- 2023-03-15 Price Changed $789,000 Beaches MLS
- 2023-02-27 Listed $799,000 Beaches MLS
- 2023-02-01 Listing Removed — Beaches MLS
- 2022-11-29 Listed $849,950 Beaches MLS
- 2022-03-17 Sold (MLS) $525,000 MARMLS
- 2022-01-29 Pending — MARMLS
- 2022-01-24 Listed $524,900 MARMLS
- 2018-12-04 Sold (Public Records) $335,000 Public Records
- 2018-11-29 Sold (MLS) $335,000 MARMLS
- 2018-10-12 Pending — MARMLS
- 2018-09-12 Listed $349,000 MARMLS
- 2005-08-09 Sold (Public Records) $379,000 Public Records
- 1994-03-24 Sold (Public Records) $116,500 Public Records
- 1978-03-01 Sold (Public Records) $40,000 Public Records
Property tax history
+12.5%/yrLatest (2025): $11,313 · +5.7% YoY. Source: county tax records.
Cash-flow waterfall
monthlySold comps — $/sqft
last 12 mo · ≤1 miLoading sold comps…