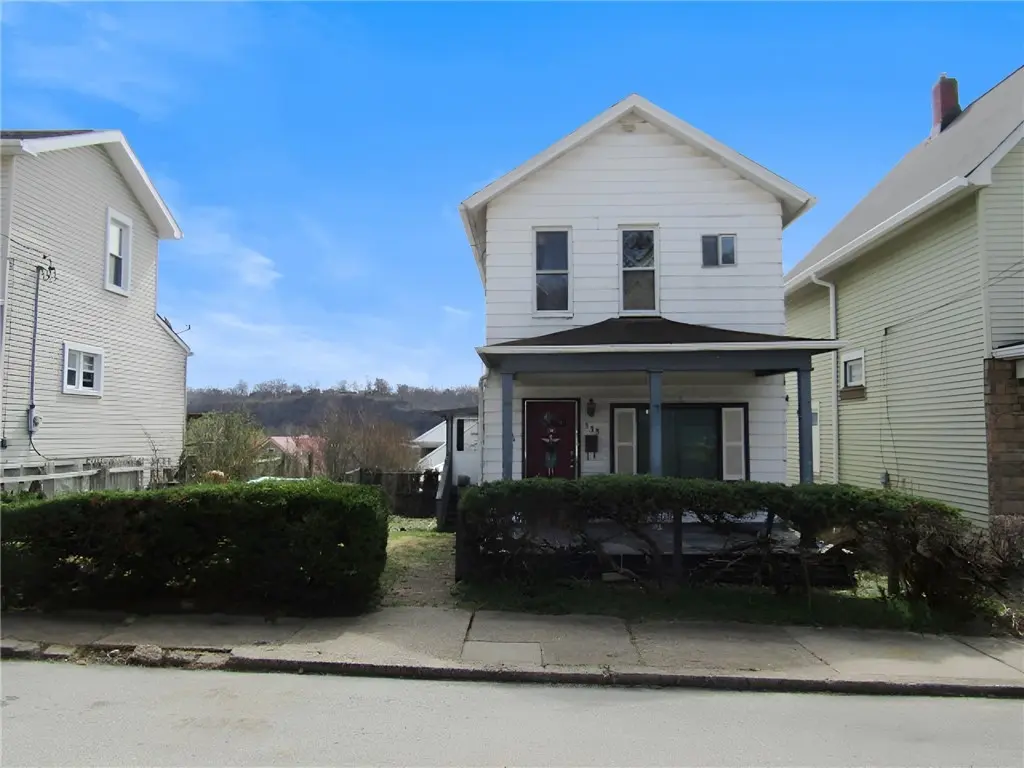
333 W 8th Ave · Tarentum, PA
Flood risk 1/10 · Minimal
- FEMA flood zone
- X (unshaded)
- Chance of flooding over 30 yrs
- 0.0%
- Est. flood insurance / yr
- $473 – $860
Fire risk 1/10 · Minimal
- Est. fire insurance / yr
- $511 – $949
Heat risk 5/10 · Moderate
- Hot days now (above 97°F)
- 8 days/yr
- Hot days in 30 yrs
- 20 days/yr
Wind risk 2/10 · Minimal
- Chance of severe wind over 30 yrs
- —
Air-quality risk 4/10 · Minor
- Unhealthy air days now
- 5 days/yr
- Unhealthy air days in 30 yrs
- 6 days/yr
Risk factors via First Street. Map © Google.
Why this score? — see what drove the B grade
The composite is a weighted blend of 9 inputs, each scored 0–100. Each bar is that input's sub-score; the figure is the points it added to the 100-point composite (weight × sub-score).
- Cash flow +30.0/30.0
- 1% rule +10.0/10.0
- DSCR +10.0/10.0
- ARV discount +7.5/15.0
- Appreciation +5.2/10.0
- Livability +4.0/5.0
- Schools +3.3/10.0
- Rent growth +2.5/5.0
- Condition / age +2.5/5.0
$42,500
🖨 Deal sheet (PDF) 📄 Offer letter ✓ Due diligence
Listing remarks MLS
Great opportunity in Tarentum! Large covered front porch! Spacious kitchen with plenty of wooden cabinetry! Two generous sized bedrooms with large closets! Unfinished basement for additional storage! Centrally located! Close to shopping and transportation! Amazing investment potential!
Key facts
- 2,491 sq ft lot
- Built 1900
- Listed 80 days
Neighborhood map
What this means for you Summary
Snapshot
- This is a 2-bed/1.0-bath single-family listed at $42k.
Deal economics
- At list price, monthly cash flow is $522 ($6k/yr) — positive.
- The deal already cash-flows at list — no discount required.
- Meets the 1% rule at list price ($1k rent vs $42k).
- Recommended offer: $40k (6.0% below list) — sets the bar for market timing.
- Cap rate 21.0% vs local median 8.7% in Tarentum — top-decile yield for the area; either an underpriced asset or a hidden risk that comps aren't pricing in. Stress-test before assuming the spread holds.
Location & tenants
- Location reads 79/100 on livability (#240 in PA, #2,066 nationally) — a middle-class / working-renter tenant base. Strengths: commute A+, cost of living A+, housing A+; Watch: schools C-, amenities F, employment F.
- Highlands SD (suburban): math 29% / reading 48% proficiency, ranked #376 of 539 in PA (top 70%) — families likely to look elsewhere, expect single-tenant / working-renter base with shorter leases.
- Market conditions: 41 active listings in the ZIP; 4 comparable units currently listed for rent nearby; rentals at typical pace (median 22d on market — plan ~3-4 weeks tenant-placement turnaround); 2,996 units permitted in Allegheny County in 2024 (1,588 in 5+ unit buildings).
Forward outlook
- In year one you build about $487 of equity ($294 loan paydown + $193 appreciation (0.5% local appreciation)).
- At projected returns (0.5% appreciation + 3.0% rent growth), your $12k cash investment doubles in ~2 years — after that, you're playing with house money.
Negotiation context
- It's been on market 81 days — a 6% lower offer ($40k) is reasonable based on typical stale-listing flexibility.
- 2 sale attempts since 30y ago; this cycle's ask has dropped $7k (15%) from the opening price — seller is motivated, your offer sets the floor, not the list.
- Current owner paid $34k; 27% above their basis — modest negotiation headroom, anchor on the comps not their cost.
Risks & watch-outs
- Watch-outs: built in 1900 — expect roof / HVAC / electrical / plumbing capex.
- Climate carrying-cost: extreme-heat days projected 8→20/yr by 2055 (HVAC capex compounding) — expect insurance premiums to compound above CPI over the hold.
Questions for the listing agent
- It's been on market 81 days. Have you received any prior offers? Is the seller open to a 6% concession, seller financing, or rate buy-down credit?
- Built in 1900 — when were the roof, HVAC, electrical panel, plumbing, and water heater last replaced?
- Why hasn't it sold? Are there any deal-killer items the seller is aware of (foundation, flood, title, zoning, code violations)?
- Is there a deadline driving the sale (1031 exchange, divorce, estate, relocation)? That informs how much negotiation room exists.
- What's the average days-on-market for RENTAL listings here right now (not sales)? A rising rental-DOM trend means longer vacancies and softer asking-rent achievability than the comps imply.
- What's the recent tenant-quality profile in this submarket — average credit score on applications, eviction rate, late-payment / NSF rate, and stable-employment percentage? A property-management company in the area should have these aggregated.
- How much new for-sale + rental construction is in the pipeline within 1–3 miles? Heavy new supply typically softens prices + rents 12–24 months out; constrained supply supports both.
Investment metrics
- 1% rule
- 2.43% ✓
- Cap rate
- 21.03%
- Cash-on-cash
- 52.62%
- DSCR
- 3.34
- GRM
- 3.4
CMA / ARV
- ARV (median comp)
- $93,797
- List price
- $42,500
- Delta
- -54.69%
- Verdict
- UNDERPRICED
- Comps
- 20 within 1.0 mi
Show comp detail 7 sales within ~0.75 mi
| Address | Dist | Beds/Ba | Sqft | Sold | Price | $/sf | Match |
|---|---|---|---|---|---|---|---|
| 318 W 8th Ave | 0.04mi | 2/1.0 | 1,216 (+9%) | 11mo | $25,000 | $21 | 74 |
| 112 W 13th Ave | 0.35mi | 3/2.0 (+1) | 1,080 (-3%) | 3mo | $47,500 | $44 | 67 |
| 328 W 10th Ave | 0.13mi | 2/1.0 | 1,260 (+13%) | 16mo | $45,000 | $36 | 58 |
| 107 E 1st Ave | 0.45mi | 3/1.0 (+1) | 1,040 (-7%) | 8mo | $36,166 | $35 | 57 |
| 333 1/2 W 11th Ave | 0.17mi | 3/1.0 (+1) | 1,008 (-10%) | 23mo | $98,000 | $97 | 52 |
| 413 Days Run Rd | 0.75mi | 2/1.0 | 1,210 (+9%) | 12mo | $149,000 | $123 | 41 |
| 329 E 1st Ave | 0.69mi | 2/1.5 | 1,048 (-6%) | 23mo | $190,000 | $181 | 37 |
Match score weights: distance 35% · size 25% · config 20% · recency 20%. Top-matched comps best support the ARV.
Projected returns pro-forma
0.45% appreciation · 3.0% rent growth · sell at horizon
- IRR
- 54.7%
- Equity multiple
- 3.77×
- Total profit
- $32,923
- Equity at exit
- $13,314
- IRR
- 56.7%
- Equity multiple
- 7.57×
- Total profit
- $78,158
- Equity at exit
- $16,802
Cash invested: $11,900 (down + closing). Projections, not guarantees.
Landlord ↔ Tenant lean methodology
- Overall (STATE)
- 62 Landlord-Friendly
- State Pennsylvania
- 62 Landlord-Friendly · EVEN
- County
- — inherits STATE
- City
- — inherits STATE
ZIP-level market 15084
- Home prices YoY
- 0.2%
- Active inventory
- 41
- Price-to-rent
- 3.4×
Monthly cashflow live
- Estimated rent
- $1,032 medium interval (Pro) →
- Mortgage (P&I)
- −$223
- Tax from tax record
- −$53 /mo · $633/yr
- Insurance
- −$18
- HOA
- −$0
- Vacancy / Maint / Mgmt
- −$217
- Net cashflow
- $522
Break-even live
Sensitivity live
| Price | -10% $546 | -5% $534 | +0% $522 | +5% $510 | +10% $498 |
|---|---|---|---|---|---|
| Rent | -10% $440 | -5% $481 | +0% $522 | +5% $563 | +10% $603 |
| Rate | -1.0pp $543 | -0.5pp $533 | base $522 | +0.5pp $511 | +1.0pp $500 |
UW: 25.0% down · 7.5% · 30yr · 1.5% tax · 5.0% vac · 8.0% maint · 8.0% mgmt
Financing live
Cash to close
- Down payment
- $10,625
- Closing costs
- $1,275
- Reserves months
- —
- Total cash needed
- —
Loan-product check · same deal, 3 products live
Conventional
25% down · 7.5% · 30yr
- Down + closing
- —
- Monthly P&I
- —
- Monthly cashflow
- —
- DSCR
- —
- Eligible?
- —
Personal DTI + credit; lowest rate.
DSCR
20% down · 8.5% · 30yr
- Down + closing
- —
- Monthly P&I
- —
- Monthly cashflow
- —
- DSCR
- —
- Eligible?
- —
No personal income docs; deal must DSCR.
Hard money
10% down · 12.0% · 12mo
- Down + closing
- —
- Monthly P&I
- —
- Monthly cashflow
- —
- DSCR
- —
- Eligible?
- —
Short-term bridge; refi at stabilization.
Rent comps 4 comps
| Address | Beds | Baths | Sqft | Rent | $/sqft | DOM | Units | Dist |
|---|---|---|---|---|---|---|---|---|
| 1127 Highland St Unit 2 Tarentum, PA | 1.0 | 1.0 | 700 | $800 | $1.14 | 24d | 1 | 0.86mi |
| 728 9th Ave Brackenridge, PA | 1.0 | 1.0 | 1050 | $900 | $0.86 | 22d | 1 | 1.02mi |
| 875 1st Ave Brackenridge, PA | 3.0 | 2.0 | 1440 | $1,399 | $0.97 | 15d | 1 | 1.25mi |
| 300 Craigdell Rd New Kensington, PA | 3.0 | 2.0 | 1300 | $1,130 | $0.87 | 2d | 1 | 1.28mi |
Listing history 21 events
-
2026-06-21days on market $42,500 Active 81 DOM
-
2026-06-18days on market $42,500 Active 78 DOM
-
2026-06-17days on market $42,500 Active 77 DOM
-
2026-06-16days on market $42,500 Active 76 DOM
-
2026-06-15days on market $42,500 Active 75 DOM
-
2026-06-13days on market $42,500 Active 73 DOM
-
2026-06-13days on market $42,500 Active 72 DOM
-
2026-06-09days on market $42,500 Active 69 DOM
-
2026-06-08days on market $42,500 Active 68 DOM
-
2026-06-07days on market $42,500 Active 67 DOM
-
2026-06-05days on market $42,500 Active 64 DOM
-
2026-06-03days on market $42,500 Active 63 DOM
-
2026-06-02days on market $42,500 Active 62 DOM
-
2026-06-01days on market $42,500 Active 61 DOM
-
2026-05-31days on market $42,500 Active 60 DOM
-
2026-04-29price $42,500 286-char remark
Show marketing remark (286 chars)
Great opportunity in Tarentum! Large covered front porch! Spacious kitchen with plenty of wooden cabinetry! Two generous sized bedrooms with large closets! Unfinished basement for additional storage! Centrally located! Close to shopping and transportation! Amazing investment potential!
-
2026-03-31$49,900 Active 286-char remark
Show marketing remark (286 chars)
Great opportunity in Tarentum! Large covered front porch! Spacious kitchen with plenty of wooden cabinetry! Two generous sized bedrooms with large closets! Unfinished basement for additional storage! Centrally located! Close to shopping and transportation! Amazing investment potential!
-
1996-03-01soldstatus $33,500
-
1996-02-29soldstatus $33,500 67-char remark
Show marketing remark (67 chars)
SELLERS BUYING ANOTHER HOME, CUTE & COZY, SPOTLES, A MUST SEE
-
1996-01-28$33,500 67-char remark
Show marketing remark (67 chars)
SELLERS BUYING ANOTHER HOME, CUTE & COZY, SPOTLES, A MUST SEE
-
1992-04-03soldstatus $35,000
ⓘ Source: listings_history table (triggers on properties + properties_extension) + one-shot
backfill from property_details.listing_events for pre-trigger history.
Tax reassessment forecast PA · Partial reset (capped growth)
- Current annual tax
- $633 · $53/mo
- Projected year-2 tax
- $652 · $54/mo
- Expected delta
- +$19/yr (+$2/mo · 3.0%)
ⓘ Screening estimate from a state-policy table — verify with the county assessor before closing.
Climate risk First Street
- Flood 1/10 Low FEMA zone X (unshaded) · 0% chance over 30 yrs
- Wildfire 1/10 Low
- Heat 5/10 Major 8 d/yr ≥97°F today · 20 d/yr by 30 yrs out
- Wind 2/10 Low
- Air quality 4/10 Moderate 5 unhealthy d/yr today · 6 by 30 yrs out
Nearby sold comps map
Loading sold comps map…
Walkable amenities ~0.75 mi
Loading nearby amenities…
Taxation est. · year 1
- Rental income
- $12,383
- − Mortgage interest
- −$2,381
- − Property taxes
- −$633
- − Insurance
- −$212
- − Repairs & maintenance
- −$991
- − Management
- −$991
- − Depreciation
- −$1,236
- Taxable income
- $5,939
- Est. tax owed @ 24.0%
- −$1,425
- After-tax cash flow
- $4,837/yr
For passive investors: Depreciation is non-cash, so a rental often shows a tax loss while cash-flowing — sheltering income. Rental losses are passive: they offset passive income freely, and up to $25,000/yr can offset ordinary (W-2) income if you actively participate and your MAGI is under $100k (phasing out to $0 by $150k); unused losses carry forward. On sale, claimed depreciation is recaptured at up to 25%, and gains may owe capital-gains tax (a 1031 exchange can defer both). Figures are a year-1 estimate at your 24.0% rate — not tax advice; consult a CPA.
Schools (NCES district)
- District
- Highlands SD
- NCES district ID
- 4211880
- Math proficiency
- 29% ▼ -9.00%
- Reading proficiency
- 48% ▼ -9.00%
- Median HH income
- $43,730
- Composite
- 32.58/100
- National rank
- #5679
- State rank
- #376 of 539 in PA
Livability — Tarentum
- Score
- 79/100
- State rank
- #240
- US rank
- #2066
Category grades
Schools grade is shown separately in the Schools card above.
Census & demographics
- Census place
- Tarentum, PA
- Population (ZIP)
- 9,884
Population outlook (Allegheny County) Hauer SSP2
- Today (2025)
- 1,250,282 people
- By 2030
- 1,256,482 · +0.5%
- By 2040
- 1,256,318 · +0.5%
- By 2050
- 1,244,169 · -0.5%
- By 2075
- 1,197,693 · -4.2%
- By 2100
- 1,093,187 · -12.6%
Race, ethnicity, and origin ACS 2023
- Neighborhood character
- Predominantly White (92%)
- Race & ethnicity
- White 92% Two or more races 4% Black 3% Hispanic / Latino 1%
- Common ancestry
- Romanian 14% Lithuanian 2% Serbian 2%
- Foreign-born
- 1%
- Languages at home
- 98% English-only · French/Haitian/Cajun 1%
Political lean MEDSL · Allegheny
- 2024 margin
- Strong D (+20.3) · D 59.7% · R 39.4%
- 2008→2024 swing
- +4.8pp toward D · 2008: 15.5pp · 2024: 20.3pp
- All cycles
- 2024: D+20.3 2020: D+20.4 2016: D+16.4 2012: D+14.4 2008: D+15.5
Not yet ingested
- Civics
- —
Market trends
- HPI YoY
- ▲ 0.45%
- Current HPI
- 230.7532
- Rent YoY
- —
- Metro
- —
- State GDP YoY
- ▲ 1.68%
- F500 in state
- 34
Industry mix (Fortune 500 HQ in PA)
| Industry | F500 HQs | Revenue |
|---|---|---|
| Healthcare | 2 | $309B |
|
||
| Insurance | 2 | $27B |
|
||
| Telecommunications / Media | 1 | $124B |
|
||
| Industrial Distribution | 1 | $22B |
|
||
| Financial Services | 1 | $20B |
|
||
| Chemicals / Materials | 1 | $18B |
|
||
Price history
+21.4% since first listed6 events — show timeline
- 2026-04-29 Price Changed $42,500 West Penn MLS
- 2026-03-31 Listed $49,900 West Penn MLS
- 1996-03-01 Sold (Public Records) $33,500 Public Records
- 1996-02-29 Sold (MLS) $33,500 West Penn MLS
- 1996-01-28 Listed $33,500 West Penn MLS
- 1992-04-03 Sold (Public Records) $35,000 Public Records
Property tax history
-0.6%/yrLatest (2026): $633 · -1.3% YoY. Source: county tax records.
Cash-flow waterfall
monthlySold comps — $/sqft
last 12 mo · ≤1 miLoading sold comps…