1372 Shakespeare Ave Unit 4C · New York, NY
Flood risk 1/10 · Minimal
- FEMA flood zone
- X (unshaded)
- Chance of flooding over 30 yrs
- 0.0%
- Est. flood insurance / yr
- $507 – $1,088
Fire risk 1/10 · Minimal
- Est. fire insurance / yr
- $691 – $1,283
Heat risk 6/10 · Moderate
- Hot days now (above 99°F)
- 7 days/yr
- Hot days in 30 yrs
- 15 days/yr
Wind risk 6/10 · Moderate
- Chance of severe wind over 30 yrs
- 27.0%
Air-quality risk 4/10 · Minor
- Unhealthy air days now
- 5 days/yr
- Unhealthy air days in 30 yrs
- 6 days/yr
Risk factors via First Street. Map © Google.
Why this score? — see what drove the B+ grade
The composite is a weighted blend of 9 inputs, each scored 0–100. Each bar is that input's sub-score; the figure is the points it added to the 100-point composite (weight × sub-score).
- Cash flow +30.0/30.0
- DSCR +10.0/10.0
- 1% rule +9.5/10.0
- ARV discount +7.5/15.0
- Appreciation +6.8/10.0
- Schools +5.0/10.0
- Livability +3.8/5.0
- Rent growth +2.5/5.0
- Condition / age +2.5/5.0
$130,000
🖨 Deal sheet (PDF) 📄 Offer letter ✓ Due diligence
Listing remarks
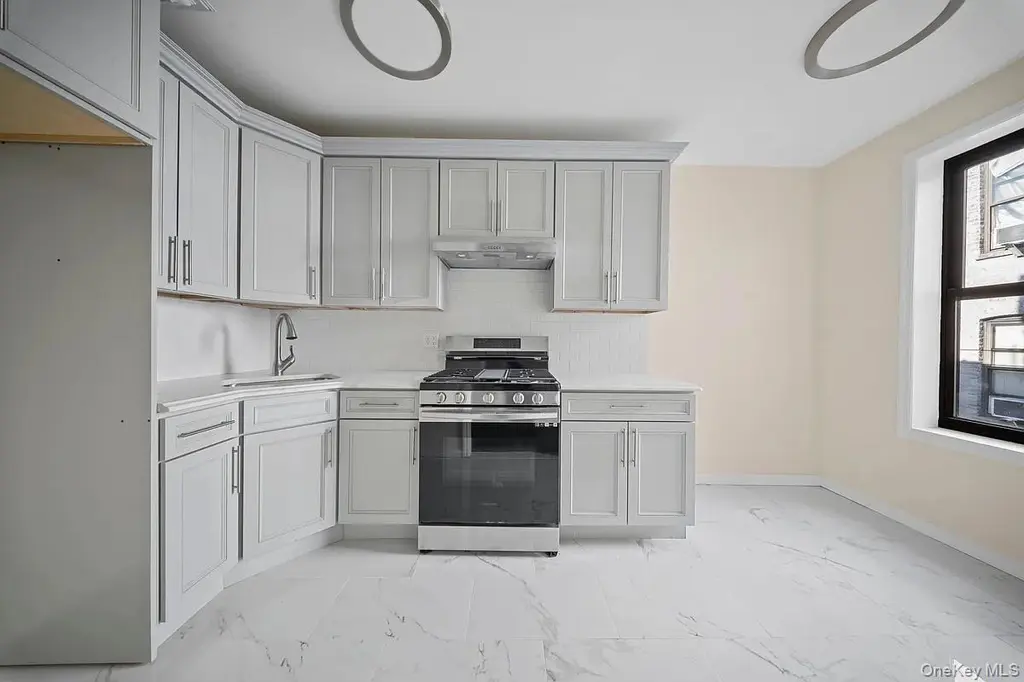
Affordable Homeownership in the Bronx Welcome to 1372 Shakespeare Ave #4C, a renovated 1-bedroom HDFC co-op in the Mt. Eden section of the Bronx. This bright 4th-floor walk-up offers hardwood floors throughout, a functional layout with a spacious bedroom and walk-in closet, along with a renovated kitchen with stainless steel appliances. Affordable maintenance fee of $670/mo This is a great opportunity for first-time homebuyers seeking affordable ownership with monthly payments that are equivalent to, if not lower than, your average rent. Limited financing options and first-time buyer grant programs may apply, helping qualified buyers own for less than the average NYC rent. Owner-occupancy
Key facts
- Spacious bedroom
- Walk-in closet
- Renovated kitchen
Tags
Property features AI
Finance
- Other: Living area listed as 600 (source: other)
- HOA & community: Association: 1372 Shakespeare Ave HDFC
Exterior
- Parking: On-street parking; No carport
- Utilities: Con-Edison electric; Natural gas connected; Electricity connected; Public sewer; Public trash collection
- Home design: Stock cooperative; Actual property condition; Located between 3rd and 5th floors
- Construction: Brick construction
- Exterior features: Not waterfront; Walk-up building
Interior
- Kitchen: Gas range
- Bedrooms: 4 rooms total (includes bedrooms) — unit located between 3rd and 5th floors; entry level 4
- Flooring: Ceramic tile; Wood
- Bathrooms: 1 full bathroom
- Heating & cooling: Radiant heating; Other heating; No central cooling
- Interior features: Aluminum window frames; Other interior features
- Laundry & utility: No basement
Neighborhood map
What this means for you Summary
Snapshot
- This is a 1-bed/1.0-bath condo listed at $130k.
Deal economics
- At list price, monthly cash flow is $591 ($7k/yr) — positive.
- The deal already cash-flows at list — no discount required.
- Meets the 1% rule at list price ($2k rent vs $130k).
- Recommended offer: $122k (6.0% below list) — sets the bar for market timing.
- Cap rate 11.8% vs local median 2.6% in New York — top-decile yield for the area; either an underpriced asset or a hidden risk that comps aren't pricing in. Stress-test before assuming the spread holds.
Location & tenants
- Location reads 75/100 on livability (#268 in NY, #4,188 nationally) — a middle-class / working-renter tenant base. Strengths: amenities A+, commute A+, health & safety A; Watch: crime F, cost of living F.
- Market conditions: 41 active listings in the ZIP; lower-income renter base — watch delinquency; 6,929 units permitted in Bronx County in 2024 (6,829 in 5+ unit buildings).
- At $1,886/mo this rent would consume 55% of the median local household income ($41k/yr) (locally 10080% of renters already pay >50% of income on rent) — very limited rent-growth headroom before tenants either downsize or default.
Forward outlook
- In year one you build about $5k of equity ($899 loan paydown + $5k appreciation (3.5% local appreciation)).
- Bronx County population projected at +21% by 2050 — long-run rental-demand tailwind backs the buy-and-hold thesis.
- At projected returns (3.5% appreciation + 3.0% rent growth), your $36k cash investment doubles in ~3 years — after that, you're playing with house money.
- By year 7, paydown + projected appreciation supports a ~$35k cash-out refi (75% LTV) — recoverable capital for the next deal without selling this one.
Negotiation context
- It's been on market 65 days — a 6% lower offer ($122k) is reasonable based on typical stale-listing flexibility.
- 8 sale attempts since 8y ago with the ask held roughly flat each time — persistent listings suggest the price (not the market) is what's stuck; bring a comps-based counter.
Risks & watch-outs
- Watch-outs: built in 1926 — expect roof / HVAC / electrical / plumbing capex.
- Climate carrying-cost: major wind risk, 27% chance of damaging wind over 30y; extreme-heat days projected 7→15/yr by 2055 (HVAC capex compounding) — expect insurance premiums to compound above CPI over the hold.
Questions for the listing agent
- It's been on market 65 days. Have you received any prior offers? Is the seller open to a 6% concession, seller financing, or rate buy-down credit?
- Built in 1926 — when were the roof, HVAC, electrical panel, plumbing, and water heater last replaced?
- Any open or pending special assessments — roof, HVAC, plumbing, elevator, façade? What's the per-unit balance and payoff schedule, and is the seller paying it off at close or rolling it to the buyer?
- Why hasn't it sold? Are there any deal-killer items the seller is aware of (foundation, flood, title, zoning, code violations)?
- Is there a deadline driving the sale (1031 exchange, divorce, estate, relocation)? That informs how much negotiation room exists.
- Schools are B-rated — typically a magnet for longer-tenancy family renters. What's the average tenant stay here, and is there a school-zone premium baked into asking?
- Crime grade is F in this area — have there been break-ins, vandalism, or insurance claims at this property in the last 3 years? What carrier currently insures it and at what premium?
- What's the average days-on-market for RENTAL listings here right now (not sales)? A rising rental-DOM trend means longer vacancies and softer asking-rent achievability than the comps imply.
- What's the recent tenant-quality profile in this submarket — average credit score on applications, eviction rate, late-payment / NSF rate, and stable-employment percentage? A property-management company in the area should have these aggregated.
- How much new apartment / multifamily construction is in the pipeline within 1–3 miles? Heavy new supply (>2% of stock underway) typically softens rents 12–24 months out; light construction supports rent growth.
Investment metrics
- 1% rule
- 1.45% ✓
- Cap rate
- 11.75%
- Cash-on-cash
- 19.50%
- DSCR
- 1.87
- GRM
- 5.7
CMA / ARV
No comps found within radius.
Projected returns pro-forma
3.51% appreciation · 3.0% rent growth · sell at horizon
- IRR
- 26.9%
- Equity multiple
- 2.56×
- Total profit
- $56,901
- Equity at exit
- $62,223
- IRR
- 27.1%
- Equity multiple
- 5.00×
- Total profit
- $145,534
- Equity at exit
- $98,934
Cash invested: $36,400 (down + closing). Projections, not guarantees.
Landlord ↔ Tenant lean methodology
- Overall (CITY)
- 0 Strongly Tenant-Friendly
- State New York
- 15 Strongly Tenant-Friendly · D+10
- County
- — inherits STATE
- City New York
- 0 Strongly Tenant-Friendly · D+34
ZIP-level market 10452
- Home prices YoY
- 2.4%
- Active inventory
- 41
- Price-to-rent
- 5.7×
Monthly cashflow live
- Estimated rent
- $1,886 medium interval (Pro) →
- Mortgage (P&I)
- −$682
- Tax est. 1.5%
- −$162 /mo · $1,950/yr
- Insurance
- −$54
- HOA
- −$0
- Vacancy / Maint / Mgmt
- −$396
- Net cashflow
- $591
Break-even live
Sensitivity live
| Price | -10% $681 | -5% $636 | +0% $591 | +5% $547 | +10% $502 |
|---|---|---|---|---|---|
| Rent | -10% $442 | -5% $517 | +0% $591 | +5% $666 | +10% $740 |
| Rate | -1.0pp $657 | -0.5pp $624 | base $591 | +0.5pp $558 | +1.0pp $523 |
UW: 25.0% down · 7.5% · 30yr · 1.5% tax · 5.0% vac · 8.0% maint · 8.0% mgmt
Financing live
Cash to close
- Down payment
- $32,500
- Closing costs
- $3,900
- Reserves months
- —
- Total cash needed
- —
Loan-product check · same deal, 3 products live
Conventional
25% down · 7.5% · 30yr
- Down + closing
- —
- Monthly P&I
- —
- Monthly cashflow
- —
- DSCR
- —
- Eligible?
- —
Personal DTI + credit; lowest rate.
DSCR
20% down · 8.5% · 30yr
- Down + closing
- —
- Monthly P&I
- —
- Monthly cashflow
- —
- DSCR
- —
- Eligible?
- —
No personal income docs; deal must DSCR.
Hard money
10% down · 12.0% · 12mo
- Down + closing
- —
- Monthly P&I
- —
- Monthly cashflow
- —
- DSCR
- —
- Eligible?
- —
Short-term bridge; refi at stabilization.
HOA detail condo
- Monthly dues
- $0 · $0/yr
- Assessments
- None detected in remarks — confirm with the listing agent.
Listing history 30 events
-
2026-06-18days on market $130,000 Active 65 DOM
-
2026-06-17days on market $130,000 Active 64 DOM
-
2026-06-15days on market $130,000 Active 62 DOM
-
2026-06-13days on market $130,000 Active 60 DOM
-
2026-06-10days on market $130,000 Active 56 DOM
-
2026-06-08days on market $130,000 Active 55 DOM
-
2026-06-08days on market $130,000 Active 54 DOM
-
2026-06-04days on market $130,000 Active 51 DOM
-
2026-06-03days on market $130,000 Active 50 DOM
-
2026-06-01days on market $130,000 Active 48 DOM
-
2026-05-31days on market $130,000 Active 47 DOM
-
2026-04-14$130,000 Active
-
2026-03-01historical
-
2025-10-28$130,000 Active
-
2025-08-01historical
-
2025-05-20price $139,000
-
2025-02-28$140,000 Active
-
2025-01-31historical
-
2024-07-17status Active
-
2024-06-30historical
-
2024-04-02status Active
-
2024-03-31historical
-
2024-02-05price $149,999
-
2023-10-20$159,999 Active
-
2020-05-21historical
-
2020-03-27status Pending
-
2019-05-23status Pending
-
2019-04-09$85,000 Active
-
2018-07-09historical
-
2018-04-20$85,000 Active
ⓘ Source: listings_history table (triggers on properties + properties_extension) + one-shot
backfill from property_details.listing_events for pre-trigger history.
Climate risk First Street
- Flood 1/10 Low FEMA zone X (unshaded) · 0% chance over 30 yrs
- Wildfire 1/10 Low
- Heat 6/10 Major 7 d/yr ≥99°F today · 15 d/yr by 30 yrs out
- Wind 6/10 Major 27% chance of damaging wind over 30 yrs
- Air quality 4/10 Moderate 5 unhealthy d/yr today · 6 by 30 yrs out
Nearby sold comps map
Loading sold comps map…
Walkable amenities ~0.75 mi
Loading nearby amenities…
Taxation est. · year 1
- Rental income
- $22,630
- − Mortgage interest
- −$7,282
- − Property taxes
- −$1,950
- − Insurance
- −$650
- − Repairs & maintenance
- −$1,810
- − Management
- −$1,810
- − Depreciation
- −$3,782
- Taxable income
- $5,346
- Est. tax owed @ 24.0%
- −$1,283
- After-tax cash flow
- $5,814/yr
For passive investors: Depreciation is non-cash, so a rental often shows a tax loss while cash-flowing — sheltering income. Rental losses are passive: they offset passive income freely, and up to $25,000/yr can offset ordinary (W-2) income if you actively participate and your MAGI is under $100k (phasing out to $0 by $150k); unused losses carry forward. On sale, claimed depreciation is recaptured at up to 25%, and gains may owe capital-gains tax (a 1031 exchange can defer both). Figures are a year-1 estimate at your 24.0% rate — not tax advice; consult a CPA.
Schools (NCES district)
No district data.
Livability — New York
- Score
- 75/100
- State rank
- #268
- US rank
- #4188
Category grades
Schools grade is shown separately in the Schools card above.
Census & demographics
- Census place
- New York, NY
- County
- Bronx County · 1,197,324 people
- City population
- 7,731,280
- Metro
- New York-Newark-Jersey City, NY-NJ-PA
- Population (ZIP)
- 75,682
- Household income
- $41,288
- Rent vs Own
- Severe rent burden
- 10080.0
Population outlook (Bronx County) Hauer SSP2
- Today (2025)
- 1,607,353 people
- By 2030
- 1,681,852 · +4.6%
- By 2040
- 1,824,421 · +13.5%
- By 2050
- 1,945,470 · +21.0%
- By 2075
- 2,187,887 · +36.1%
- By 2100
- 2,244,136 · +39.6%
Race, ethnicity, and origin ACS 2023
- Neighborhood character
- Predominantly Hispanic (65%)
- Race & ethnicity
- Hispanic / Latino 65% Black 28% Two or more races 14% White 3%
- Hispanic origin (detail)
- Mexican 8% Puerto Rican 15% Dominican 34%
- Foreign-born
- 37% · Canada
- Languages at home
- 32% English-only · Spanish 58% French/Haitian/Cajun 2% Other Indo-European 1%
Political lean MEDSL · Bronx
- 2024 margin
- Solid D (+45.4) · D 72.7% · R 27.3%
- 2008→2024 swing
- -32.3pp toward R · 2008: 77.8pp · 2024: 45.4pp
- All cycles
- 2024: D+45.4 2020: D+67.6 2016: D+79.1 2012: D+82.9 2008: D+77.8
Not yet ingested
- Civics
- —
Market trends
- HPI YoY
- ▲ 3.51%
- Current HPI
- 153.1372
- Rent YoY
- —
- Metro
- New York-Newark-Jersey City, NY-NJ-PA
- State GDP YoY
- ▲ 2.60%
- F500 in state
- 92
Industry mix (Fortune 500 HQ in NY)
| Industry | F500 HQs | Revenue |
|---|---|---|
| Financial Services | 10 | $950B |
|
||
| Consumer Goods | 9 | $162B |
|
||
| Insurance | 4 | $225B |
|
||
| Telecommunications | 2 | $144B |
|
||
| Pharmaceuticals | 2 | $112B |
|
||
| Media / Entertainment | 2 | $69B |
|
||
Price history
+52.9% since first listed19 events — show timeline
- 2026-04-14 Listed $130,000 OneKey® MLS as Distributed by MLS Grid
- 2026-03-01 Listing Removed — OneKey® MLS as Distributed by MLS Grid
- 2025-10-28 Listed $130,000 OneKey® MLS as Distributed by MLS Grid
- 2025-08-01 Listing Removed — OneKey® MLS as Distributed by MLS Grid
- 2025-05-20 Price Changed $139,000 OneKey® MLS as Distributed by MLS Grid
- 2025-02-28 Listed $140,000 OneKey® MLS as Distributed by MLS Grid
- 2025-01-31 Listing Removed — OneKey® MLS as Distributed by MLS Grid
- 2024-07-17 Relisted — OneKey® MLS as Distributed by MLS Grid
- 2024-06-30 Listing Removed — OneKey® MLS as Distributed by MLS Grid
- 2024-04-02 Relisted — OneKey® MLS as Distributed by MLS Grid
- 2024-03-31 Listing Removed — OneKey® MLS as Distributed by MLS Grid
- 2024-02-05 Price Changed $149,999 OneKey® MLS as Distributed by MLS Grid
- 2023-10-20 Listed $159,999 OneKey® MLS as Distributed by MLS Grid
- 2020-05-21 Listing Removed — OneKey® MLS as Distributed by MLS Grid
- 2020-03-27 Pending — OneKey® MLS as Distributed by MLS Grid
- 2019-05-23 Pending — OneKey® MLS as Distributed by MLS Grid
- 2019-04-09 Listed $85,000 OneKey® MLS as Distributed by MLS Grid
- 2018-07-09 Listing Removed — OneKey® MLS as Distributed by MLS Grid
- 2018-04-20 Listed $85,000 OneKey® MLS as Distributed by MLS Grid
Cash-flow waterfall
monthlySold comps — $/sqft
last 12 mo · ≤1 miLoading sold comps…