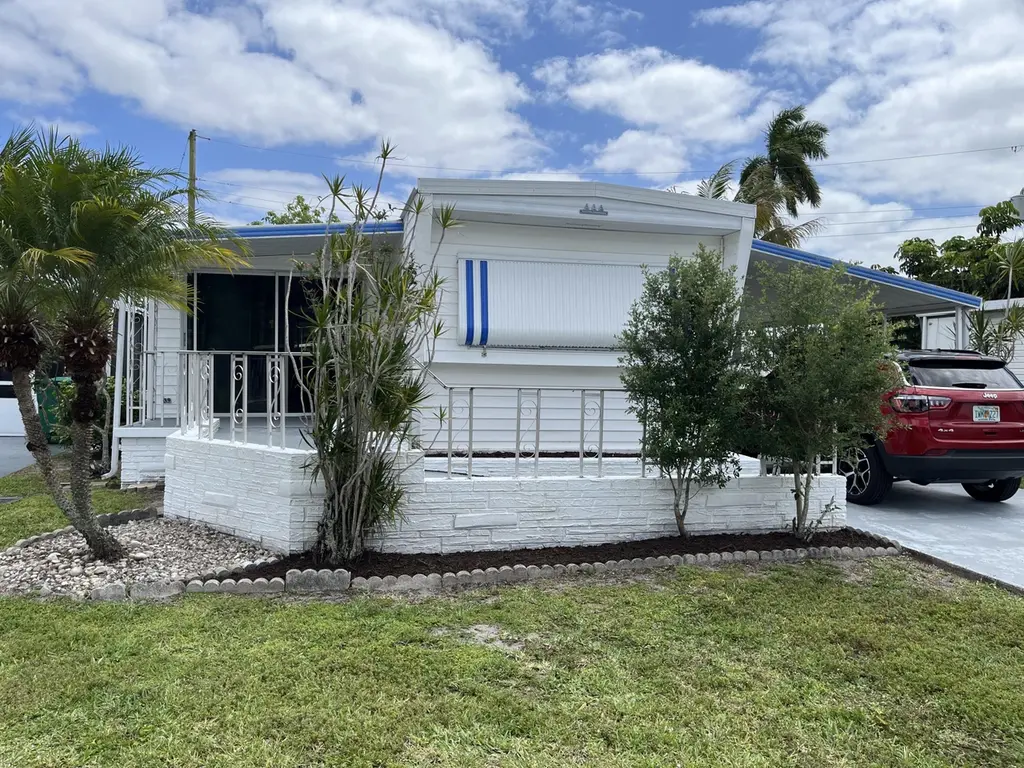
8510 SW 18th Pl · Davie, FL
Flood risk 1/10 · Minimal
- FEMA flood zone
- X (shaded)
- Chance of flooding over 30 yrs
- 0.0%
- Est. flood insurance / yr
- $507 – $1,088
Fire risk 1/10 · Minimal
- Est. fire insurance / yr
- $947 – $1,759
Heat risk 10/10 · Severe
- Hot days now (above 105°F)
- 7 days/yr
- Hot days in 30 yrs
- 27 days/yr
Wind risk 10/10 · Severe
- Chance of severe wind over 30 yrs
- 99.0%
Air-quality risk 3/10 · Minor
- Unhealthy air days now
- 2 days/yr
- Unhealthy air days in 30 yrs
- 3 days/yr
Risk factors via First Street. Map © Google.
Why this score? — see what drove the B grade
The composite is a weighted blend of 9 inputs, each scored 0–100. Each bar is that input's sub-score; the figure is the points it added to the 100-point composite (weight × sub-score).
- Cash flow +30.0/30.0
- DSCR +10.0/10.0
- ARV discount +10.0/15.0
- 1% rule +9.5/10.0
- Schools +4.1/10.0
- Livability +4.1/5.0
- Rent growth +2.8/5.0
- Condition / age +2.5/5.0
- Appreciation +0.0/10.0
$149,900
🖨 Deal sheet (PDF) 📄 Offer letter ✓ Due diligence
Listing remarks
Look and the feel of a double wide. Recently remodeled kitchen with granite countertops and remodeled bathrooms. Handicap ramp on front entrance. Has a carport, front porch, 55 plus community
Key facts
- Remodeled kitchen
- Front porch
- Carport
Tags
Property features AI
Finance
- Financial info: Pets allowed (cats and dogs OK) with breed, number and size restrictions; Community of approximately 1,350 units
- HOA & community: Association present with community amenities: pool (heated), billiard room, library, management and on-site manager; HOA fee approximately $149.70 monthly (covers common areas, recreation facility, pool service); Senior community
Exterior
- Parking: 3 total parking spaces; Attached carport; Carport with 12 covered spaces; 2 open parking spaces; Concrete surfaces
- Utilities: Public water; Public sewer; Electric with circuit breakers; Cable available; Electricity available
- Home design: Manufactured home (park model); One story; Resale, updated/remodeled; Front or either side entry; Faces north
- Construction: Vinyl siding exterior; Metal roof; Block and pillar/post/pier foundation; Brick skirting; Mobile home dimensions approximately 43' x 23'; Mobile home remains on site
- Exterior features: Covered patio and screened porch; Patio and porch; Storage structure; Interior lot; Paved road frontage
Interior
- Kitchen: Refrigerator
- Bedrooms: 2 bedrooms on the main level
- Flooring: Vinyl flooring
- Bathrooms: 1 full bathroom; 1 half bathroom
- Heating & cooling: Has heating (type: Other); Ceiling fan(s); Has cooling (type: Other)
- Interior features: Blinds on windows; Furnished negotiable; Accessible approach with ramp
- Laundry & utility: Laundry located outside
Neighborhood map
What this means for you Summary
Snapshot
- This is a 2-bed/2.0-bath manufactured listed at $150k.
Deal economics
- At list price, monthly cash flow is $624 ($7k/yr) — positive.
- The deal already cash-flows at list — no discount required.
- Meets the 1% rule at list price ($2k rent vs $150k).
- Recommended offer: $148k (1.5% below list) — sets the bar for market timing.
- Cap rate 11.3% vs local median 3.4% in Davie — top-decile yield for the area; either an underpriced asset or a hidden risk that comps aren't pricing in. Stress-test before assuming the spread holds.
Location & tenants
- Location reads 82/100 on livability (#68 in FL, #1,159 nationally) — a professional / high-income tenant draw. Strengths: crime A+, housing A+, health & safety A+; Watch: cost of living D, amenities D-.
- Broward (suburban): math 42% / reading 53% proficiency, ranked #46 of 73 in FL (top 63%) — families likely to look elsewhere, expect single-tenant / working-renter base with shorter leases.
- Zoned schools: Tropical Elementary School (math 54% / reading 64%, grade B-, #722 of 2,144 statewide, top 34%, 839 students, 53% FRL); Seminole Middle School (math 39% / reading 53%, grade D+, #300 of 571 statewide, top 53%, 1,072 students, 54% FRL); South Plantation High School (math 22% / reading 46%, grade F, #394 of 667 statewide, top 60%, 2,224 students, 59% FRL) — zoned schools at 55% FRL track the district average.
- Market conditions: Rents rising (+1.2%/yr); 398 active listings in the ZIP; 40 comparable units currently listed for rent nearby; rentals at typical pace (median 15d on market — plan ~3-4 weeks tenant-placement turnaround); solid renter incomes; 2,111 units permitted in Broward County in 2024 (1,265 in 5+ unit buildings).
- This rent runs 31% of the median local income ($85k/yr) — at the standard rent-burdened threshold; future hikes will face affordability resistance.
Forward outlook
- Local home prices are declining (-3.0%/yr); year-one equity from $1k of loan paydown is wiped out by about $4k of value loss. Plan a longer hold.
- Broward County population projected at +34% by 2050 — long-run rental-demand tailwind backs the buy-and-hold thesis.
- At projected returns (-3.0% appreciation + 1.2% rent growth), your $42k cash investment doubles in ~8 years — after that, you're playing with house money.
Negotiation context
- It's been on market 23 days — a 2% lower offer ($148k) is reasonable based on typical stale-listing flexibility.
- Current owner paid $49k; list at $150k implies a 206% gain — meaningful room to come down on a strong offer.
Risks & watch-outs
- Climate carrying-cost: severe wind risk, 99% chance of damaging wind over 30y; extreme-heat days projected 7→27/yr by 2055 (HVAC capex compounding) — expect insurance premiums to compound above CPI over the hold.
Questions for the listing agent
- Built in 1967 — when were the roof, HVAC, electrical panel, plumbing, and water heater last replaced?
- What does the HOA fee cover, when was the last increase, and are there any pending special assessments or reserve-fund shortfalls?
- Is there a deadline driving the sale (1031 exchange, divorce, estate, relocation)? That informs how much negotiation room exists.
- Schools are A-rated — typically a magnet for longer-tenancy family renters. What's the average tenant stay here, and is there a school-zone premium baked into asking?
- What's the average days-on-market for RENTAL listings here right now (not sales)? A rising rental-DOM trend means longer vacancies and softer asking-rent achievability than the comps imply.
- What's the recent tenant-quality profile in this submarket — average credit score on applications, eviction rate, late-payment / NSF rate, and stable-employment percentage? A property-management company in the area should have these aggregated.
- How much new for-sale + rental construction is in the pipeline within 1–3 miles? Heavy new supply typically softens prices + rents 12–24 months out; constrained supply supports both.
Investment metrics
- 1% rule
- 1.45% ✓
- Cap rate
- 11.29%
- Cash-on-cash
- 17.83%
- DSCR
- 1.79
- GRM
- 5.7
CMA / ARV
- ARV (on-the-fly)
- $158,737
- Comps found
- 4
Show comp detail 4 sales within ~0.75 mi
| Address | Dist | Beds/Ba | Sqft | Sold | Price | $/sf | Match |
|---|---|---|---|---|---|---|---|
| 2041 SW 83rd Ave | 0.21mi | 2/2.0 | 885 (+1%) | 3mo | $160,000 | $181 | 86 |
| 8620 SW 22nd St | 0.32mi | 3/2.0 (+1) | 922 (+5%) | 1mo | $130,000 | $141 | 71 |
| 8500 SW 21st St | 0.23mi | 2/1.5 | 799 (-9%) | 3mo | $165,000 | $207 | 70 |
| 2301 SW 86th Ter | 0.38mi | 2/2.0 | 997 (+14%) | 2mo | $172,000 | $173 | 58 |
Match score weights: distance 35% · size 25% · config 20% · recency 20%. Top-matched comps best support the ARV.
Projected returns pro-forma
-3.0% appreciation · 1.23% rent growth · sell at horizon
- IRR
- 7.3%
- Equity multiple
- 1.28×
- Total profit
- $11,705
- Equity at exit
- $22,351
- IRR
- 15.0%
- Equity multiple
- 2.11×
- Total profit
- $46,566
- Equity at exit
- $12,961
Cash invested: $41,972 (down + closing). Projections, not guarantees.
Landlord ↔ Tenant lean methodology
- Overall (STATE)
- 87 Strongly Landlord-Friendly
- State Florida
- 87 Strongly Landlord-Friendly · R+3
- County
- — inherits STATE
- City
- — inherits STATE
ZIP-level market 33324
- Home prices YoY
- -33.5%
- Rents YoY
- 1.2%
- Active inventory
- 398
- Price-to-rent
- 5.7×
Monthly cashflow live
- Estimated rent
- $2,173 high interval (Pro) →
- Mortgage (P&I)
- −$786
- Tax from tax record
- −$95 /mo · $1,144/yr
- Insurance
- −$62
- HOA
- −$149
- Vacancy / Maint / Mgmt
- −$456
- Net cashflow
- $624
Break-even live
Sensitivity live
| Price | -10% $709 | -5% $666 | +0% $624 | +5% $581 | +10% $539 |
|---|---|---|---|---|---|
| Rent | -10% $452 | -5% $538 | +0% $624 | +5% $710 | +10% $795 |
| Rate | -1.0pp $699 | -0.5pp $662 | base $624 | +0.5pp $585 | +1.0pp $545 |
UW: 25.0% down · 7.5% · 30yr · 1.5% tax · 5.0% vac · 8.0% maint · 8.0% mgmt
Financing live
Cash to close
- Down payment
- $37,475
- Closing costs
- $4,497
- Reserves months
- —
- Total cash needed
- —
Loan-product check · same deal, 3 products live
Conventional
25% down · 7.5% · 30yr
- Down + closing
- —
- Monthly P&I
- —
- Monthly cashflow
- —
- DSCR
- —
- Eligible?
- —
Personal DTI + credit; lowest rate.
DSCR
20% down · 8.5% · 30yr
- Down + closing
- —
- Monthly P&I
- —
- Monthly cashflow
- —
- DSCR
- —
- Eligible?
- —
No personal income docs; deal must DSCR.
Hard money
10% down · 12.0% · 12mo
- Down + closing
- —
- Monthly P&I
- —
- Monthly cashflow
- —
- DSCR
- —
- Eligible?
- —
Short-term bridge; refi at stabilization.
Rent comps 40 comps
| Address | Beds | Baths | Sqft | Rent | $/sqft | DOM | Units | Dist |
|---|---|---|---|---|---|---|---|---|
| 1680 SW 84th Ave Davie, FL | 2.0 | 2.0 | 798 | $2,100 | $2.63 | 4d | 1 | 0.17mi |
| 8508 SW 16th Ct Davie, FL | 3.0 | 2.0 | 613 | $1,700 | $2.77 | 14d | 1 | 0.19mi |
| 8717 SW 16th Pl Davie, FL | 1.0 | 1.0 | 600 | $1,300 | $2.17 | 3d | 1 | 0.29mi |
| 8717 SW 16th Pl Davie, FL | 1.0 | 1.0 | 600 | $1,500 | $2.50 | 22d | 1 | 0.29mi |
| 8709 SW 15th St Unit na Davie, FL | 2.0 | 2.0 | 998 | $2,050 | $2.05 | 16d | 1 | 0.34mi |
| 2075 SW 82nd Ave #2075 Davie, FL | 2.0 | 2.0 | 907 | $3,200 | $3.53 | 4d | 1 | 0.36mi |
| 8210 Peters Rd Plantation, FL | 1.0 | 1.0 | 870 | $1,970 | $2.26 | 19d | 1 | 0.50mi |
| 8210 SW 12th St Plantation, FL | 1.0–3.0 | 1.0–2.0 | 1071 | $2,434 | $2.27 | 2d | 18 | 0.55mi |
| 1244 S Pine Island Rd Plantation, FL | 1.0–3.0 | 1.0–2.0 | 1057 | $2,606 | $2.47 | 3d | 36 | 0.56mi |
| 8141 SW 24th Ct #106 Davie, FL | 2.0 | 2.0 | 949 | $1,900 | $2.00 | 14d | 1 | 0.58mi |
| 8141 SW 24th Ct #106 Davie, FL | 2.0 | 2.0 | 949 | $1,900 | $2.00 | 15d | 1 | 0.58mi |
| 2461 SW 82nd Ave #103 Davie, FL | 2.0 | 2.0 | 871 | $1,900 | $2.18 | 25d | 1 | 0.60mi |
| 8101 SW 24th Ct Davie, FL | 2.0 | 2.0 | 985 | $2,250 | $2.28 | 19d | 3 | 0.60mi |
| 8101 SW 24th Ct Davie, FL | 1.0–2.0 | 1.5–2.0 | 881 | $2,300 | $2.61 | 15d | 4 | 0.60mi |
| 9235 Lagoon Pl #402 Davie, FL | 2.0 | 2.0 | 1100 | $2,050 | $1.86 | 17d | 1 | 0.62mi |
| 9235 Lagoon Pl #402 Davie, FL | 2.0 | 2.0 | 1100 | $2,050 | $1.86 | 6d | 1 | 0.62mi |
| 9230 Lagoon Pl #411 Davie, FL | 2.0 | 2.0 | 970 | $1,950 | $2.01 | 25d | 1 | 0.62mi |
| 9230 Lagoon Pl #411 Davie, FL | 2.0 | 2.0 | 970 | $1,950 | $2.01 | 8d | 1 | 0.62mi |
| 2471 SW 82nd Ave Davie, FL | 2.0 | 2.0 | 879 | $1,850 | $2.10 | 21d | 1 | 0.63mi |
| 9420 Poinciana Pl #409 Davie, FL | 2.0 | 2.0 | 970 | $1,890 | $1.95 | 2d | 1 | 0.63mi |
| 2430 SW 81st Ave #408 Davie, FL | 2.0 | 2.0 | 1021 | $2,100 | $2.06 | 3d | 1 | 0.64mi |
| 2430 SW 81st Ave #305 Davie, FL | 1.0 | 1.5 | 741 | $1,700 | $2.29 | 25d | 1 | 0.64mi |
| 1301 SW 80th Ter Plantation, FL | 1.0–3.0 | 1.0–2.0 | 1061 | $3,394 | $3.20 | 3d | 10 | 0.64mi |
| 2495 SW 82nd Ave #304 Davie, FL | 1.0 | 1.5 | 727 | $1,600 | $2.20 | 8d | 1 | 0.66mi |
| 1650 SW 78th Ave Plantation, FL | 1.0–3.0 | 1.0–2.0 | 1040 | $2,664 | $2.56 | 3d | 33 | 0.68mi |
| 9410 Poinciana Pl #206 Davie, FL | 2.0 | 2.0 | 1100 | $2,100 | $1.91 | 25d | 1 | 0.70mi |
| 9460 Tangerine Pl Davie, FL | 3.0 | 2.0 | 1100 | $3,000 | $2.73 | 25d | 1 | 0.70mi |
| 9460 Tangerine Pl Davie, FL | 2.0–3.0 | 2.0 | 935 | $2,080 | $2.22 | 4d | 2 | 0.70mi |
| 9460 Tangerine Pl Davie, FL | 1.0–3.0 | 1.0–2.0 | 865 | $2,400 | $2.77 | 3d | 3 | 0.70mi |
| 9460 Tangerine Pl Davie, FL | 2.0–3.0 | 2.0 | 935 | $2,100 | $2.25 | 22d | 2 | 0.70mi |
| 9480 Poinciana Pl #407 Davie, FL | 2.0 | 2.0 | 1100 | $2,100 | $1.91 | 25d | 1 | 0.72mi |
| 9480 Poinciana Pl #407 Davie, FL | 2.0 | 2.0 | 1100 | $2,100 | $1.91 | 3d | 1 | 0.72mi |
| 9440 Poinciana Pl Davie, FL | 1.0–2.0 | 1.0–2.0 | 985 | $2,220 | $2.25 | 25d | 2 | 0.72mi |
| 9340 Lagoon Pl Davie, FL | 1.0–2.0 | 1.5–2.0 | 955 | $2,200 | $2.30 | 8d | 2 | 0.73mi |
| 2500 SW 81st Ave #401 Davie, FL | 2.0 | 2.0 | 1021 | $1,795 | $1.76 | 25d | 1 | 0.73mi |
| 9440 Poinciana Pl #404 Davie, FL | 2.0 | 2.0 | 1100 | $2,220 | $2.02 | 15d | 1 | 0.73mi |
| 9480 Tangerine Pl #404 Davie, FL | 2.0 | 2.0 | 1000 | $2,390 | $2.39 | 19d | 1 | 0.73mi |
| 9440 Tangerine Pl Davie, FL | 1.0 | 1.0 | 850 | $1,900 | $2.24 | 6d | 2 | 0.77mi |
| 9440 Tangerine Pl Davie, FL | 1.0 | 1.0 | 850 | $1,925 | $2.26 | 25d | 2 | 0.77mi |
| 2571 SW 79th Ave Davie, FL | 1.0 | 1.0 | 609 | $1,771 | $2.91 | 2d | 4 | 0.77mi |
HOA detail
- Monthly dues
- $149 · $1,788/yr
Listing history 5 events
-
2026-05-09status Pending
-
2026-04-16$149,900 Active
-
2003-04-30soldstatus $49,000
-
1993-02-18soldstatus $25,000
-
1993-02-18soldstatus $29,160
ⓘ Source: listings_history table (triggers on properties + properties_extension) + one-shot
backfill from property_details.listing_events for pre-trigger history.
Tax reassessment forecast FL · Resets to sale price
- Current annual tax
- $1,144 · $95/mo
- Projected year-2 tax
- $1,244 · $104/mo
- Expected delta
- +$100/yr (+$8/mo · 8.7%)
ⓘ Screening estimate from a state-policy table — verify with the county assessor before closing.
Climate risk First Street
- Flood 1/10 Low FEMA zone X (shaded) · 0% chance over 30 yrs
- Wildfire 1/10 Low
- Heat 10/10 Extreme 7 d/yr ≥105°F today · 27 d/yr by 30 yrs out
- Wind 10/10 Extreme 99% chance of damaging wind over 30 yrs
- Air quality 3/10 Moderate 2 unhealthy d/yr today · 3 by 30 yrs out
Nearby sold comps map
Loading sold comps map…
Walkable amenities ~0.75 mi
Loading nearby amenities…
Taxation est. · year 1
- Rental income
- $26,077
- − Mortgage interest
- −$8,397
- − Property taxes
- −$1,144
- − Insurance
- −$750
- − Repairs & maintenance
- −$2,086
- − Management
- −$2,086
- − HOA
- −$1,788
- − Depreciation
- −$4,361
- Taxable income
- $5,465
- Est. tax owed @ 24.0%
- −$1,312
- After-tax cash flow
- $6,174/yr
For passive investors: Depreciation is non-cash, so a rental often shows a tax loss while cash-flowing — sheltering income. Rental losses are passive: they offset passive income freely, and up to $25,000/yr can offset ordinary (W-2) income if you actively participate and your MAGI is under $100k (phasing out to $0 by $150k); unused losses carry forward. On sale, claimed depreciation is recaptured at up to 25%, and gains may owe capital-gains tax (a 1031 exchange can defer both). Figures are a year-1 estimate at your 24.0% rate — not tax advice; consult a CPA.
Schools (NCES district)
- District
- Broward
- NCES district ID
- 1200180
- Math proficiency
- 42% ▼ -18.00%
- Reading proficiency
- 53% ▼ -5.00%
- Median HH income
- $52,139
- Composite
- 40.88/100
- National rank
- #3621
- State rank
- #46 of 73 in FL
Livability — Davie
- Score
- 82/100
- State rank
- #68
- US rank
- #1159
Category grades
Schools grade is shown separately in the Schools card above.
Census & demographics
- Census place
- Davie, FL
- County
- Broward County · 1,963,430 people
- City population
- 92,317
- Metro
- Miami-Fort Lauderdale-Pompano Beach, FL
- Population (ZIP)
- 50,151
- Household income
- $85,000
- Rent vs Own
- Severe rent burden
- 2923.0
Population outlook (Broward County) Hauer SSP2
- Today (2025)
- 2,207,033 people
- By 2030
- 2,360,704 · +7.0%
- By 2040
- 2,661,208 · +20.6%
- By 2050
- 2,946,698 · +33.5%
- By 2075
- 3,602,273 · +63.2%
- By 2100
- 3,970,984 · +79.9%
Race, ethnicity, and origin ACS 2023
- Neighborhood character
- Diverse neighborhood (Simpson 0.69)
- Race & ethnicity
- White 42% Hispanic / Latino 31% Two or more races 20% Black 16% Asian 6%
- Hispanic origin (detail)
- Mexican 2% Puerto Rican 5% Cuban 4% Dominican 2%
- Common ancestry
- Romanian 3% Italian 3% Hispanic 3%
- Foreign-born
- 31% · Canada, Jamaica, China
- Languages at home
- 60% English-only · Spanish 26% Other Indo-European 4% French/Haitian/Cajun 3%
Political lean MEDSL · Broward
- 2024 margin
- D (+17.0) · D 58.0% · R 41.0%
- 2008→2024 swing
- -17.8pp toward R · 2008: 34.7pp · 2024: 17.0pp
- All cycles
- 2024: D+17.0 2020: D+29.8 2016: D+35.0 2012: D+34.9 2008: D+34.7
Not yet ingested
- Civics
- —
Market trends
- HPI YoY
- ▼ -160.16%
- Current HPI
- 317.8685
- Rent YoY
- ▲ 1.23%
- Metro
- Miami-Fort Lauderdale-Pompano Beach, FL
- State GDP YoY
- ▲ 3.28%
- F500 in state
- 36
Industry mix (Fortune 500 HQ in FL)
| Industry | F500 HQs | Revenue |
|---|---|---|
| Industrial Technology | 2 | $29B |
|
||
| Insurance | 2 | $17B |
|
||
| Retail | 1 | $60B |
|
||
| Technology Distribution | 1 | $58B |
|
||
| Homebuilding | 1 | $35B |
|
||
| Technology Manufacturing | 1 | $35B |
|
||
Price history
+499.6% since first listed5 events — show timeline
- 2026-05-09 Pending — Beaches MLS
- 2026-04-16 Listed $149,900 Beaches MLS
- 2003-04-30 Sold (Public Records) $49,000 Public Records
- 1993-02-18 Sold (Public Records) $29,160 Public Records
- 1993-02-18 Sold (Public Records) $25,000 Public Records
Property tax history
+0.7%/yrLatest (2025): $1,144 · +2.9% YoY. Source: county tax records.
Cash-flow waterfall
monthlySold comps — $/sqft
last 12 mo · ≤1 miLoading sold comps…