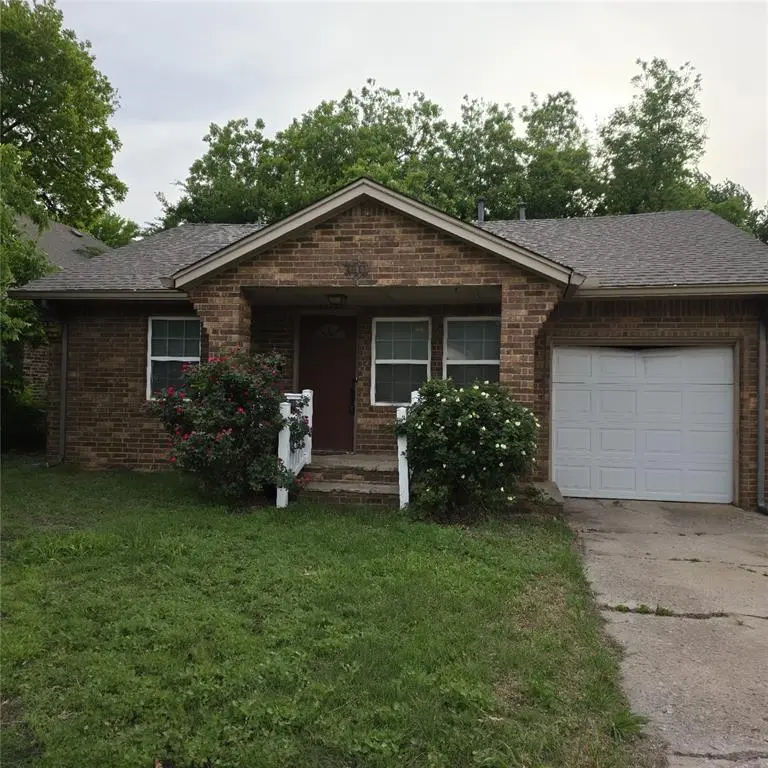
4811 N Asbury Ave · Bethany, OK
Flood risk 1/10 · Minimal
- FEMA flood zone
- X (unshaded)
- Chance of flooding over 30 yrs
- 0.0%
- Est. flood insurance / yr
- $507 – $1,088
Fire risk 3/10 · Minor
- Est. fire insurance / yr
- $2,463 – $4,575
Heat risk 5/10 · Moderate
- Hot days now (above 107°F)
- 7 days/yr
- Hot days in 30 yrs
- 19 days/yr
Wind risk 2/10 · Minimal
- Chance of severe wind over 30 yrs
- 2.0%
Air-quality risk 2/10 · Minimal
- Unhealthy air days now
- 1 days/yr
- Unhealthy air days in 30 yrs
- 2 days/yr
Risk factors via First Street. Map © Google.
Why this score? — see what drove the C- grade
The composite is a weighted blend of 9 inputs, each scored 0–100. Each bar is that input's sub-score; the figure is the points it added to the 100-point composite (weight × sub-score).
- ARV discount +14.3/15.0
- Cash flow +14.1/30.0
- DSCR +4.3/10.0
- Rent growth +4.2/5.0
- Schools +3.8/10.0
- Livability +3.7/5.0
- 1% rule +3.6/10.0
- Condition / age +2.5/5.0
- Appreciation +0.0/10.0
$159,000
🖨 Deal sheet (PDF) 📄 Offer letter ✓ Due diligence
Listing remarks
Looking for your next project in the highly sought-after Bethany school district? This one is full of potential and ready for someone with vision to bring it back to life. Whether you’re dreaming of a full renovation, a fresh start, or an investment opportunity, this property gives you the chance to create something truly your own in a location that’s hard to find. The roof is approximately 4–5 years old, and the hot water tank was replaced in 2018, giving you a solid starting point as you plan your updates. Being sold as-is,
Key facts
- Full renovation
- 8,198 sq ft lot
- Garage
Tags
Property features AI
Finance
- Other: Property listed as residential single family; Homestead not indicated; Living area reported as 1,257 (assessor)
- Financial info: Not assumable
- HOA & community: No mandatory association dues
Exterior
- Parking: 1-car garage
- Utilities: Manual geocode source
- Home design: Single-family residence; One-story; East-facing; Existing property
- Construction: Brick and frame construction; Composition roof; Conventional foundation; Built status: existing
- Exterior features: Covered porch; Interior lot
Interior
- Bedrooms: 3 bedrooms (single-level home)
- Bathrooms: 2 full bathrooms
- Heating & cooling: Electric heating
- Interior features: Two living areas; No fireplace
Neighborhood map
What this means for you Summary
Snapshot
- This is a 3-bed/1.0-bath single-family listed at $159k.
Deal economics
- At list price, monthly cash flow is $24 ($289/yr) — positive.
- The deal already cash-flows at list — no discount required.
- To meet the 1% rule (rent ≥ 1% of price), the offer needs to be $136k (14.4% below list).
- Recommended offer: $136k (14.4% below list) — sets the bar for 1% rule.
- Cap rate 6.5% vs local median 4.5% in Bethany — top-decile yield for the area; either an underpriced asset or a hidden risk that comps aren't pricing in. Stress-test before assuming the spread holds.
Location & tenants
- Location reads 73/100 on livability (#18 in OK) — a middle-class / working-renter tenant base. Strengths: cost of living A+, housing A+, health & safety A-; Watch: employment C-, amenities F, commute F.
- Bethany (suburban): math 46% / reading 45% proficiency, ranked #7 of 270 in OK (top 3%) — families likely to look elsewhere, expect single-tenant / working-renter base with shorter leases.
- Zoned schools: Earl Harris Es (math 50% / reading 54%, grade C-, #34 of 845 statewide, top 5%, 761 students, 0% FRL); Bethany Ms (math 47% / reading 38%, grade D-, #3 of 345 statewide, top 1%, 390 students, 0% FRL); Bethany Hs (math 32% / reading 42%, grade F, #42 of 447 statewide, top 10%, 528 students, 0% FRL) — zoned schools average 0% FRL vs 35% district-wide (35 pts lower); this property's tenant base skews higher-income than the district average.
- Market conditions: Rents rising fast (+6.9%/yr); 75 active listings in the ZIP; 38 comparable units currently listed for rent nearby; rentals at typical pace (median 17d on market — plan ~3-4 weeks tenant-placement turnaround); 5,365 units permitted in Oklahoma County in 2024 (569 in 5+ unit buildings).
Forward outlook
- Local home prices are declining (-3.0%/yr); year-one equity from $1k of loan paydown is wiped out by about $5k of value loss. Plan a longer hold.
- Oklahoma County population projected at +41% by 2050 — long-run rental-demand tailwind backs the buy-and-hold thesis.
Negotiation context
- It's been on market 18 days — a 2% lower offer ($157k) is reasonable based on typical stale-listing flexibility.
- Current owner paid $115k; 38% above their basis — modest negotiation headroom, anchor on the comps not their cost.
Risks & watch-outs
- Watch-outs: built in 1949 — expect roof / HVAC / electrical / plumbing capex.
- Climate carrying-cost: extreme-heat days projected 7→19/yr by 2055 (HVAC capex compounding) — expect insurance premiums to compound above CPI over the hold.
Questions for the listing agent
- Built in 1949 — when were the roof, HVAC, electrical panel, plumbing, and water heater last replaced?
- Is there a deadline driving the sale (1031 exchange, divorce, estate, relocation)? That informs how much negotiation room exists.
- Schools are D-rated, which usually means shorter tenancies and higher turnover. Who's the typical renter profile here, and what's been the actual vacancy rate?
- What's the average days-on-market for RENTAL listings here right now (not sales)? A rising rental-DOM trend means longer vacancies and softer asking-rent achievability than the comps imply.
- What's the recent tenant-quality profile in this submarket — average credit score on applications, eviction rate, late-payment / NSF rate, and stable-employment percentage? A property-management company in the area should have these aggregated.
- How much new for-sale + rental construction is in the pipeline within 1–3 miles? Heavy new supply typically softens prices + rents 12–24 months out; constrained supply supports both.
Investment metrics
- 1% rule
- 0.86% ✗
- Cap rate
- 6.47%
- Cash-on-cash
- 0.65%
- DSCR
- 1.03
- GRM
- 9.7
CMA / ARV
- ARV (on-the-fly)
- $187,293
- Comps found
- 12
Show comp detail 12 sales within ~0.75 mi
| Address | Dist | Beds/Ba | Sqft | Sold | Price | $/sf | Match |
|---|---|---|---|---|---|---|---|
| 4811 N Asbury Ave | 0.00mi | 3/2.0 | 1,257 (0%) | 1mo | $145,000 | $115 | 95 |
| 6810 NW 50th St | 0.17mi | 3/2.0 | 1,288 (+2%) | 8mo | $193,900 | $151 | 77 |
| 4602 N Redmond Ave | 0.36mi | 3/2.0 | 1,288 (+2%) | 2mo | $192,000 | $149 | 73 |
| 4507 N Donald Ave | 0.30mi | 2/2.0 (-1) | 1,218 (-3%) | 8mo | $215,000 | $177 | 65 |
| 5007 N Central Rd | 0.12mi | 3/2.0 | 1,080 (-14%) | 4mo | $181,000 | $168 | 63 |
| 6812 NW 46th St | 0.17mi | 3/2.0 | 1,402 (+12%) | 11mo | $165,000 | $118 | 60 |
| 6811 NW 43rd St | 0.30mi | 3/2.0 | 1,385 (+10%) | 7mo | $240,500 | $174 | 60 |
| 6013 NW 55th St | 0.61mi | 4/1.0 (+1) | 1,287 (+2%) | 7mo | $178,000 | $138 | 57 |
| 4308 N Redmond Ave | 0.45mi | 3/1.5 | 1,166 (-7%) | 10mo | $159,500 | $137 | 57 |
| 6906 NW 43rd St | 0.35mi | 3/2.0 | 1,400 (+11%) | 5mo | $240,000 | $171 | 56 |
| 5924 N College St | 0.74mi | 3/1.5 | 1,114 (-11%) | 3mo | $112,000 | $101 | 42 |
| 6804 NW 59th St | 0.74mi | 4/1.0 (+1) | 1,354 (+8%) | 8mo | $165,000 | $122 | 41 |
Match score weights: distance 35% · size 25% · config 20% · recency 20%. Top-matched comps best support the ARV.
Projected returns pro-forma
-3.0% appreciation · 6.93% rent growth · sell at horizon
- IRR
- -11.1%
- Equity multiple
- 0.58×
- Total profit
- $-18,647
- Equity at exit
- $23,707
- IRR
- 2.8%
- Equity multiple
- 1.24×
- Total profit
- $10,588
- Equity at exit
- $13,747
Cash invested: $44,520 (down + closing). Projections, not guarantees.
Landlord ↔ Tenant lean methodology
- Overall (STATE)
- 83 Strongly Landlord-Friendly
- State Oklahoma
- 83 Strongly Landlord-Friendly · R+20
- County
- — inherits STATE
- City
- — inherits STATE
ZIP-level market 73008
- Rents YoY
- 6.9%
- Active inventory
- 75
- Price-to-rent
- 9.7×
Monthly cashflow live
- Estimated rent
- $1,361 high interval (Pro) →
- Mortgage (P&I)
- −$834
- Tax from tax record
- −$151 /mo · $1,808/yr
- Insurance
- −$66
- HOA
- −$0
- Vacancy / Maint / Mgmt
- −$286
- Net cashflow
- $24
Break-even live
Sensitivity live
| Price | -10% $114 | -5% $69 | +0% $24 | +5% $-21 | +10% $-66 |
|---|---|---|---|---|---|
| Rent | -10% $-83 | -5% $-30 | +0% $24 | +5% $78 | +10% $132 |
| Rate | -1.0pp $104 | -0.5pp $65 | base $24 | +0.5pp $-17 | +1.0pp $-59 |
UW: 25.0% down · 7.5% · 30yr · 1.5% tax · 5.0% vac · 8.0% maint · 8.0% mgmt
Financing live
Cash to close
- Down payment
- $39,750
- Closing costs
- $4,770
- Reserves months
- —
- Total cash needed
- —
Loan-product check · same deal, 3 products live
Conventional
25% down · 7.5% · 30yr
- Down + closing
- —
- Monthly P&I
- —
- Monthly cashflow
- —
- DSCR
- —
- Eligible?
- —
Personal DTI + credit; lowest rate.
DSCR
20% down · 8.5% · 30yr
- Down + closing
- —
- Monthly P&I
- —
- Monthly cashflow
- —
- DSCR
- —
- Eligible?
- —
No personal income docs; deal must DSCR.
Hard money
10% down · 12.0% · 12mo
- Down + closing
- —
- Monthly P&I
- —
- Monthly cashflow
- —
- DSCR
- —
- Eligible?
- —
Short-term bridge; refi at stabilization.
Rent comps 38 comps
| Address | Beds | Baths | Sqft | Rent | $/sqft | DOM | Units | Dist |
|---|---|---|---|---|---|---|---|---|
| 7001 NW 45th St Bethany, OK | 2.0 | 1.0 | 1006 | $1,175 | $1.17 | 4d | 1 | 0.25mi |
| 5212 Oakwood Villas Ct Bethany, OK | 3.0 | 2.0 | 1200 | $1,350 | $1.12 | 4d | 1 | 0.26mi |
| 5111 N Dawson Dr Bethany, OK | 4.0 | 2.0 | 1451 | $1,600 | $1.10 | 25d | 1 | 0.36mi |
| 5107 N Hammond Ave Unit 5109D Warr Acres, OK | 3.0 | 2.0 | 1300 | $1,399 | $1.08 | 25d | 1 | 0.45mi |
| 5107 N Hammond Ave Unit 5103B Warr Acres, OK | 2.0 | 1.5 | 1050 | $999 | $0.95 | 25d | 1 | 0.45mi |
| 7118 NW 43rd St Bethany, OK | 3.0 | 2.0 | 914 | $1,250 | $1.37 | 6d | 1 | 0.48mi |
| 4206 N Donald Ave Bethany, OK | 3.0 | 1.5 | 1867 | $1,450 | $0.78 | 4d | 1 | 0.48mi |
| 3811 N Asbury Ave Unit B Bethany, OK | 2.0 | 1.5 | 1300 | $1,195 | $0.92 | 14d | 1 | 0.69mi |
| 6808 NW 59th St Bethany, OK | 4.0 | 2.0 | 1420 | $1,500 | $1.06 | 25d | 1 | 0.76mi |
| 6909 NW 59th St Bethany, OK | 3.0 | 1.0 | 925 | $1,365 | $1.48 | 25d | 1 | 0.80mi |
| 3803 N Redmond Ave Bethany, OK | 3.0 | 2.0 | 1260 | $2,100 | $1.67 | 3d | 1 | 0.81mi |
| 7307 NW 38th St Bethany, OK | 3.0 | 2.0 | 1200 | $1,595 | $1.33 | 25d | 1 | 0.84mi |
| 6905 NW 60th St Bethany, OK | 4.0 | 1.5 | 1331 | $1,500 | $1.13 | 4d | 1 | 0.95mi |
| 3801 Franks Way Bethany, OK | 2.0 | 2.0 | 1150 | $1,545 | $1.34 | 25d | 1 | 0.96mi |
| 5577 NW 50th St Oklahoma City, OK | 1.0–2.0 | 1.0–2.0 | 725 | $1,149 | $1.58 | 5d | 6 | 1.06mi |
| 3717 N Street Charles St Warr Acres, OK | 2.0 | 1.5 | 1047 | $1,200 | $1.15 | 25d | 1 | 1.10mi |
| 3707 N Street Charles St Unit 3717 Warr Acres, OK | 2.0 | 1.5 | 1047 | $1,200 | $1.15 | 25d | 1 | 1.11mi |
| 5901 NW 34th St Oklahoma City, OK | 1.0–2.0 | 1.0–2.0 | 925 | $1,049 | $1.13 | 4d | 28 | 1.13mi |
| 5929 NW 62nd St Oklahoma City, OK | 3.0 | 1.0 | 1103 | $1,550 | $1.41 | 4d | 1 | 1.15mi |
| 5304 Willow Cliff Rd Oklahoma City, OK | 2.0 | 2.0 | 1060 | $1,086 | $1.02 | 6d | 1 | 1.17mi |
| 5304 Willow Cliff Rd Oklahoma City, OK | 3.0 | 3.0 | 1505 | $1,330 | $0.88 | 16d | 1 | 1.17mi |
| 4401 N Ann Arbor Ave Warr Acres, OK | 3.0 | 1.0 | 1216 | $1,245 | $1.02 | 25d | 1 | 1.20mi |
| 6419 NW 63rd St Unit 1 Warr Acres, OK | 3.0 | 2.5 | 1748 | $1,425 | $0.82 | 5d | 1 | 1.20mi |
| 6100-6114 NW 32nd St Unit 224 Bethany, OK | 2.0 | 1.0 | 895 | $825 | $0.92 | 25d | 1 | 1.21mi |
| 6100-6114 NW 32nd St Unit 117 Bethany, OK | 2.0 | 1.5 | 955 | $935 | $0.98 | 16d | 1 | 1.21mi |
| 6100-6114 NW 32nd St Unit 124 Bethany, OK | 2.0 | 1.0 | 895 | $790 | $0.88 | 25d | 1 | 1.22mi |
| 6100-6114 NW 32nd St Unit 129 Bethany, OK | 2.0 | 1.0 | 895 | $725 | $0.81 | 25d | 1 | 1.22mi |
| 5811 NW 34th St Oklahoma City, OK | 1.0–2.0 | 1.0 | 875 | $925 | $1.06 | 25d | 1 | 1.22mi |
| 6618 NW 31st St Bethany, OK | 2.0 | 1.0 | 1005 | $1,200 | $1.19 | 4d | 1 | 1.23mi |
| 5633 Norman Rd Warr Acres, OK | 3.0 | 2.0 | 1225 | $1,375 | $1.12 | 4d | 1 | 1.25mi |
| 6103 NW 63rd St Oklahoma City, OK | 3.0 | 2.0 | 1300 | $1,325 | $1.02 | 4d | 1 | 1.33mi |
| 6916 Woodlake Dr Unit 6920 Oklahoma City, OK | 3.0 | 2.0 | 1430 | $1,300 | $0.91 | 19d | 1 | 1.35mi |
| 6803 Woodlake Dr Oklahoma City, OK | 2.0 | 2.0 | 977 | $1,150 | $1.18 | 25d | 1 | 1.38mi |
| 6605 Lyrewood Ln Oklahoma City, OK | 2.0 | 2.0 | 1224 | $1,100 | $0.90 | 25d | 1 | 1.39mi |
| 7024 Woodlake Dr Oklahoma City, OK | 3.0 | 2.0 | 1200 | $1,450 | $1.21 | 19d | 1 | 1.40mi |
| 6715 Lyrewood Ln Oklahoma City, OK | 3.0 | 2.0 | 1309 | $1,495 | $1.14 | 6d | 1 | 1.44mi |
| 6713 Lyrewood Ln Oklahoma City, OK | 3.0 | 2.0 | 1309 | $1,395 | $1.07 | 6d | 1 | 1.44mi |
| 4608 N Libby Ave Warr Acres, OK | 4.0 | 2.0 | 1290 | $1,595 | $1.24 | 4d | 1 | 1.48mi |
Listing history 5 events
-
2026-05-20status Pending
-
2026-04-30$159,000 Active
-
2026-02-23soldstatus $115,000
-
1999-06-02soldstatus $45,000
-
1989-09-06soldstatus $24,000
ⓘ Source: listings_history table (triggers on properties + properties_extension) + one-shot
backfill from property_details.listing_events for pre-trigger history.
Tax reassessment forecast OK · Resets to sale price
- Current annual tax
- $1,808 · $151/mo
- Projected year-2 tax
- $1,808 · $151/mo
- Expected delta
- $0/yr ($0/mo · 0.0%)
ⓘ Screening estimate from a state-policy table — verify with the county assessor before closing.
Climate risk First Street
- Flood 1/10 Low FEMA zone X (unshaded) · 0% chance over 30 yrs
- Wildfire 3/10 Moderate
- Heat 5/10 Major 7 d/yr ≥107°F today · 19 d/yr by 30 yrs out
- Wind 2/10 Low 2% chance of damaging wind over 30 yrs
- Air quality 2/10 Low 1 unhealthy d/yr today · 2 by 30 yrs out
Nearby sold comps map
Loading sold comps map…
Walkable amenities ~0.75 mi
Loading nearby amenities…
Taxation est. · year 1
- Rental income
- $16,327
- − Mortgage interest
- −$8,906
- − Property taxes
- −$1,808
- − Insurance
- −$795
- − Repairs & maintenance
- −$1,306
- − Management
- −$1,306
- − Depreciation
- −$4,625
- Taxable loss
- −$2,421
- Est. tax savings @ 24.0%
- +$581
- After-tax cash flow
- $870/yr
For passive investors: Depreciation is non-cash, so a rental often shows a tax loss while cash-flowing — sheltering income. Rental losses are passive: they offset passive income freely, and up to $25,000/yr can offset ordinary (W-2) income if you actively participate and your MAGI is under $100k (phasing out to $0 by $150k); unused losses carry forward. On sale, claimed depreciation is recaptured at up to 25%, and gains may owe capital-gains tax (a 1031 exchange can defer both). Figures are a year-1 estimate at your 24.0% rate — not tax advice; consult a CPA.
Schools (NCES district)
- District
- Bethany
- NCES district ID
- 4004110
- Math proficiency
- 46% ▼ -13.00%
- Reading proficiency
- 45% ▼ -6.00%
- Median HH income
- $35,971
- Composite
- 37.72/100
- National rank
- #4356
- State rank
- #7 of 270 in OK
Livability — Bethany
- Score
- 73/100
- State rank
- #18
- US rank
- #5466
Category grades
Schools grade is shown separately in the Schools card above.
Census & demographics
- Census place
- Bethany, OK
- County
- Oklahoma County · 771,644 people
- City population
- 21,472
- Metro
- Oklahoma City, OK
- Population (ZIP)
- 21,472
- Household income
- $57,459
- Rent vs Own
- Severe rent burden
- 892.0
Population outlook (Oklahoma County) Hauer SSP2
- Today (2025)
- 911,875 people
- By 2030
- 982,413 · +7.7%
- By 2040
- 1,130,468 · +24.0%
- By 2050
- 1,288,422 · +41.3%
- By 2075
- 1,711,482 · +87.7%
- By 2100
- 2,088,448 · +129.0%
Race, ethnicity, and origin ACS 2023
- Neighborhood character
- Diverse neighborhood (Simpson 0.62)
- Race & ethnicity
- White 57% Hispanic / Latino 21% Two or more races 14% Black 11% Native American 4%
- Hispanic origin (detail)
- Mexican 19%
- Common ancestry
- Italian 4% Iranian 2% Slovak 2%
- Foreign-born
- 9% · Canada, Vietnam
- Languages at home
- 81% English-only · Spanish 17% French/Haitian/Cajun 1% Vietnamese 1%
Political lean MEDSL · Oklahoma
- 2024 margin
- Toss-up / Even · D 48.0% · R 49.7% · Other 2.3%
- 2008→2024 swing
- +15.1pp toward D · 2008: -16.8pp · 2024: -1.7pp
- All cycles
- 2024: R+1.7 2020: R+1.1 2016: R+10.5 2012: R+16.7 2008: R+16.8
Not yet ingested
- Civics
- —
Market trends
- HPI YoY
- ▼ -140.71%
- Current HPI
- 251.1185
- Rent YoY
- ▲ 6.93%
- Metro
- Oklahoma City, OK
- State GDP YoY
- ▲ 1.55%
- F500 in state
- 6
Industry mix (Fortune 500 HQ in OK)
| Industry | F500 HQs | Revenue |
|---|---|---|
| Energy | 3 | $48B |
|
||
Price history
+562.5% since first listed5 events — show timeline
- 2026-05-20 Pending — MLSOK
- 2026-04-30 Listed $159,000 MLSOK
- 2026-02-23 Sold (Public Records) $115,000 Public Records
- 1999-06-02 Sold (Public Records) $45,000 Public Records
- 1989-09-06 Sold (Public Records) $24,000 Public Records
Property tax history
+6.8%/yrLatest (2025): $1,808 · +2.9% YoY. Source: county tax records.
Cash-flow waterfall
monthlySold comps — $/sqft
last 12 mo · ≤1 miLoading sold comps…