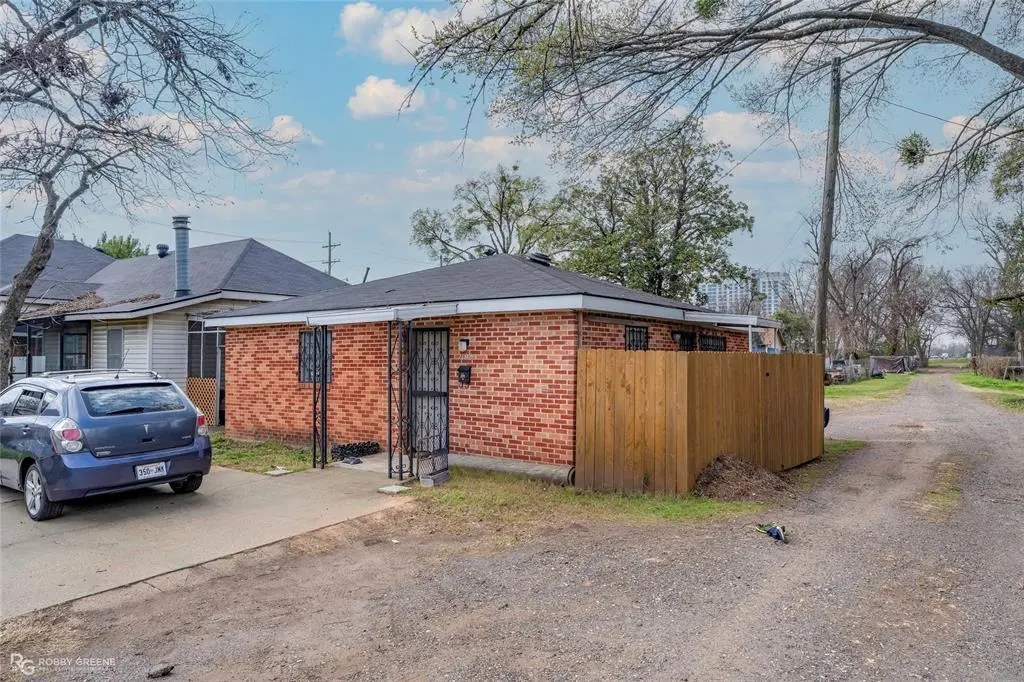
219 1/2 Colquitt St · Bossier City, LA
Flood risk 1/10 · Minimal
- FEMA flood zone
- X (unshaded)
- Chance of flooding over 30 yrs
- 0.0%
- Est. flood insurance / yr
- $507 – $1,088
Fire risk 1/10 · Minimal
- Est. fire insurance / yr
- $1,269 – $2,357
Heat risk 7/10 · Major
- Hot days now (above 110°F)
- 7 days/yr
- Hot days in 30 yrs
- 22 days/yr
Wind risk 6/10 · Moderate
- Chance of severe wind over 30 yrs
- 66.0%
Air-quality risk 2/10 · Minimal
- Unhealthy air days now
- 1 days/yr
- Unhealthy air days in 30 yrs
- 2 days/yr
Risk factors via First Street. Map © Google.
Why this score? — see what drove the B grade
The composite is a weighted blend of 9 inputs, each scored 0–100. Each bar is that input's sub-score; the figure is the points it added to the 100-point composite (weight × sub-score).
- Cash flow +30.0/30.0
- ARV discount +10.1/15.0
- DSCR +10.0/10.0
- 1% rule +9.9/10.0
- Rent growth +4.1/5.0
- Schools +3.8/10.0
- Livability +3.6/5.0
- Condition / age +2.2/5.0
- Appreciation +0.0/10.0
$68,500
🖨 Deal sheet 📄 Offer letter ✓ Due diligence
Listing remarks MLS
Investor Special in the Heart of Bossier City! Turnkey 1 bedroom, 1 bath investment opportunity located in one of the most high-demand rental corridors of Bossier City, Louisiana. Currently leased at $700 per month, this property offers immediate cash flow potential and a strong addition to any real estate portfolio. Ideally situated near Louisiana Boardwalk, area casino hotels, and Chasing Aces golf facility, this location attracts consistent rental interest from hospitality, gaming, and service industry employees. Convenient access to public transportation, major roadways, shopping, dining, and entertainment makes this an appealing option for long-term tenants. Whether you're a seasoned investor expanding your Bossier City rental portfolio or just getting started in income-producing property, this affordable investment offers steady rental income in a prime entertainment district location. Close to hotels, casinos, golf, dining, and public transit Currently rented at $700 a month Strong rental demand area Opportunities in this price range near the Boardwalk and casino district are limited. Secure your spot in one of Northwest Louisiana’s most active rental markets today.
Key facts
- 1,394 sq ft lot
- Built 1957
- Listed 76 days
Tags
Neighborhood map
What this means for you Summary
Snapshot
- This is a 1-bed/1.0-bath single-family listed at $68k. Condition is rated fair.
Deal economics
- At list price, monthly cash flow is $330 ($4k/yr) — positive.
- The deal already cash-flows at list — no discount required.
- Meets the 1% rule at list price ($1k rent vs $68k).
- Recommended offer: $64k (6.0% below list) — sets the bar for market timing.
- Cap rate 12.1% vs local median 4.7% in Bossier City — top-decile yield for the area; either an underpriced asset or a hidden risk that comps aren't pricing in. Stress-test before assuming the spread holds.
Location & tenants
- Location reads 71/100 on livability (#47 in LA) — a middle-class / working-renter tenant base. Strengths: commute A+, cost of living A+, housing A+; Watch: employment D+, crime F, amenities F.
- Bossier Parish (urban): math 40% / reading 47% proficiency, ranked #17 of 98 in LA (top 17%) — families likely to look elsewhere, expect single-tenant / working-renter base with shorter leases.
- Market conditions: Rents rising fast (+6.6%/yr); 421 active listings in the ZIP; 9 comparable units currently listed for rent nearby; rentals lingering (median 44d on market — plan ~5-8 weeks vacancy on turnover, expect pricing pressure); 56% of comp listings sitting > 30 days — soft ceiling on asking rent; 716 units permitted in Bossier Parish in 2024 (0 in 5+ unit buildings).
Forward outlook
- Local home prices are declining (-3.0%/yr); year-one equity from $474 of loan paydown is wiped out by about $2k of value loss. Plan a longer hold.
- Bossier County population projected at +28% by 2050 — long-run rental-demand tailwind backs the buy-and-hold thesis.
- At projected returns (-3.0% appreciation + 6.6% rent growth), your $19k cash investment doubles in ~5 years — after that, you're playing with house money.
Negotiation context
- It's been on market 76 days — a 6% lower offer ($64k) is reasonable based on typical stale-listing flexibility.
Risks & watch-outs
- Watch-outs: built in 1957 — expect roof / HVAC / electrical / plumbing capex.
- Climate carrying-cost: major wind risk, 66% chance of damaging wind over 30y; extreme-heat days projected 7→22/yr by 2055 (HVAC capex compounding) — expect insurance premiums to compound above CPI over the hold.
Questions for the listing agent
- It's been on market 76 days. Have you received any prior offers? Is the seller open to a 6% concession, seller financing, or rate buy-down credit?
- Have any recent inspections been done? Can we get a copy of the seller's disclosures and any deferred-maintenance estimates?
- Built in 1957 — when were the roof, HVAC, electrical panel, plumbing, and water heater last replaced?
- Why hasn't it sold? Are there any deal-killer items the seller is aware of (foundation, flood, title, zoning, code violations)?
- Is there a deadline driving the sale (1031 exchange, divorce, estate, relocation)? That informs how much negotiation room exists.
- Schools are B-rated — typically a magnet for longer-tenancy family renters. What's the average tenant stay here, and is there a school-zone premium baked into asking?
- Crime grade is F in this area — have there been break-ins, vandalism, or insurance claims at this property in the last 3 years? What carrier currently insures it and at what premium?
- What's the average days-on-market for RENTAL listings here right now (not sales)? A rising rental-DOM trend means longer vacancies and softer asking-rent achievability than the comps imply.
- What's the recent tenant-quality profile in this submarket — average credit score on applications, eviction rate, late-payment / NSF rate, and stable-employment percentage? A property-management company in the area should have these aggregated.
- How much new for-sale + rental construction is in the pipeline within 1–3 miles? Heavy new supply typically softens prices + rents 12–24 months out; constrained supply supports both.
Investment metrics
- 1% rule
- 1.49% ✓
- Cap rate
- 12.08%
- Cash-on-cash
- 20.67%
- DSCR
- 1.92
- GRM
- 5.6
CMA / ARV
- ARV (median comp)
- $72,618
- List price
- $68,500
- Delta
- -5.67%
- Verdict
- FAIR
- Comps
- 14 within 1.0 mi
Projected returns pro-forma
-3.0% appreciation · 6.56% rent growth · sell at horizon
- IRR
- 17.0%
- Equity multiple
- 1.72×
- Total profit
- $13,729
- Equity at exit
- $10,214
- IRR
- 28.0%
- Equity multiple
- 3.91×
- Total profit
- $55,774
- Equity at exit
- $5,923
Cash invested: $19,180 (down + closing). Projections, not guarantees.
Landlord ↔ Tenant lean methodology
- Overall (STATE)
- 90 Strongly Landlord-Friendly
- State Louisiana
- 90 Strongly Landlord-Friendly · R+12
- County
- — inherits STATE
- City
- — inherits STATE
ZIP-level market 71111
- Home prices YoY
- -34.8%
- Rents YoY
- 6.6%
- Active inventory
- 421
- Price-to-rent
- 5.6×
Monthly cashflow live
- Estimated rent
- $1,017 high interval (Pro) →
- Mortgage (P&I)
- −$359
- Tax est. 1.5%
- −$86 /mo · $1,028/yr
- Insurance
- −$29
- HOA
- −$0
- Vacancy / Maint / Mgmt
- −$214
- Net cashflow
- $330
Break-even live
UW: 25.0% down · 7.5% · 30yr · 1.5% tax · 5.0% vac · 8.0% maint · 8.0% mgmt
Financing live
Cash to close
- Down payment
- $17,125
- Closing costs
- $2,055
- Reserves months
- —
- Total cash needed
- —
Loan-product check · same deal, 3 products live
Conventional
25% down · 7.5% · 30yr
- Down + closing
- —
- Monthly P&I
- —
- Monthly cashflow
- —
- DSCR
- —
- Eligible?
- —
Personal DTI + credit; lowest rate.
DSCR
20% down · 8.5% · 30yr
- Down + closing
- —
- Monthly P&I
- —
- Monthly cashflow
- —
- DSCR
- —
- Eligible?
- —
No personal income docs; deal must DSCR.
Hard money
10% down · 12.0% · 12mo
- Down + closing
- —
- Monthly P&I
- —
- Monthly cashflow
- —
- DSCR
- —
- Eligible?
- —
Short-term bridge; refi at stabilization.
Rent comps 9 comps
| Address | Beds | Baths | Sqft | Rent | $/sqft | DOM | Units | Dist |
|---|---|---|---|---|---|---|---|---|
| 420 Wyche St Bossier City, LA | 1.0 | 1.0 | 800 | $500 | $0.62 | 43d | 1 | 0.21mi |
| 301 Edwards St Bossier City, LA | 2.0 | 1.0 | 900 | $1,175 | $1.31 | 21d | 1 | 0.22mi |
| 321 Edwards St Bossier City, LA | 2.0 | 1.0 | 676 | $750 | $1.11 | 43d | 1 | 0.23mi |
| 213 Kelly St Bossier City, LA | 2.0 | 1.0 | 598 | $1,300 | $2.17 | 13d | 1 | 0.39mi |
| 1820 E Texas St Bossier City, LA | 2.0 | 1.0 | 750 | $850 | $1.13 | 43d | 1 | 0.79mi |
| 719 Edwards St Shreveport, LA | 1.0–2.0 | 1.0 | 810 | $791 | $0.98 | 21d | 7 | 0.87mi |
| 624 Texas St Shreveport, LA | 2.0 | 1.5 | 953 | $1,732 | $1.82 | 13d | 2 | 1.06mi |
| 726 Cotton St Shreveport, LA | 2.0 | 1.0–2.0 | 626 | $1,065 | $1.70 | 43d | 2 | 1.15mi |
| 100 Crossroads Blvd Bossier City, LA | 1.0–2.0 | 1.0–2.0 | 858 | $1,059 | $1.23 | 43d | 1 | 1.42mi |
Listing history 15 events
-
2026-06-18days on market $68,500 Active 76 DOM
-
2026-06-17days on market $68,500 Active 75 DOM
-
2026-06-16days on market $68,500 Active 74 DOM
-
2026-06-15days on market $68,500 Active 73 DOM
-
2026-06-14days on market $68,500 Active 71 DOM
-
2026-06-13days on market $68,500 Active 70 DOM
-
2026-06-10days on market $68,500 Active 68 DOM
-
2026-06-09days on market $68,500 Active 67 DOM
-
2026-06-08days on market $68,500 Active 66 DOM
-
2026-06-07days on market $68,500 Active 65 DOM
-
2026-06-02days on market $68,500 Active 60 DOM
-
2026-06-01days on market $68,500 Active 59 DOM
-
2026-05-31days on market $68,500 Active 58 DOM
-
2026-05-30days on market $68,500 Active 57 DOM
-
2026-04-02$68,500 Active 1197-char remark
Show marketing remark (1197 chars)
Investor Special in the Heart of Bossier City! Turnkey 1 bedroom, 1 bath investment opportunity located in one of the most high-demand rental corridors of Bossier City, Louisiana. Currently leased at $700 per month, this property offers immediate cash flow potential and a strong addition to any real estate portfolio. Ideally situated near Louisiana Boardwalk, area casino hotels, and Chasing Aces golf facility, this location attracts consistent rental interest from hospitality, gaming, and service industry employees. Convenient access to public transportation, major roadways, shopping, dining, and entertainment makes this an appealing option for long-term tenants. Whether you're a seasoned investor expanding your Bossier City rental portfolio or just getting started in income-producing property, this affordable investment offers steady rental income in a prime entertainment district location. Close to hotels, casinos, golf, dining, and public transit Currently rented at $700 a month Strong rental demand area Opportunities in this price range near the Boardwalk and casino district are limited. Secure your spot in one of Northwest Louisiana’s most active rental markets today.
ⓘ Source: listings_history table (triggers on properties + properties_extension) + one-shot
backfill from property_details.listing_events for pre-trigger history.
Climate risk First Street
- Flood 1/10 Low FEMA zone X (unshaded) · 0% chance over 30 yrs
- Wildfire 1/10 Low
- Heat 7/10 Severe 7 d/yr ≥110°F today · 22 d/yr by 30 yrs out
- Wind 6/10 Major 66% chance of damaging wind over 30 yrs
- Air quality 2/10 Low 1 unhealthy d/yr today · 2 by 30 yrs out
Nearby sold comps map
Loading sold comps map…
Walkable amenities ~0.75 mi
Loading nearby amenities…
Taxation est. · year 1
- Rental income
- $12,208
- − Mortgage interest
- −$3,837
- − Property taxes
- −$1,028
- − Insurance
- −$342
- − Repairs & maintenance
- −$977
- − Management
- −$977
- − Depreciation
- −$1,993
- Taxable income
- $3,055
- Est. tax owed @ 24.0%
- −$733
- After-tax cash flow
- $3,231/yr
For passive investors: Depreciation is non-cash, so a rental often shows a tax loss while cash-flowing — sheltering income. Rental losses are passive: they offset passive income freely, and up to $25,000/yr can offset ordinary (W-2) income if you actively participate and your MAGI is under $100k (phasing out to $0 by $150k); unused losses carry forward. On sale, claimed depreciation is recaptured at up to 25%, and gains may owe capital-gains tax (a 1031 exchange can defer both). Figures are a year-1 estimate at your 24.0% rate — not tax advice; consult a CPA.
Condition & rehab AI · 1 photo
This single-family home in Bossier City requires moderate repairs and maintenance to improve its curb appeal and rental value.
Repairs flagged
- Minor Driveway — Dirt and debris
- Moderate Exterior siding — Weathered and worn
Value-add opportunities
- Rental Driveway cleaning — Improves curb appeal and tenant satisfaction
- Both Landscaping — Enhances curb appeal and property value
- Both Exterior painting — Improves appearance and value
- Both HVAC inspection and maintenance — Ensures comfort and energy efficiency
Renovation cost estimate screening
| Repair item | Severity | Est. cost |
|---|---|---|
| Driveway · Dirt and debris | Minor | $500–3,000 |
| Exterior siding · Weathered and worn | Moderate | $3,000–15,000 |
| Total estimated repair cost · 2 items | $3,500–18,000 |
Value-add ROI direction
- Rental Driveway cleaning — Improves curb appeal and tenant satisfaction ↑
- Both Landscaping — Enhances curb appeal and property value ↑
- Both Exterior painting — Improves appearance and value ↑
- Both HVAC inspection and maintenance — Ensures comfort and energy efficiency ↑
ⓘ Cost ranges are severity-bucket heuristics (US national rule-of-thumb). Get contractor quotes + a written scope before underwriting a rehab budget.
Schools (NCES district)
- District
- Bossier Parish
- NCES district ID
- 2200270
- Math proficiency
- 40% ▼ -32.00%
- Reading proficiency
- 47% ▼ -28.00%
- Median HH income
- $51,326
- Composite
- 37.5/100
- National rank
- #4402
- State rank
- #17 of 98 in LA
Livability — Bossier City
- Score
- 71/100
- State rank
- #47
- US rank
- #7044
Category grades
Schools grade is shown separately in the Schools card above.
Census & demographics
- Census place
- Bossier City, LA
- County
- Bossier Parish · 98,704 people
- City population
- 91,925
- Metro
- Shreveport-Bossier City, LA
- Population (ZIP)
- 43,925
- Household income
- $65,292
- Rent vs Own
- Severe rent burden
- 1942.0
Population outlook (Bossier County) Hauer SSP2
- Today (2025)
- 143,247 people
- By 2030
- 151,802 · +6.0%
- By 2040
- 168,194 · +17.4%
- By 2050
- 183,533 · +28.1%
- By 2075
- 217,009 · +51.5%
- By 2100
- 230,091 · +60.6%
Race, ethnicity, and origin ACS 2023
- Neighborhood character
- Diverse neighborhood (Simpson 0.60)
- Race & ethnicity
- White 56% Black 29% Hispanic / Latino 9% Two or more races 8% Asian 3%
- Hispanic origin (detail)
- Mexican 5%
- Common ancestry
- Lithuanian 2% Iranian 1% Slovak 1%
- Foreign-born
- 5% · Canada, Vietnam
- Languages at home
- 90% English-only · Spanish 7% Vietnamese 1% French/Haitian/Cajun 1%
Political lean MEDSL · Bossier
- 2024 margin
- Solid R (+43.3) · D 27.7% · R 71.0% · Other 1.3%
- 2008→2024 swing
- +0.3pp no change · 2008: -43.7pp · 2024: -43.3pp
- All cycles
- 2024: R+43.3 2020: R+41.0 2016: R+45.8 2012: R+45.4 2008: R+43.7
Not yet ingested
- Civics
- —
Market trends
- HPI YoY
- ▼ -79.78%
- Current HPI
- 149.4336
- Rent YoY
- ▲ 6.56%
- Metro
- Shreveport-Bossier City, LA
- State GDP YoY
- ▲ 3.29%
- F500 in state
- 10
Industry mix (Fortune 500 HQ in LA)
| Industry | F500 HQs | Revenue |
|---|---|---|
| Telecommunications | 2 | $23B |
|
||
| Utilities | 1 | $12B |
|
||
| Wholesale / Distribution | 1 | $5B |
|
||
| Advertising | 1 | $2B |
|
||
Price history
1 event — show timeline
- 2026-04-02 Listed $68,500 NTREIS
Cash-flow waterfall
monthlySold comps — $/sqft
last 12 mo · ≤1 miLoading sold comps…