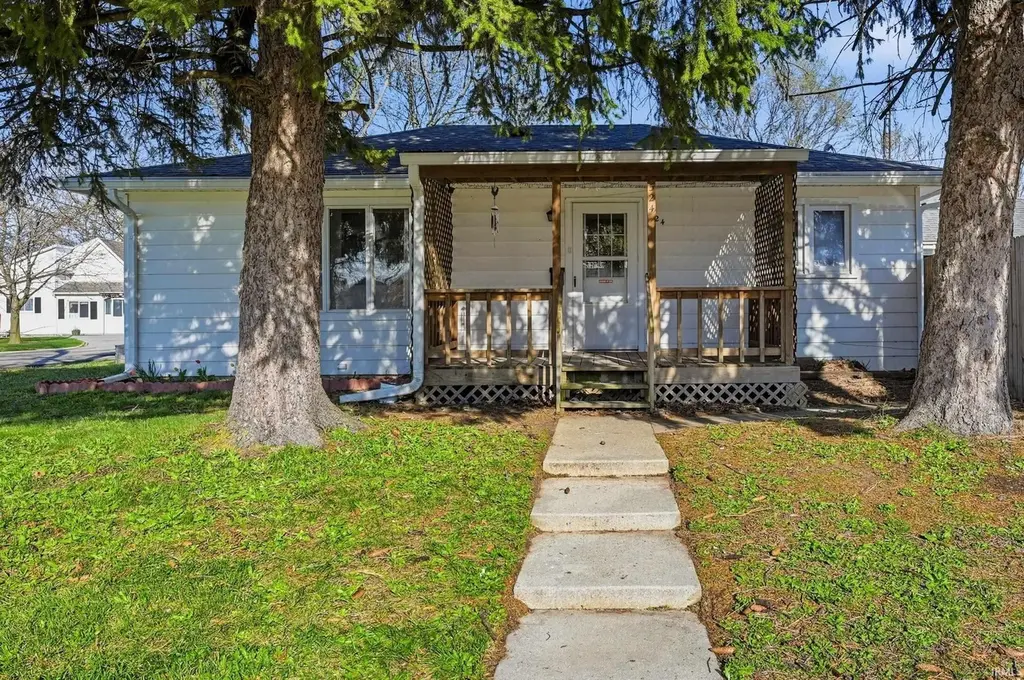
524 S Meridian St · Dunkirk, IN
Flood risk 1/10 · Minimal
- FEMA flood zone
- X (unshaded)
- Chance of flooding over 30 yrs
- 0.0%
- Est. flood insurance / yr
- $507 – $1,088
Fire risk 1/10 · Minimal
- Est. fire insurance / yr
- $717 – $1,331
Heat risk 3/10 · Minor
- Hot days now (above 99°F)
- 7 days/yr
- Hot days in 30 yrs
- 18 days/yr
Wind risk 2/10 · Minimal
- Chance of severe wind over 30 yrs
- —
Air-quality risk 3/10 · Minor
- Unhealthy air days now
- 2 days/yr
- Unhealthy air days in 30 yrs
- 4 days/yr
Risk factors via First Street. Map © Google.
Why this score? — see what drove the C+ grade
The composite is a weighted blend of 9 inputs, each scored 0–100. Each bar is that input's sub-score; the figure is the points it added to the 100-point composite (weight × sub-score).
- Cash flow +22.0/30.0
- ARV discount +10.9/15.0
- DSCR +7.0/10.0
- Appreciation +6.8/10.0
- 1% rule +4.5/10.0
- Schools +3.2/10.0
- Livability +3.2/5.0
- Rent growth +2.5/5.0
- Condition / age +2.5/5.0
$109,900
🖨 Deal sheet 📄 Offer letter ✓ Due diligence
Listing remarks MLS
Two bedroom home on a corner lot, 2 full baths, large living room, and family room. Nice covered porch. Roof 2015, gutters 2018. Privacy fenced-in yard, 10x10 gazebo that has screens to keep the bugs out. 13x8 den that could be used as a bedroom. One car attached garage + a one car carport that is all under roof to the home. Eat-in kitchen. Walking distance to Westlawn Elementary. Taxes are $0 due to exemptions. Without exemptions taxes would approximately be $831/yr.
Key facts
- 7,841 sq ft lot
- Garage
- Built 1952
Property features AI
Finance
- Other: Lot dimensions approximately 60 x 130 (about 0.18 acre)
Exterior
- Parking: Attached driveway and garage; 1 garage space
- Utilities: Public water; Public sewer; Natural gas
- Home design: Single-family, site-built home; One-story
- Construction: Aluminum siding; Shingle/asphalt roof; Slab foundation; Built in 1,250 finished square feet
- Exterior features: Covered porch; Fenced yard with full privacy wood fencing; Level lot
Interior
- Kitchen: Gas range
- Bedrooms: Total of 6 rooms (includes bedrooms and living spaces)
- Flooring: Carpet; Vinyl
- Bathrooms: 2 full bathrooms (both on the main level)
- Heating & cooling: Natural gas forced-air heating; Window air conditioning units
- Interior features: Laminate counters; Built-in features; Window treatments; Crawl space basement
- Laundry & utility: Gas dryer hookup on the main level; Gas water heater
Neighborhood map
What this means for you Summary
Snapshot
- This is a 2-bed/2.0-bath single-family listed at $110k.
Deal economics
- At list price, monthly cash flow is $175 ($2k/yr) — positive.
- The deal already cash-flows at list — no discount required.
- To meet the 1% rule (rent ≥ 1% of price), the offer needs to be $104k (5.4% below list).
- Recommended offer: $104k (5.4% below list) — sets the bar for 1% rule.
Location & tenants
- Location reads 64/100 on livability (#404 in IN) — a middle-class / working-renter tenant base. Strengths: crime A+, cost of living A+, housing A+; Watch: health & safety D, amenities F, commute F.
- Jay School Corporation (rural): math 38% / reading 37% proficiency, ranked #175 of 301 in IN (top 58%) — families likely to look elsewhere, expect single-tenant / working-renter base with shorter leases.
- Zoned schools: West Jay Elementary (math 42% / reading 32%, grade F, #550 of 994 statewide, top 57%, 249 students, 75% FRL); Jay County Jr/Sr High School (math 34% / reading 41%, grade F, #245 of 369 statewide, top 67%, 1,242 students, 50% FRL) — zoned schools average 62% FRL vs 44% district-wide (19 pts higher); higher-poverty schools than district average — tighter screening recommended.
- Market conditions: 32 active listings in the ZIP; 19 units permitted in Jay County in 2024 (0 in 5+ unit buildings).
Forward outlook
- In year one you build about $5k of equity ($760 loan paydown + $4k appreciation (3.6% local appreciation)).
- Jay County population projected at -12% by 2050 — secular population decline; favor cash flow + early exit over multi-decade hold.
- At projected returns (3.6% appreciation + 3.0% rent growth), your $31k cash investment doubles in ~5 years — after that, you're playing with house money.
- By year 7, paydown + projected appreciation supports a ~$30k cash-out refi (75% LTV) — recoverable capital for the next deal without selling this one.
Negotiation context
- It's been on market 21 days — a 2% lower offer ($108k) is reasonable based on typical stale-listing flexibility.
- 4 sale attempts since 7y ago with the ask held roughly flat each time — persistent listings suggest the price (not the market) is what's stuck; bring a comps-based counter.
- Current owner paid $45k; list at $110k implies a 145% gain — meaningful room to come down on a strong offer.
Risks & watch-outs
- Watch-outs: built in 1952 — expect roof / HVAC / electrical / plumbing capex.
Questions for the listing agent
- Built in 1952 — when were the roof, HVAC, electrical panel, plumbing, and water heater last replaced?
- Is there a deadline driving the sale (1031 exchange, divorce, estate, relocation)? That informs how much negotiation room exists.
- Schools are D-rated, which usually means shorter tenancies and higher turnover. Who's the typical renter profile here, and what's been the actual vacancy rate?
- What's the average days-on-market for RENTAL listings here right now (not sales)? A rising rental-DOM trend means longer vacancies and softer asking-rent achievability than the comps imply.
- What's the recent tenant-quality profile in this submarket — average credit score on applications, eviction rate, late-payment / NSF rate, and stable-employment percentage? A property-management company in the area should have these aggregated.
- How much new for-sale + rental construction is in the pipeline within 1–3 miles? Heavy new supply typically softens prices + rents 12–24 months out; constrained supply supports both.
Investment metrics
- 1% rule
- 0.95% ✗
- Cap rate
- 8.20%
- Cash-on-cash
- 6.81%
- DSCR
- 1.30
- GRM
- 8.8
CMA / ARV
- ARV (on-the-fly)
- $118,750
- Comps found
- 12
Show comp detail 12 sales within ~0.75 mi
| Address | Dist | Beds/Ba | Sqft | Sold | Price | $/sf | Match |
|---|---|---|---|---|---|---|---|
| 922 S Main St | 0.27mi | 2/1.0 | 1,268 (+1%) | 10mo | $55,500 | $44 | 72 |
| 201 S Meridian St | 0.22mi | 3/1.0 (+1) | 1,312 (+5%) | 5mo | $125,000 | $95 | 69 |
| 202 Shadyside St | 0.73mi | 2/1.0 | 1,224 (-2%) | 1mo | $142,500 | $116 | 58 |
| 724 S Main St | 0.17mi | 2/1.0 | 1,388 (+11%) | 14mo | $109,900 | $79 | 58 |
| 121 E Center St | 0.36mi | 2/1.0 | 1,376 (+10%) | 6mo | $103,000 | $75 | 57 |
| 218 Moore Ave | 0.33mi | 3/1.5 (+1) | 1,188 (-5%) | 17mo | $135,000 | $114 | 56 |
| 631 N Hickory St | 0.64mi | 3/2.0 (+1) | 1,274 (+2%) | 9mo | $142,000 | $111 | 54 |
| 161 Orange Ave | 0.26mi | 3/1.0 (+1) | 1,388 (+11%) | 9mo | $75,000 | $54 | 53 |
| 141 Highland Ave | 0.67mi | 2/1.0 | 1,165 (-7%) | 4mo | $104,000 | $89 | 50 |
| 434 N Main St | 0.56mi | 3/1.0 (+1) | 1,146 (-8%) | 3mo | $91,000 | $79 | 49 |
| 334 Moore Ave | 0.39mi | 3/1.5 (+1) | 1,428 (+14%) | 11mo | $168,000 | $118 | 42 |
| 235 Moore Ave | 0.36mi | 3/1.5 (+1) | 1,075 (-14%) | 14mo | $163,000 | $152 | 41 |
Match score weights: distance 35% · size 25% · config 20% · recency 20%. Top-matched comps best support the ARV.
Projected returns pro-forma
3.64% appreciation · 3.0% rent growth · sell at horizon
- IRR
- 15.4%
- Equity multiple
- 1.91×
- Total profit
- $28,069
- Equity at exit
- $53,423
- IRR
- 16.6%
- Equity multiple
- 3.59×
- Total profit
- $79,748
- Equity at exit
- $85,594
Cash invested: $30,772 (down + closing). Projections, not guarantees.
Landlord ↔ Tenant lean methodology
- Overall (STATE)
- 90 Strongly Landlord-Friendly
- State Indiana
- 90 Strongly Landlord-Friendly · R+11
- County
- — inherits STATE
- City
- — inherits STATE
ZIP-level market 47336
- Home prices YoY
- 1.6%
- Active inventory
- 32
- Price-to-rent
- 8.8×
Monthly cashflow live
- Estimated rent
- $1,040 medium interval (Pro) →
- Mortgage (P&I)
- −$576
- Tax from tax record
- −$25 /mo · $301/yr
- Insurance
- −$46
- HOA
- −$0
- Vacancy / Maint / Mgmt
- −$218
- Net cashflow
- $175
Break-even live
UW: 25.0% down · 7.5% · 30yr · 1.5% tax · 5.0% vac · 8.0% maint · 8.0% mgmt
Financing live
Cash to close
- Down payment
- $27,475
- Closing costs
- $3,297
- Reserves months
- —
- Total cash needed
- —
Loan-product check · same deal, 3 products live
Conventional
25% down · 7.5% · 30yr
- Down + closing
- —
- Monthly P&I
- —
- Monthly cashflow
- —
- DSCR
- —
- Eligible?
- —
Personal DTI + credit; lowest rate.
DSCR
20% down · 8.5% · 30yr
- Down + closing
- —
- Monthly P&I
- —
- Monthly cashflow
- —
- DSCR
- —
- Eligible?
- —
No personal income docs; deal must DSCR.
Hard money
10% down · 12.0% · 12mo
- Down + closing
- —
- Monthly P&I
- —
- Monthly cashflow
- —
- DSCR
- —
- Eligible?
- —
Short-term bridge; refi at stabilization.
Listing history 11 events
-
2026-06-04statusdays on market $109,900 Pending 21 DOM
-
2026-06-02days on market $109,900 Active 20 DOM
-
2026-06-01days on market $109,900 Active 19 DOM
-
2026-05-31days on market $109,900 Active 18 DOM
-
2026-05-31days on market $109,900 Active 17 DOM
-
2026-05-21status Active
-
2026-04-17status Pending
-
2026-04-08$109,900 Active
-
2019-10-23soldstatus $44,900 473-char remark
Show marketing remark (473 chars)
Two bedroom home on a corner lot, 2 full baths, large living room, and family room. Nice covered porch. Roof 2015, gutters 2018. Privacy fenced-in yard, 10x10 gazebo that has screens to keep the bugs out. 13x8 den that could be used as a bedroom. One car attached garage + a one car carport that is all under roof to the home. Eat-in kitchen. Walking distance to Westlawn Elementary. Taxes are $0 due to exemptions. Without exemptions taxes would approximately be $831/yr.
-
2019-08-07$44,900 473-char remark
Show marketing remark (473 chars)
Two bedroom home on a corner lot, 2 full baths, large living room, and family room. Nice covered porch. Roof 2015, gutters 2018. Privacy fenced-in yard, 10x10 gazebo that has screens to keep the bugs out. 13x8 den that could be used as a bedroom. One car attached garage + a one car carport that is all under roof to the home. Eat-in kitchen. Walking distance to Westlawn Elementary. Taxes are $0 due to exemptions. Without exemptions taxes would approximately be $831/yr.
-
2019-06-13$45,000
ⓘ Source: listings_history table (triggers on properties + properties_extension) + one-shot
backfill from property_details.listing_events for pre-trigger history.
Tax reassessment forecast IN · Partial reset (capped growth)
- Current annual tax
- $301 · $25/mo
- Projected year-2 tax
- $618 · $51/mo
- Expected delta
- +$317/yr (+$26/mo · 105.2%)
ⓘ Screening estimate from a state-policy table — verify with the county assessor before closing.
Climate risk First Street
- Flood 1/10 Low FEMA zone X (unshaded) · 0% chance over 30 yrs
- Wildfire 1/10 Low
- Heat 3/10 Moderate 7 d/yr ≥99°F today · 18 d/yr by 30 yrs out
- Wind 2/10 Low
- Air quality 3/10 Moderate 2 unhealthy d/yr today · 4 by 30 yrs out
Nearby sold comps map
Loading sold comps map…
Walkable amenities ~0.75 mi
Loading nearby amenities…
Taxation est. · year 1
- Rental income
- $12,482
- − Mortgage interest
- −$6,156
- − Property taxes
- −$301
- − Insurance
- −$550
- − Repairs & maintenance
- −$999
- − Management
- −$999
- − Depreciation
- −$3,197
- Taxable income
- $281
- Est. tax owed @ 24.0%
- −$67
- After-tax cash flow
- $2,027/yr
For passive investors: Depreciation is non-cash, so a rental often shows a tax loss while cash-flowing — sheltering income. Rental losses are passive: they offset passive income freely, and up to $25,000/yr can offset ordinary (W-2) income if you actively participate and your MAGI is under $100k (phasing out to $0 by $150k); unused losses carry forward. On sale, claimed depreciation is recaptured at up to 25%, and gains may owe capital-gains tax (a 1031 exchange can defer both). Figures are a year-1 estimate at your 24.0% rate — not tax advice; consult a CPA.
Schools (NCES district)
- District
- Jay School Corporation
- NCES district ID
- 1804980
- Math proficiency
- 38% ▼ -13.00%
- Reading proficiency
- 37% ▼ -13.00%
- Median HH income
- $40,841
- Composite
- 31.56/100
- National rank
- #5954
- State rank
- #175 of 301 in IN
Livability — Dunkirk
- Score
- 64/100
- State rank
- #404
- US rank
- #14764
Category grades
Schools grade is shown separately in the Schools card above.
Census & demographics
- Census place
- Dunkirk, IN
- Population (ZIP)
- 2,793
Population outlook (Jay County) Hauer SSP2
- Today (2025)
- 20,586 people
- By 2030
- 20,155 · -2.1%
- By 2040
- 19,274 · -6.4%
- By 2050
- 18,203 · -11.6%
- By 2075
- 15,062 · -26.8%
- By 2100
- 10,857 · -47.3%
Race, ethnicity, and origin ACS 2023
- Neighborhood character
- Predominantly White (95%)
- Race & ethnicity
- White 95% Two or more races 3% Hispanic / Latino 2%
- Common ancestry
- Italian 4% Slovak 2% Scotch-Irish 1%
- Foreign-born
- 0%
- Languages at home
- 98% English-only · Spanish 1%
Political lean MEDSL · Jay
- 2024 margin
- Solid R (+55.2) · D 21.6% · R 76.7% · Other 1.7%
- 2008→2024 swing
- -47.3pp toward R · 2008: -7.8pp · 2024: -55.2pp
- All cycles
- 2024: R+55.2 2020: R+52.4 2016: R+47.8 2012: R+20.0 2008: R+7.8
Not yet ingested
- Civics
- —
Market trends
- HPI YoY
- ▲ 3.64%
- Current HPI
- 238.768
- Rent YoY
- —
- Metro
- —
- State GDP YoY
- ▲ 2.90%
- F500 in state
- 18
Industry mix (Fortune 500 HQ in IN)
| Industry | F500 HQs | Revenue |
|---|---|---|
| Industrial Machinery | 2 | $37B |
|
||
| Healthcare | 1 | $177B |
|
||
| Pharmaceuticals | 1 | $45B |
|
||
| Metals / Steel | 1 | $18B |
|
||
| Agriculture | 1 | $17B |
|
||
| Packaging | 1 | $12B |
|
||
Price history
+144.2% since first listed6 events — show timeline
- 2026-05-21 Relisted — IRMLS
- 2026-04-17 Pending — IRMLS
- 2026-04-08 Listed $109,900 IRMLS
- 2019-10-23 Sold (MLS) $44,900 IRMLS
- 2019-08-07 Listed $44,900 IRMLS
- 2019-06-13 Listed $45,000 IRMLS
Property tax history
+1.8%/yrLatest (2024): $301 · -11.8% YoY. Source: county tax records.
Cash-flow waterfall
monthlySold comps — $/sqft
last 12 mo · ≤1 miLoading sold comps…