523 Midway Plaisance St · Detour, MI
Flood risk 1/10 · Minimal
- FEMA flood zone
- X (unshaded)
- Chance of flooding over 30 yrs
- 0.0%
- Est. flood insurance / yr
- $473 – $860
Fire risk 3/10 · Minor
- Est. fire insurance / yr
- $784 – $1,456
Heat risk 1/10 · Minimal
- Hot days now (above 88°F)
- 7 days/yr
- Hot days in 30 yrs
- 14 days/yr
Wind risk 1/10 · Minimal
- Chance of severe wind over 30 yrs
- —
Air-quality risk 2/10 · Minimal
- Unhealthy air days now
- 1 days/yr
- Unhealthy air days in 30 yrs
- 1 days/yr
Risk factors via First Street. Map © Google.
Why this score? — see what drove the B- grade
The composite is a weighted blend of 9 inputs, each scored 0–100. Each bar is that input's sub-score; the figure is the points it added to the 100-point composite (weight × sub-score).
- Cash flow +25.2/30.0
- Appreciation +10.0/10.0
- DSCR +8.3/10.0
- ARV discount +7.5/15.0
- 1% rule +6.6/10.0
- Schools +3.6/10.0
- Rent growth +2.5/5.0
- Livability +2.5/5.0
- Condition / age +2.5/5.0
$95,000
🖨 Deal sheet 📄 Offer letter ✓ Due diligence
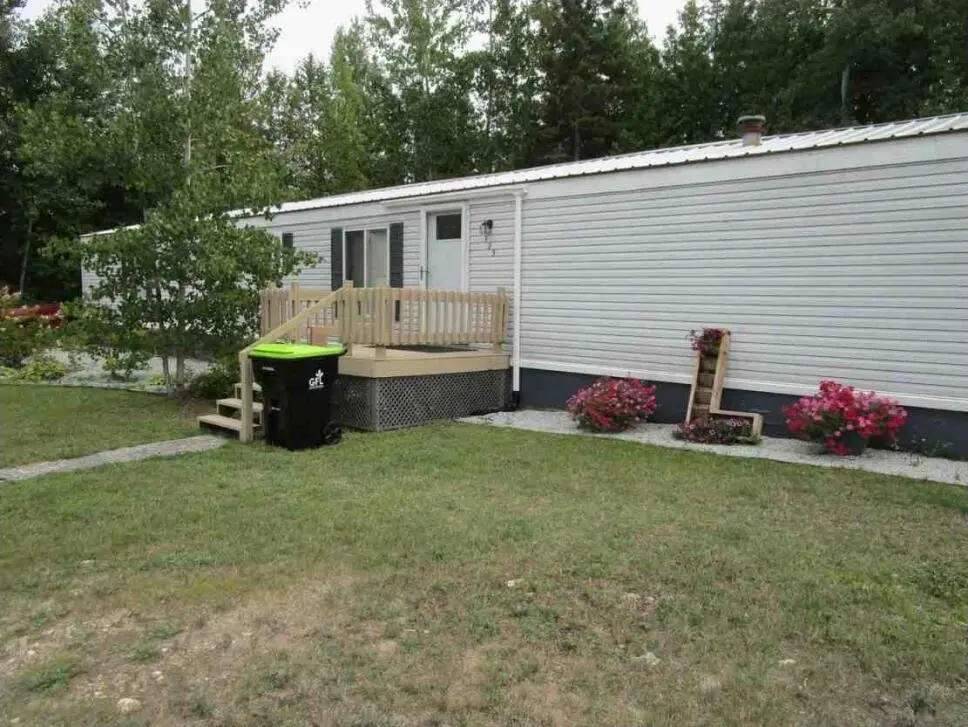
Listing remarks
THIS ALMOST COMPLETELY REMODELED HOME IS NEEDING A NEW OWNER. WITH A METAL ROOF, THREE BEDROOMS AND TWO BATHROOMS, THIS WOULD MAKE A WONDERFUL HOME TO VACATION IN OR LIVE PERMANENTLY IN. THE LOT IS A CORNER LOT WITH BACKYARD, DECK AND FIREPIT AND SHEDS. HOME is near De Tour State Harbor and all village amenities, churches, library and school!!! TURNKEY. CALL A REALTOR TO SEE!
Key facts
- Metal roof
- Firepit
- Backyard
Tags
Property features AI
Exterior
- Security: Smoke detector(s)
- Utilities: Public water; Public sewer
- Home design: Manufactured single-wide home; One level
- Construction: Vinyl siding; Crawl space foundation
- Exterior features: Corner lot; Few trees; Shed(s)
Interior
- Kitchen: Dishwasher; Electric range; Refrigerator
- Bedrooms: Main level laundry (laundry located on the main level)
- Bathrooms: 2 full bathrooms
- Interior features: Dishwasher; Electric range; Refrigerator; Fireplace: None; Smoke detector(s)
- Laundry & utility: Washer and dryer included; Laundry on the main level
Neighborhood map
What this means for you Summary
Snapshot
- This is a 3-bed/1.0-bath manufactured listed at $95k.
Deal economics
- At list price, monthly cash flow is $212 ($3k/yr) — positive.
- The deal already cash-flows at list — no discount required.
- Meets the 1% rule at list price ($1k rent vs $95k).
Location & tenants
- Location reads: area grade B — affects rentability + tenant quality, not the cash-flow math above.
- Detour Area Schools (rural): math 30% / reading 50% proficiency, ranked #383 of 760 in MI (top 50%) — families likely to look elsewhere, expect single-tenant / working-renter base with shorter leases.
- Market conditions: 26 active listings in the ZIP; 92 units permitted in Chippewa County in 2024 (40 in 5+ unit buildings).
Forward outlook
- In year one you build about $10k of equity ($657 loan paydown + $10k appreciation (10.0% local appreciation)).
- Chippewa County population projected at -10% by 2050 — secular population decline; favor cash flow + early exit over multi-decade hold.
- At projected returns (10.0% appreciation + 3.0% rent growth), your $27k cash investment doubles in ~2 years — after that, you're playing with house money.
- By year 4, paydown + projected appreciation supports a ~$36k cash-out refi (75% LTV) — recoverable capital for the next deal without selling this one.
Negotiation context
- Only 12 days on market — expect competitive offers; lowballing is unlikely to land.
- 2 sale attempts since 25y ago with the ask held roughly flat each time — persistent listings suggest the price (not the market) is what's stuck; bring a comps-based counter.
- Current owner paid $16k; list at $95k implies a 494% gain — meaningful room to come down on a strong offer.
Questions for the listing agent
- Is there a deadline driving the sale (1031 exchange, divorce, estate, relocation)? That informs how much negotiation room exists.
- What's the average days-on-market for RENTAL listings here right now (not sales)? A rising rental-DOM trend means longer vacancies and softer asking-rent achievability than the comps imply.
- What's the recent tenant-quality profile in this submarket — average credit score on applications, eviction rate, late-payment / NSF rate, and stable-employment percentage? A property-management company in the area should have these aggregated.
- How much new for-sale + rental construction is in the pipeline within 1–3 miles? Heavy new supply typically softens prices + rents 12–24 months out; constrained supply supports both.
Investment metrics
- 1% rule
- 1.16% ✓
- Cap rate
- 8.97%
- Cash-on-cash
- 9.57%
- DSCR
- 1.43
- GRM
- 7.2
CMA / ARV
No comps found within radius.
Projected returns pro-forma
10.0% appreciation · 3.0% rent growth · sell at horizon
- IRR
- 31.3%
- Equity multiple
- 3.45×
- Total profit
- $65,261
- Equity at exit
- $85,584
- IRR
- 27.0%
- Equity multiple
- 7.83×
- Total profit
- $181,595
- Equity at exit
- $184,564
Cash invested: $26,600 (down + closing). Projections, not guarantees.
Landlord ↔ Tenant lean methodology
- Overall (STATE)
- 62 Landlord-Friendly
- State Michigan
- 62 Landlord-Friendly · EVEN
- County
- — inherits STATE
- City
- — inherits STATE
ZIP-level market 49725
- Home prices YoY
- 11.9%
- Active inventory
- 26
- Price-to-rent
- 7.2×
Monthly cashflow live
- Estimated rent
- $1,099 medium interval (Pro) →
- Mortgage (P&I)
- −$498
- Tax est. 1.5%
- −$119 /mo · $1,425/yr
- Insurance
- −$40
- HOA
- −$0
- Vacancy / Maint / Mgmt
- −$231
- Net cashflow
- $212
Break-even live
UW: 25.0% down · 7.5% · 30yr · 1.5% tax · 5.0% vac · 8.0% maint · 8.0% mgmt
Financing live
Cash to close
- Down payment
- $23,750
- Closing costs
- $2,850
- Reserves months
- —
- Total cash needed
- —
Loan-product check · same deal, 3 products live
Conventional
25% down · 7.5% · 30yr
- Down + closing
- —
- Monthly P&I
- —
- Monthly cashflow
- —
- DSCR
- —
- Eligible?
- —
Personal DTI + credit; lowest rate.
DSCR
20% down · 8.5% · 30yr
- Down + closing
- —
- Monthly P&I
- —
- Monthly cashflow
- —
- DSCR
- —
- Eligible?
- —
No personal income docs; deal must DSCR.
Hard money
10% down · 12.0% · 12mo
- Down + closing
- —
- Monthly P&I
- —
- Monthly cashflow
- —
- DSCR
- —
- Eligible?
- —
Short-term bridge; refi at stabilization.
Listing history 10 events
-
2026-06-18days on market $95,000 Active 12 DOM
-
2026-06-17days on market $95,000 Active 11 DOM
-
2026-06-16days on market $95,000 Active 10 DOM
-
2026-06-15days on market $95,000 Active 9 DOM
-
2026-06-13days on market $95,000 Active 7 DOM
-
2026-06-12days on market $95,000 Active 6 DOM
-
2026-06-09days on market $95,000 Active 3 DOM
-
2026-06-08days on market $95,000 Active 2 DOM
-
2026-06-07remarks 378-char remark
-
2026-06-07$95,000 Active 1 DOM
ⓘ Source: listings_history table (triggers on properties + properties_extension) + one-shot
backfill from property_details.listing_events for pre-trigger history.
Climate risk First Street
- Flood 1/10 Low FEMA zone X (unshaded) · 0% chance over 30 yrs
- Wildfire 3/10 Moderate
- Heat 1/10 Low 7 d/yr ≥88°F today · 14 d/yr by 30 yrs out
- Wind 1/10 Low
- Air quality 2/10 Low 1 unhealthy d/yr today · 1 by 30 yrs out
Nearby sold comps map
Loading sold comps map…
Walkable amenities ~0.75 mi
Loading nearby amenities…
Taxation est. · year 1
- Rental income
- $13,193
- − Mortgage interest
- −$5,321
- − Property taxes
- −$1,425
- − Insurance
- −$475
- − Repairs & maintenance
- −$1,055
- − Management
- −$1,055
- − Depreciation
- −$2,764
- Taxable income
- $1,097
- Est. tax owed @ 24.0%
- −$263
- After-tax cash flow
- $2,281/yr
For passive investors: Depreciation is non-cash, so a rental often shows a tax loss while cash-flowing — sheltering income. Rental losses are passive: they offset passive income freely, and up to $25,000/yr can offset ordinary (W-2) income if you actively participate and your MAGI is under $100k (phasing out to $0 by $150k); unused losses carry forward. On sale, claimed depreciation is recaptured at up to 25%, and gains may owe capital-gains tax (a 1031 exchange can defer both). Figures are a year-1 estimate at your 24.0% rate — not tax advice; consult a CPA.
Schools (NCES district)
- District
- Detour Area Schools
- NCES district ID
- 2611970
- Math proficiency
- 30% ▲ 19.00%
- Reading proficiency
- 50% ▲ 30.00%
- Median HH income
- $40,111
- Composite
- 35.94/100
- National rank
- #9562
- State rank
- #383 of 760 in MI
Livability — Detour
No livability data for this city. (Only ~50 U.S. cities are tracked.)
Census & demographics
- Census place
- De Tour Village, MI
- Population (ZIP)
- 580
Population outlook (Chippewa County) Hauer SSP2
- Today (2025)
- 37,043 people
- By 2030
- 36,431 · -1.7%
- By 2040
- 34,911 · -5.8%
- By 2050
- 33,350 · -10.0%
- By 2075
- 29,789 · -19.6%
- By 2100
- 24,171 · -34.7%
Race, ethnicity, and origin ACS 2023
- Neighborhood character
- Predominantly White (84%)
- Race & ethnicity
- White 84% Native American 9% Two or more races 6%
- Common ancestry
- Romanian 9% Lithuanian 7% Slovak 4%
- Foreign-born
- 1% · Vietnam
- Languages at home
- 98% English-only · Spanish 1%
Political lean MEDSL · Chippewa
- 2024 margin
- Strong R (+24.2) · D 37.0% · R 61.3% · Other 1.7%
- 2008→2024 swing
- -23.8pp toward R · 2008: -0.5pp · 2024: -24.2pp
- All cycles
- 2024: R+24.2 2020: R+22.9 2016: R+24.2 2012: R+7.6 2008: R+0.5
Not yet ingested
- Civics
- —
Market trends
- HPI YoY
- ▲ 14.30%
- Current HPI
- 134.53
- Rent YoY
- —
- Metro
- —
- State GDP YoY
- ▲ 1.37%
- F500 in state
- 28
Industry mix (Fortune 500 HQ in MI)
| Industry | F500 HQs | Revenue |
|---|---|---|
| Automotive Parts | 3 | $48B |
|
||
| Automotive | 2 | $372B |
|
||
| Chemicals | 1 | $45B |
|
||
| Automotive Retail | 1 | $29B |
|
||
| Healthcare / Medical Devices | 1 | $23B |
|
||
| Automotive Technology | 1 | $20B |
|
||
Price history
+138.1% since first listed4 events — show timeline
- 2026-06-06 Listed $95,000 EUPBR
- 2012-06-06 Sold (Public Records) $16,000 Public Records
- 2002-08-09 Listing Removed — REALCOMP
- 2001-03-06 Listed $39,900 REALCOMP
Property tax history
-12.1%/yrLatest (2024): $103 · -69.9% YoY. Source: county tax records.
Cash-flow waterfall
monthlySold comps — $/sqft
last 12 mo · ≤1 miLoading sold comps…