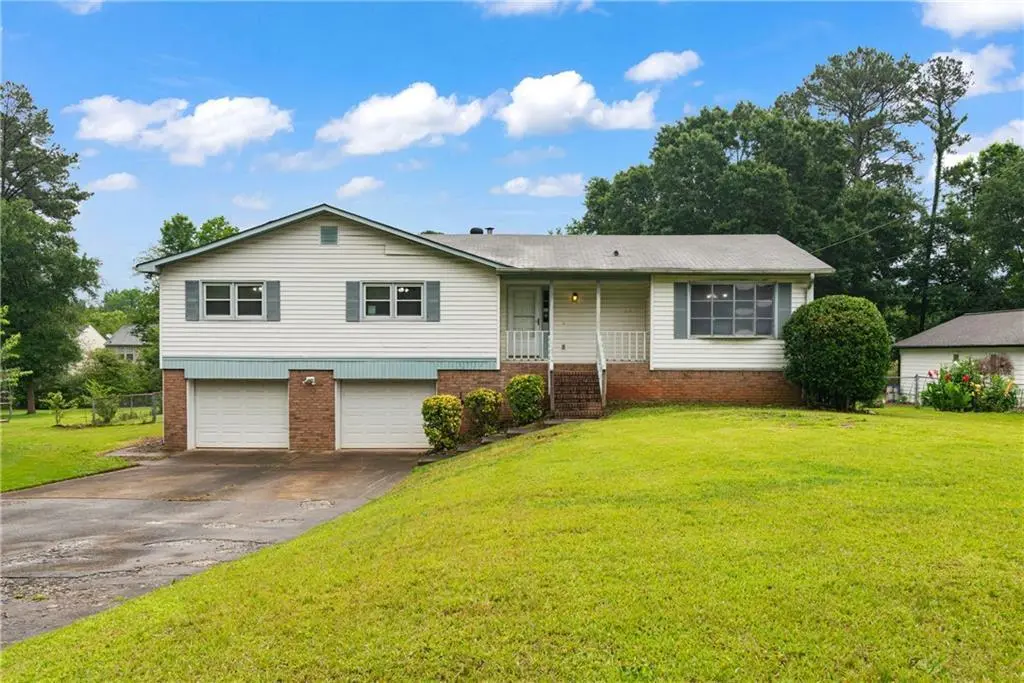
271 Sabrina Ct · Woodstock, GA
Flood risk 1/10 · Minimal
- FEMA flood zone
- X (unshaded)
- Chance of flooding over 30 yrs
- 0.0%
- Est. flood insurance / yr
- $473 – $860
Fire risk 1/10 · Minimal
- Est. fire insurance / yr
- $963 – $1,789
Heat risk 5/10 · Moderate
- Hot days now (above 102°F)
- 7 days/yr
- Hot days in 30 yrs
- 18 days/yr
Wind risk 4/10 · Minor
- Chance of severe wind over 30 yrs
- 14.0%
Air-quality risk 4/10 · Minor
- Unhealthy air days now
- 5 days/yr
- Unhealthy air days in 30 yrs
- 7 days/yr
Risk factors via First Street. Map © Google.
Why this score? — see what drove the D+ grade
The composite is a weighted blend of 9 inputs, each scored 0–100. Each bar is that input's sub-score; the figure is the points it added to the 100-point composite (weight × sub-score).
- ARV discount +15.0/15.0
- Cash flow +13.1/30.0
- Schools +4.2/10.0
- DSCR +3.9/10.0
- Livability +3.7/5.0
- Rent growth +3.5/5.0
- 1% rule +3.4/10.0
- Condition / age +2.5/5.0
- Appreciation +0.0/10.0
$300,000
🖨 Deal sheet (PDF) 📄 Offer letter ✓ Due diligence
Listing remarks MLS
UNLOCK MAJOR EQUITY 1.5 MILES FROM DOWNTOWN WOODSTOCK! Rare, high-upside opportunity to add value in Cherokee County's most vibrant submarket. Easy access to Hwy 92 and I-575. Priced aggressively at $300K to reflect the sweat equity required, this raised ranch sits on a premium, level .51-acre fenced lot. Featuring 3BR/2BA, a vaulted Great Room, Dining Room, Breakfast Area off the Kitchen, wet bar, and screened porch, the high-potential footprint provides the perfect springboard for your design ideas. The lower level includes a partial unfinished basement-perfect to finish out for extra living space, storage, or a workshop-and a spacious 2-car drive-under garage. Offered with total transparency, this home is a blank canvas awaiting updates and TLC to truly shine. Enjoy unbeatable proximity just minutes from Downtown Woodstock's premier dining, shopping, and entertainment. Upgraded infrastructure is underway on Neese Rd with a new roundabout being constructed at the Driftwood Forest neighborhood entrance to optimize future traffic flow. Seller disclosures are available in FMLS. Home is sold As Is. Bring your contractor, cash or renovation loans and maximize your return on investment!
Key facts
- 0.51 acre lot
- 2 garage spots
- Built 1978
Property features AI
Exterior
- Parking: Attached garage (2 spaces) with garage door opener; Drive-under main level garage; Driveway parking; Garage faces front; Level driveway; Additional open parking available
- Utilities: Public water; Septic tank; Electric service available; Cable available; Natural gas available; Phone available; Water available
- Home design: One-level home; Brick front with aluminum and vinyl siding; Composition roof; Fixer condition; Block foundation
- Construction: Aluminum siding; Brick front; Vinyl siding; Composition roof; Block foundation; Built with factory-built fireplace
- Exterior features: Private entrance; Front porch; Rear porch; Patio; Screened porch; Back yard chain link fencing; Driveway access to basement with exterior entry; Asphalt road frontage on a city street
Interior
- Kitchen: Breakfast room; Stained cabinets; Laminate countertops; Electric range; Microwave; Range hood; Refrigerator
- Bedrooms: Three main-level bedrooms; Primary bedroom located on the main level
- Flooring: Carpet; Vinyl
- Bathrooms: Two full bathrooms; Master bathroom with tub/shower combination
- Heating & cooling: Natural gas heating; Attic fan; Ceiling fans
- Interior features: Cathedral ceilings; High-speed internet available; His and hers closets; Insulated windows; No shared/common walls; One factory-built fireplace with gas starter and glass doors in the great room
- Laundry & utility: Laundry in basement
Neighborhood map
What this means for you Summary
Snapshot
- This is a 3-bed/2.0-bath single-family listed at $300k.
Deal economics
- At list price, monthly cash flow is $-13 ($-154/yr) — negative.
- To cash-flow at today's rent, offer at most $298k (0.8% below list).
- To meet the 1% rule (rent ≥ 1% of price), the offer needs to be $252k (16.2% below list).
- Recommended offer: $252k (16.2% below list) — sets the bar for 1% rule.
- Cap rate 6.2% vs local median 3.3% in Woodstock — top-decile yield for the area; either an underpriced asset or a hidden risk that comps aren't pricing in. Stress-test before assuming the spread holds.
Location & tenants
- Location reads 73/100 on livability (#46 in GA) — a middle-class / working-renter tenant base. Strengths: crime A+, employment A+, housing A+; Watch: amenities F, commute F, health & safety F.
- Cherokee County (suburban): math 46% / reading 48% proficiency, ranked #17 of 174 in GA (top 10%) — families likely to look elsewhere, expect single-tenant / working-renter base with shorter leases.
- Zoned schools: Johnston Elementary School (math 50% / reading 46%, grade D, #289 of 1,228 statewide, top 24%, 472 students, 36% FRL); Mill Creek Middle School (math 47% / reading 55%, grade C, #64 of 470 statewide, top 14%, 1,333 students, 25% FRL); River Ridge High School (math 18% / reading 46%, grade F, #110 of 424 statewide, top 28%, 1,914 students, 20% FRL) — zoned schools at 27% FRL track the district average.
- Market conditions: Rents rising (+4.0%/yr); 623 active listings in the ZIP; 13 comparable units currently listed for rent nearby; rentals at typical pace (median 20d on market — plan ~3-4 weeks tenant-placement turnaround); solid renter incomes; 2,665 units permitted in Cherokee County in 2024 (852 in 5+ unit buildings).
Forward outlook
- Local home prices are declining (-3.0%/yr); year-one equity from $2k of loan paydown is wiped out by about $9k of value loss. Plan a longer hold.
- Cherokee County population projected at +34% by 2050 — long-run rental-demand tailwind backs the buy-and-hold thesis.
Negotiation context
- Only 8 days on market — expect competitive offers; lowballing is unlikely to land.
- 2 sale attempts since 12y ago; this cycle's ask is 94% above the opening price — seller raised mid-cycle; expect resistance to lowballs.
- Current owner paid $146k; list at $300k implies a 105% gain — meaningful room to come down on a strong offer.
Risks & watch-outs
- Climate carrying-cost: extreme-heat days projected 7→18/yr by 2055 (HVAC capex compounding) — expect insurance premiums to compound above CPI over the hold.
Questions for the listing agent
- What do current leases actually rent for vs. the listed asking? Can we see a recent rent roll and the last 12 months of T-12 income?
- Built in 1978 — when were the roof, HVAC, electrical panel, plumbing, and water heater last replaced?
- Is there a deadline driving the sale (1031 exchange, divorce, estate, relocation)? That informs how much negotiation room exists.
- Schools are B-rated — typically a magnet for longer-tenancy family renters. What's the average tenant stay here, and is there a school-zone premium baked into asking?
- The area grade is low — what's the realistic commute time and amenity access for the typical tenant pool here? Any planned neighborhood developments (good or bad) we should know about?
- What's the average days-on-market for RENTAL listings here right now (not sales)? A rising rental-DOM trend means longer vacancies and softer asking-rent achievability than the comps imply.
- What's the recent tenant-quality profile in this submarket — average credit score on applications, eviction rate, late-payment / NSF rate, and stable-employment percentage? A property-management company in the area should have these aggregated.
- How much new for-sale + rental construction is in the pipeline within 1–3 miles? Heavy new supply typically softens prices + rents 12–24 months out; constrained supply supports both.
Investment metrics
- 1% rule
- 0.84% ✗
- Cap rate
- 6.24%
- Cash-on-cash
- -0.18%
- DSCR
- 0.99
- GRM
- 9.9
CMA / ARV
- ARV (on-the-fly)
- $407,528
- Comps found
- 12
Show comp detail 12 sales within ~0.75 mi
| Address | Dist | Beds/Ba | Sqft | Sold | Price | $/sf | Match |
|---|---|---|---|---|---|---|---|
| 1316 Timuquana Trl | 0.16mi | 3/2.5 | 1,660 (-1%) | 1mo | $377,000 | $227 | 88 |
| 534 Drifton Way | 0.46mi | 3/2.5 | 1,752 (+4%) | 2mo | $450,000 | $257 | 68 |
| 268 Sabrina Ct | 0.14mi | 3/2.0 | 1,918 (+14%) | 6mo | $417,500 | $218 | 65 |
| 203 Neese Farm Dr | 0.45mi | 3/2.0 | 1,592 (-6%) | 8mo | $440,000 | $276 | 64 |
| 235 Sabrina Ct | 0.34mi | 3/2.0 | 1,836 (+9%) | 6mo | $395,000 | $215 | 64 |
| 407 Doris Dr | 0.34mi | 3/2.0 | 1,520 (-10%) | 8mo | $379,000 | $249 | 61 |
| 1503 Korona Ct | 0.21mi | 3/2.5 | 1,435 (-15%) | 6mo | $362,500 | $253 | 59 |
| 528 Drifton Way | 0.46mi | 3/2.5 | 1,855 (+10%) | 1mo | $430,000 | $232 | 59 |
| 712 Trickum Valley Dr | 0.50mi | 3/2.0 | 1,856 (+10%) | 3mo | $430,000 | $232 | 57 |
| 136 Aucilla Ln | 0.57mi | 3/2.5 | 1,855 (+10%) | 3mo | $431,000 | $232 | 52 |
| 362 Acuba Vw | 0.72mi | 2/2.0 (-1) | 1,777 (+6%) | 1mo | $430,000 | $242 | 52 |
| 1111 Washington Ave | 0.64mi | 3/3.0 | 1,534 (-9%) | 7mo | $375,000 | $244 | 46 |
Match score weights: distance 35% · size 25% · config 20% · recency 20%. Top-matched comps best support the ARV.
Projected returns pro-forma
-3.0% appreciation · 3.96% rent growth · sell at horizon
- IRR
- -15.6%
- Equity multiple
- 0.44×
- Total profit
- $-46,986
- Equity at exit
- $44,731
- IRR
- -5.6%
- Equity multiple
- 0.62×
- Total profit
- $-31,734
- Equity at exit
- $25,939
Cash invested: $84,000 (down + closing). Projections, not guarantees.
Landlord ↔ Tenant lean methodology
- Overall (STATE)
- 90 Strongly Landlord-Friendly
- State Georgia
- 90 Strongly Landlord-Friendly · R+3
- County
- — inherits STATE
- City
- — inherits STATE
ZIP-level market 30188
- Rents YoY
- 4.0%
- Active inventory
- 623
- Price-to-rent
- 9.9×
Monthly cashflow live
- Estimated rent
- $2,515 high interval (Pro) →
- Mortgage (P&I)
- −$1,573
- Tax from tax record
- −$302 /mo · $3,621/yr
- Insurance
- −$125
- HOA
- −$0
- Vacancy / Maint / Mgmt
- −$528
- Net cashflow
- $-13
Break-even live
Sensitivity live
| Price | -10% $157 | -5% $72 | +0% $-13 | +5% $-98 | +10% $-183 |
|---|---|---|---|---|---|
| Rent | -10% $-212 | -5% $-112 | +0% $-13 | +5% $87 | +10% $186 |
| Rate | -1.0pp $138 | -0.5pp $63 | base $-13 | +0.5pp $-91 | +1.0pp $-170 |
UW: 25.0% down · 7.5% · 30yr · 1.5% tax · 5.0% vac · 8.0% maint · 8.0% mgmt
Financing live
Cash to close
- Down payment
- $75,000
- Closing costs
- $9,000
- Reserves months
- —
- Total cash needed
- —
Loan-product check · same deal, 3 products live
Conventional
25% down · 7.5% · 30yr
- Down + closing
- —
- Monthly P&I
- —
- Monthly cashflow
- —
- DSCR
- —
- Eligible?
- —
Personal DTI + credit; lowest rate.
DSCR
20% down · 8.5% · 30yr
- Down + closing
- —
- Monthly P&I
- —
- Monthly cashflow
- —
- DSCR
- —
- Eligible?
- —
No personal income docs; deal must DSCR.
Hard money
10% down · 12.0% · 12mo
- Down + closing
- —
- Monthly P&I
- —
- Monthly cashflow
- —
- DSCR
- —
- Eligible?
- —
Short-term bridge; refi at stabilization.
Rent comps 13 comps
| Address | Beds | Baths | Sqft | Rent | $/sqft | DOM | Units | Dist |
|---|---|---|---|---|---|---|---|---|
| 1506 Korona Ct Woodstock, GA | 3.0 | 2.5 | 1619 | $2,390 | $1.48 | 19d | 1 | 0.24mi |
| 809 Cataya Cv Woodstock, GA | 3.0 | 2.5 | 1974 | $2,765 | $1.40 | 14d | 1 | 0.39mi |
| 1056 Dunedin Trl Unit 1 Woodstock, GA | 3.0 | 3.0 | 2000 | $3,200 | $1.60 | 45d | 1 | 0.43mi |
| 223 Regent Sq Woodstock, GA | 3.0 | 2.5 | 1582 | $2,200 | $1.39 | 19d | 1 | 0.78mi |
| 156 Weatherstone Dr Woodstock, GA | 3.0 | 3.0 | 1746 | $2,400 | $1.37 | 20d | 1 | 0.90mi |
| 160 Village Trl Woodstock, GA | 4.0 | 2.5 | 2228 | $2,600 | $1.17 | 45d | 1 | 1.05mi |
| 516 Mullein Trce Woodstock, GA | 2.0 | 3.5 | 2005 | $1,590 | $0.79 | 14d | 1 | 1.12mi |
| 159 Stone Manor Ct Woodstock, GA | 3.0 | 2.0 | 1764 | $2,406 | $1.36 | 5d | 1 | 1.16mi |
| 1 Sycamore Ln Woodstock, GA | 1.0–3.0 | 1.0–2.0 | 1164 | $2,112 | $1.81 | 0d | 39 | 1.22mi |
| 432 Parkstone Dr Woodstock, GA | 3.0 | 2.0 | 1633 | $2,196 | $1.34 | 45d | 1 | 1.30mi |
| 813 Upper Dove Ct Woodstock, GA | 4.0 | 2.5 | 1928 | $2,395 | $1.24 | 19d | 1 | 1.38mi |
| 811 Riverstone Ln Woodstock, GA | 3.0 | 2.0 | 1486 | $1,999 | $1.35 | 18d | 1 | 1.40mi |
| 303 Winchester Way Woodstock, GA | 3.0 | 2.5 | 1750 | $2,350 | $1.34 | 5d | 1 | 1.48mi |
Listing history 8 events
-
2026-06-21statusdays on market $300,000 Pending 8 DOM
-
2026-06-18days on market $300,000 Active Under Contract 7 DOM
-
2026-06-17statusdays on market $300,000 Active Under Contract 6 DOM
-
2026-06-16days on market $300,000 Active 5 DOM
-
2026-06-15days on market $300,000 Active 4 DOM
-
2026-06-13statusdays on market $300,000 Active 2 DOM
-
2026-06-10remarks 681-char remark
-
2026-06-10$300,000 Coming Soon 1 DOM
ⓘ Source: listings_history table (triggers on properties + properties_extension) + one-shot
backfill from property_details.listing_events for pre-trigger history.
Tax reassessment forecast GA · Resets to sale price
- Current annual tax
- $3,621 · $302/mo
- Projected year-2 tax
- $3,621 · $302/mo
- Expected delta
- $0/yr ($0/mo · 0.0%)
ⓘ Screening estimate from a state-policy table — verify with the county assessor before closing.
Climate risk First Street
- Flood 1/10 Low FEMA zone X (unshaded) · 0% chance over 30 yrs
- Wildfire 1/10 Low
- Heat 5/10 Major 7 d/yr ≥102°F today · 18 d/yr by 30 yrs out
- Wind 4/10 Moderate 14% chance of damaging wind over 30 yrs
- Air quality 4/10 Moderate 5 unhealthy d/yr today · 7 by 30 yrs out
Nearby sold comps map
Loading sold comps map…
Walkable amenities ~0.75 mi
Loading nearby amenities…
Taxation est. · year 1
- Rental income
- $30,184
- − Mortgage interest
- −$16,805
- − Property taxes
- −$3,621
- − Insurance
- −$1,500
- − Repairs & maintenance
- −$2,415
- − Management
- −$2,415
- − Depreciation
- −$8,727
- Taxable loss
- −$5,298
- Est. tax savings @ 24.0%
- +$1,272
- After-tax cash flow
- $1,117/yr
For passive investors: Depreciation is non-cash, so a rental often shows a tax loss while cash-flowing — sheltering income. Rental losses are passive: they offset passive income freely, and up to $25,000/yr can offset ordinary (W-2) income if you actively participate and your MAGI is under $100k (phasing out to $0 by $150k); unused losses carry forward. On sale, claimed depreciation is recaptured at up to 25%, and gains may owe capital-gains tax (a 1031 exchange can defer both). Figures are a year-1 estimate at your 24.0% rate — not tax advice; consult a CPA.
Schools (NCES district)
- District
- Cherokee County
- NCES district ID
- 1301110
- Math proficiency
- 46% ▼ -11.00%
- Reading proficiency
- 48% ▼ -8.00%
- Median HH income
- $69,295
- Composite
- 42.14/100
- National rank
- #3304
- State rank
- #17 of 174 in GA
Livability — Woodstock
- Score
- 73/100
- State rank
- #46
- US rank
- #5116
Category grades
Schools grade is shown separately in the Schools card above.
Census & demographics
- Census place
- Woodstock, GA
- County
- Cherokee County · 289,977 people
- City population
- 109,446
- Metro
- Atlanta-Sandy Springs-Alpharetta, GA
- Population (ZIP)
- 69,518
- Household income
- $106,844
- Rent vs Own
- Severe rent burden
- 1591.0
Population outlook (Cherokee County) Hauer SSP2
- Today (2025)
- 281,923 people
- By 2030
- 303,845 · +7.8%
- By 2040
- 344,738 · +22.3%
- By 2050
- 379,010 · +34.4%
- By 2075
- 449,617 · +59.5%
- By 2100
- 484,103 · +71.7%
Race, ethnicity, and origin ACS 2023
- Neighborhood character
- Predominantly White (74%)
- Race & ethnicity
- White 74% Hispanic / Latino 9% Two or more races 8% Black 7% Asian 4%
- Hispanic origin (detail)
- Mexican 4% Puerto Rican 1%
- Common ancestry
- Slovak 3% Italian 3% Lithuanian 3%
- Foreign-born
- 11% · Canada, Vietnam, South Korea
- Languages at home
- 87% English-only · Spanish 7% Other Indo-European 3% Other Asian/Pacific 1%
Political lean MEDSL · Cherokee
- 2024 margin
- Solid R (+39.0) · D 30.1% · R 69.1%
- 2008→2024 swing
- +12.1pp toward D · 2008: -51.1pp · 2024: -39.0pp
- All cycles
- 2024: R+39.0 2020: R+39.2 2016: R+50.0 2012: R+57.8 2008: R+51.1
Not yet ingested
- Civics
- —
Market trends
- HPI YoY
- ▼ -291.54%
- Current HPI
- 260.554
- Rent YoY
- ▲ 3.96%
- Metro
- Atlanta-Sandy Springs-Alpharetta, GA
- State GDP YoY
- ▲ 2.66%
- F500 in state
- 28
Industry mix (Fortune 500 HQ in GA)
| Industry | F500 HQs | Revenue |
|---|---|---|
| Paper / Packaging | 2 | $29B |
|
||
| Retail | 1 | $160B |
|
||
| Transportation / Logistics | 1 | $91B |
|
||
| Airlines | 1 | $62B |
|
||
| Consumer Goods | 1 | $47B |
|
||
| Utilities | 1 | $25B |
|
||
Price history
+5900.0% since first listed15 events — show timeline
- 2026-06-09 Coming Soon $300,000 GAMLS
- 2026-06-09 Coming Soon $300,000 FMLS
- 2014-06-09 Price Changed $146,500 FMLS
- 2014-05-16 Sold (Public Records) $146,500 Public Records
- 2014-05-13 Listing Removed — FMLS
- 2014-05-08 Sold (MLS) $146,500 FMLS
- 2014-05-08 Price Changed $149,900 FMLS
- 2014-04-11 Pending — FMLS
- 2014-03-28 Contingent — FMLS
- 2014-02-28 Relisted — FMLS
- 2014-02-18 Contingent — FMLS
- 2014-02-11 Price Changed $149,900 FMLS
- 2014-01-26 Listed $154,900 FMLS
- 1978-07-01 Sold (Public Records) $45,200 Public Records
- 1978-05-01 Sold (Public Records) $5,000 Public Records
Property tax history
+6.7%/yrLatest (2025): $3,621 · +3.2% YoY. Source: county tax records.
Cash-flow waterfall
monthlySold comps — $/sqft
last 12 mo · ≤1 miLoading sold comps…