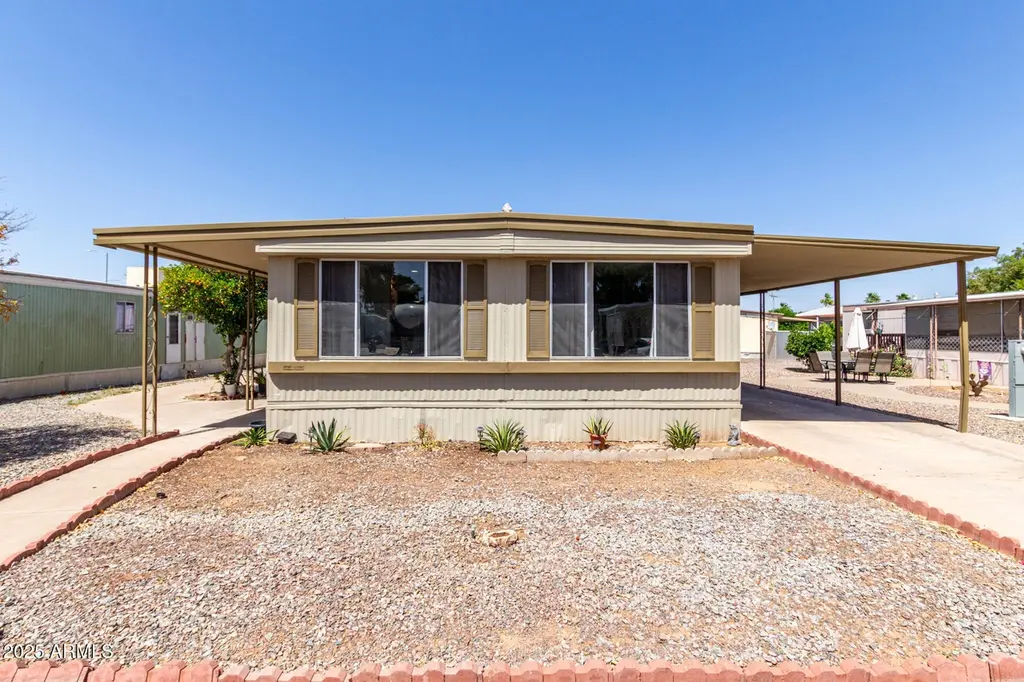
2650 W Union Hills Dr #98 · Phoenix, AZ
Flood risk 1/10 · Minimal
- FEMA flood zone
- X (shaded)
- Chance of flooding over 30 yrs
- 0.0%
- Est. flood insurance / yr
- $507 – $1,088
Fire risk 1/10 · Minimal
- Est. fire insurance / yr
- $610 – $1,132
Heat risk 8/10 · Major
- Hot days now (above 111°F)
- 5 days/yr
- Hot days in 30 yrs
- 14 days/yr
Wind risk 1/10 · Minimal
- Chance of severe wind over 30 yrs
- —
Air-quality risk 3/10 · Minor
- Unhealthy air days now
- 2 days/yr
- Unhealthy air days in 30 yrs
- 3 days/yr
Risk factors via First Street. Map © Google.
Why this score? — see what drove the B- grade
The composite is a weighted blend of 9 inputs, each scored 0–100. Each bar is that input's sub-score; the figure is the points it added to the 100-point composite (weight × sub-score).
- Cash flow +30.0/30.0
- 1% rule +10.0/10.0
- DSCR +10.0/10.0
- Schools +4.7/10.0
- Condition / age +4.0/5.0
- Livability +3.8/5.0
- ARV discount +2.7/15.0
- Rent growth +1.8/5.0
- Appreciation +0.0/10.0
$72,000
🖨 Deal sheet (PDF) 📄 Offer letter ✓ Due diligence
Listing remarks MLS
Welcome home to his lovely 2-bedroom property! Discover the lovely curb appeal showcasing desert landscape, carport parking, & a cozy side covered patio with delightful citrus tree. Inside, discover the open floor plan, wood & look flooring. The great room enjoys large windows and an inviting gas fireplace. The pristine kitchen features plenty of shaker cabinets, granite counters, center island w/breakfast bar, & a dining room w/sliding doors to the side yard. The main bedroom boasts backyard access & a private bathroom w/vessel sink & a walk-in closet. Do not miss the convenient storage outside.
Key facts
- Open floor plan
- Desert landscape
- Gas fireplace
Tags
Neighborhood map
What this means for you Summary
Snapshot
- This is a 2-bed/2.0-bath manufactured listed at $72k. Condition is rated good.
Deal economics
- At list price, monthly cash flow is $794 ($10k/yr) — positive.
- The deal already cash-flows at list — no discount required.
- Meets the 1% rule at list price ($2k rent vs $72k).
- Recommended offer: $63k (12.0% below list) — sets the bar for market timing.
- Cap rate 19.5% vs local median 3.3% in Phoenix — top-decile yield for the area; either an underpriced asset or a hidden risk that comps aren't pricing in. Stress-test before assuming the spread holds.
Location & tenants
- Location reads 75/100 on livability (#16 in AZ, #3,924 nationally) — a middle-class / working-renter tenant base. Strengths: amenities A+, commute A+, housing A+; Watch: health & safety C-, crime F.
- Deer Valley Unified District (4246) (urban): math 50% / reading 55% proficiency, ranked #33 of 249 in AZ (top 13%) — acceptable for families but not a draw, mixed tenant base, ~2y average lease.
- Market conditions: Rents soft (-2.8%/yr); 174 active listings in the ZIP; 40 comparable units currently listed for rent nearby; rentals at typical pace (median 14d on market — plan ~3-4 weeks tenant-placement turnaround); solid renter incomes; 36,011 units permitted in Maricopa County in 2024 (12,801 in 5+ unit buildings).
Forward outlook
- Local home prices are declining (-3.0%/yr); year-one equity from $498 of loan paydown is wiped out by about $2k of value loss. Plan a longer hold.
- Maricopa County population projected at +38% by 2050 — long-run rental-demand tailwind backs the buy-and-hold thesis.
- At projected returns (-3.0% appreciation + 0.0% rent growth), your $20k cash investment doubles in ~3 years — after that, you're playing with house money.
Negotiation context
- It's been on market 151 days — a 12% lower offer ($63k) is reasonable based on typical stale-listing flexibility.
- 3 sale attempts with the ask held roughly flat each time — persistent listings suggest the price (not the market) is what's stuck; bring a comps-based counter.
Risks & watch-outs
- Climate carrying-cost: extreme-heat days projected 5→14/yr by 2055 (HVAC capex compounding) — expect insurance premiums to compound above CPI over the hold.
Questions for the listing agent
- It's been on market 151 days. Have you received any prior offers? Is the seller open to a 12% concession, seller financing, or rate buy-down credit?
- Built in 1970 — when were the roof, HVAC, electrical panel, plumbing, and water heater last replaced?
- Why hasn't it sold? Are there any deal-killer items the seller is aware of (foundation, flood, title, zoning, code violations)?
- Is there a deadline driving the sale (1031 exchange, divorce, estate, relocation)? That informs how much negotiation room exists.
- Crime grade is F in this area — have there been break-ins, vandalism, or insurance claims at this property in the last 3 years? What carrier currently insures it and at what premium?
- What's the average days-on-market for RENTAL listings here right now (not sales)? A rising rental-DOM trend means longer vacancies and softer asking-rent achievability than the comps imply.
- What's the recent tenant-quality profile in this submarket — average credit score on applications, eviction rate, late-payment / NSF rate, and stable-employment percentage? A property-management company in the area should have these aggregated.
- How much new for-sale + rental construction is in the pipeline within 1–3 miles? Heavy new supply typically softens prices + rents 12–24 months out; constrained supply supports both.
Investment metrics
- 1% rule
- 2.27% ✓
- Cap rate
- 19.52%
- Cash-on-cash
- 47.24%
- DSCR
- 3.10
- GRM
- 3.7
CMA / ARV
- ARV (median comp)
- $65,000
- List price
- $72,000
- Delta
- 10.77%
- Verdict
- OVERPRICED
- Comps
- 11 within 1.0 mi
Show comp detail 12 sales within ~0.75 mi
| Address | Dist | Beds/Ba | Sqft | Sold | Price | $/sf | Match |
|---|---|---|---|---|---|---|---|
| 2650 W Union Hills Dr #114 | 0.00mi | 2/2.0 | 1,440 (0%) | 13mo | $29,000 | $20 | 89 |
| 2650 W Union Hills Dr #131 | 0.00mi | 2/2.0 | 1,488 (+3%) | 8mo | $60,500 | $41 | 88 |
| 2650 W Union Hills Dr #100 | 0.01mi | 3/2.0 (+1) | 1,440 (0%) | 9mo | $99,000 | $69 | 87 |
| 2650 W Union Hills Dr #33 | 0.00mi | 3/2.0 (+1) | 1,440 (0%) | 13mo | $55,000 | $38 | 84 |
| 2650 W Union Hills Dr #138 | 0.01mi | 2/2.0 | 1,536 (+7%) | 5mo | $74,000 | $48 | 84 |
| 2650 W Union Hills Dr #8 | 0.08mi | 2/2.0 | 1,536 (+7%) | 2mo | $65,000 | $42 | 83 |
| 2650 W Union Hills Dr #215 | 0.00mi | 2/2.0 | 1,344 (-7%) | 10mo | $37,500 | $28 | 81 |
| 2650 W Union Hills Dr #43 | 0.00mi | 3/2.0 (+1) | 1,344 (-7%) | 4mo | $50,000 | $37 | 80 |
| 2650 W Union Hills Dr #258 | 0.00mi | 3/2.0 (+1) | 1,488 (+3%) | 12mo | $80,000 | $54 | 79 |
| 2650 W Union Hills Dr #133 | 0.05mi | 2/2.0 | 1,248 (-13%) | 4mo | $53,000 | $42 | 72 |
| 2650 W Union Hills Dr #247 | 0.08mi | 3/2.0 (+1) | 1,250 (-13%) | 2mo | $62,000 | $50 | 68 |
| 2650 W Union Hills Dr #257 | 0.05mi | 2/2.0 | 1,248 (-13%) | 9mo | $79,000 | $63 | 67 |
Match score weights: distance 35% · size 25% · config 20% · recency 20%. Top-matched comps best support the ARV.
Projected returns pro-forma
-3.0% appreciation · 0.0% rent growth · sell at horizon
- IRR
- 41.2%
- Equity multiple
- 2.69×
- Total profit
- $34,119
- Equity at exit
- $10,735
- IRR
- 46.0%
- Equity multiple
- 4.79×
- Total profit
- $76,392
- Equity at exit
- $6,225
Cash invested: $20,160 (down + closing). Projections, not guarantees.
Landlord ↔ Tenant lean methodology
- Overall (STATE)
- 87 Strongly Landlord-Friendly
- State Arizona
- 87 Strongly Landlord-Friendly · R+3
- County
- — inherits STATE
- City
- — inherits STATE
ZIP-level market 85027
- Rents YoY
- -2.8%
- Active inventory
- 174
- Price-to-rent
- 3.7×
Monthly cashflow live
- Estimated rent
- $1,635 high interval (Pro) →
- Mortgage (P&I)
- −$378
- Tax est. 1.5%
- −$90 /mo · $1,080/yr
- Insurance
- −$30
- HOA
- −$0
- Vacancy / Maint / Mgmt
- −$343
- Net cashflow
- $794
Break-even live
Sensitivity live
| Price | -10% $843 | -5% $819 | +0% $794 | +5% $769 | +10% $744 |
|---|---|---|---|---|---|
| Rent | -10% $665 | -5% $729 | +0% $794 | +5% $858 | +10% $923 |
| Rate | -1.0pp $830 | -0.5pp $812 | base $794 | +0.5pp $775 | +1.0pp $756 |
UW: 25.0% down · 7.5% · 30yr · 1.5% tax · 5.0% vac · 8.0% maint · 8.0% mgmt
Financing live
Cash to close
- Down payment
- $18,000
- Closing costs
- $2,160
- Reserves months
- —
- Total cash needed
- —
Loan-product check · same deal, 3 products live
Conventional
25% down · 7.5% · 30yr
- Down + closing
- —
- Monthly P&I
- —
- Monthly cashflow
- —
- DSCR
- —
- Eligible?
- —
Personal DTI + credit; lowest rate.
DSCR
20% down · 8.5% · 30yr
- Down + closing
- —
- Monthly P&I
- —
- Monthly cashflow
- —
- DSCR
- —
- Eligible?
- —
No personal income docs; deal must DSCR.
Hard money
10% down · 12.0% · 12mo
- Down + closing
- —
- Monthly P&I
- —
- Monthly cashflow
- —
- DSCR
- —
- Eligible?
- —
Short-term bridge; refi at stabilization.
Rent comps 40 comps
| Address | Beds | Baths | Sqft | Rent | $/sqft | DOM | Units | Dist |
|---|---|---|---|---|---|---|---|---|
| 18250 N 25th Ave Phoenix, AZ | 1.0–3.0 | 1.0–2.0 | 992 | $1,729 | $1.74 | 0d | 18 | 0.43mi |
| 2929 W Yorkshire Dr Phoenix, AZ | 1.0–3.0 | 1.0–2.0 | 915 | $1,498 | $1.64 | 19d | 2 | 0.46mi |
| 18422 N 30th Ln Phoenix, AZ | 3.0 | 2.5 | 1604 | $2,275 | $1.42 | 25d | 1 | 0.53mi |
| 17840 N Black Canyon Hwy Phoenix, AZ | 1.0–2.0 | 1.0–2.0 | 880 | $1,655 | $1.88 | 4d | 19 | 0.57mi |
| 18001 N 29th Dr Phoenix, AZ | 3.0 | 2.5 | 1500 | $1,800 | $1.20 | 45d | 1 | 0.59mi |
| 3010 W Yorkshire Dr Phoenix, AZ | 1.0–3.0 | 1.0–2.0 | 975 | $1,444 | $1.48 | 3d | 80 | 0.59mi |
| 2039 W Union Hills Dr Unit 15-001 Phoenix, AZ | 2.0 | 2.0 | 1100 | $1,345 | $1.22 | 16d | 1 | 0.73mi |
| 2039 W Union Hills Dr Unit 39-143 Phoenix, AZ | 2.0 | 2.0 | 1100 | $1,345 | $1.22 | 9d | 1 | 0.73mi |
| 2039 W Union Hills Dr Unit 15-204 Phoenix, AZ | 2.0 | 1.0 | 1000 | $1,245 | $1.25 | 16d | 1 | 0.73mi |
| 2039 W Union Hills Dr Unit 39-117 Phoenix, AZ | 2.0 | 1.0 | 1000 | $1,000 | $1.00 | 9d | 1 | 0.73mi |
| 2953 W Libby St Phoenix, AZ | 3.0 | 2.0 | 1640 | $2,095 | $1.28 | 45d | 1 | 0.74mi |
| 2020 W Union Hills Dr #254 Phoenix, AZ | 2.0 | 2.0 | 1049 | $1,650 | $1.57 | 45d | 1 | 0.76mi |
| 19940 N 23rd Ave Phoenix, AZ | 4.0 | 1.0–2.0 | 812 | $1,366 | $1.68 | 0d | 63 | 0.82mi |
| 3144 W Charleston Ave Phoenix, AZ | 3.0 | 2.0 | 1085 | $1,845 | $1.70 | 18d | 1 | 0.83mi |
| 2431 W Shady Glen Ave Phoenix, AZ | 3.0 | 2.0 | 1586 | $2,155 | $1.36 | 9d | 1 | 0.90mi |
| 3411 W Morrow Dr #3 Phoenix, AZ | 2.0 | 1.5 | 1056 | $1,495 | $1.42 | 45d | 1 | 0.91mi |
| 18811 N 19th Ave Phoenix, AZ | 1.0–2.0 | 1.0–2.0 | 885 | $1,525 | $1.72 | 3d | 2 | 1.06mi |
| 18811 N 19th Ave Phoenix, AZ | 1.0–2.0 | 1.0–2.0 | 885 | $1,400 | $1.58 | 0d | 3 | 1.06mi |
| 3338 W Tonto Ln Phoenix, AZ | 2.0 | 1.0 | 1206 | $1,375 | $1.14 | 9d | 1 | 1.06mi |
| 3250 W Helena Dr Phoenix, AZ | 3.0 | 2.0 | 1850 | $2,450 | $1.32 | 25d | 1 | 1.09mi |
| 2018 W Meadow Dr Phoenix, AZ | 3.0 | 2.0 | 1659 | $1,965 | $1.18 | 0d | 1 | 1.12mi |
| 1750 W Union Hills Dr #91 Phoenix, AZ | 3.0 | 2.5 | 1680 | $1,900 | $1.13 | 6d | 1 | 1.14mi |
| 18435 N 36th Ave Glendale, AZ | 3.0 | 2.0 | 1386 | $2,400 | $1.73 | 45d | 1 | 1.14mi |
| 20227 N 21st Dr Phoenix, AZ | 2.0 | 2.5 | 1280 | $1,500 | $1.17 | 45d | 1 | 1.14mi |
| 20245 N 32nd Dr Phoenix, AZ | 1.0–2.0 | 1.0–2.0 | 834 | $1,530 | $1.83 | 0d | 11 | 1.16mi |
| 2902 W Irma Ln Phoenix, AZ | 3.0 | 2.0 | 1553 | $2,295 | $1.48 | 45d | 1 | 1.18mi |
| 20808 N 27th Ave Phoenix, AZ | 1.0–3.0 | 1.0–2.0 | 962 | $1,560 | $1.62 | 0d | 15 | 1.20mi |
| 3202 W Bell Rd Phoenix, AZ | 1.0–2.0 | 1.0–2.0 | 719 | $1,299 | $1.81 | 0d | 32 | 1.24mi |
| 2109 W Danbury Rd Phoenix, AZ | 3.0 | 1.5 | 1175 | $1,695 | $1.44 | 45d | 1 | 1.26mi |
| 17609 N 19th Ave Unit 204 Phoenix, AZ | 2.0 | 2.0 | 935 | $1,199 | $1.28 | 45d | 1 | 1.27mi |
| 17609 N 19th Ave Apt 107 Phoenix, AZ | 2.0 | 2.0 | 935 | $1,325 | $1.42 | 4d | 1 | 1.28mi |
| 17216 N 33rd Ave Phoenix, AZ | 1.0–2.0 | 1.0–2.0 | 741 | $1,525 | $2.06 | 0d | 21 | 1.29mi |
| 17609 N 19th Ave Unit 209 Phoenix, AZ | 2.0 | 2.0 | 935 | $1,099 | $1.18 | 25d | 1 | 1.29mi |
| 17402 N 19th Ave Phoenix, AZ | 3.0 | 2.5 | 1194 | $1,450 | $1.21 | 3d | 2 | 1.30mi |
| 3420 W Danbury Dr Unit C113 Phoenix, AZ | 2.0 | 2.0 | 896 | $1,485 | $1.66 | 0d | 1 | 1.35mi |
| 3420 W Danbury Dr Phoenix, AZ | 1.0–2.0 | 1.0–2.0 | 810 | $1,485 | $1.83 | 25d | 2 | 1.36mi |
| 3420 W Danbury Dr Phoenix, AZ | 1.0–2.0 | 1.0–2.0 | 810 | $1,485 | $1.83 | 14d | 2 | 1.36mi |
| 1708 W Behrend Dr Phoenix, AZ | 3.0 | 1.5 | 1320 | $1,761 | $1.33 | 9d | 1 | 1.36mi |
| 20601 N 33rd Ave Phoenix, AZ | 3.0 | 2.0 | 1085 | $2,100 | $1.94 | 25d | 1 | 1.36mi |
| 3434 W Danbury Dr Unit A114 Phoenix, AZ | 2.0 | 2.0 | 896 | $1,485 | $1.66 | 25d | 1 | 1.37mi |
Listing history 22 events
-
2026-06-21days on market $72,000 Active 151 DOM
-
2026-06-18days on market $72,000 Active 148 DOM
-
2026-06-17days on market $72,000 Active 147 DOM
-
2026-06-16days on market $72,000 Active 146 DOM
-
2026-06-15days on market $72,000 Active 145 DOM
-
2026-06-13days on market $72,000 Active 143 DOM
-
2026-06-13days on market $72,000 Active 142 DOM
-
2026-06-09days on market $72,000 Active 139 DOM
-
2026-06-08days on market $72,000 Active 138 DOM
-
2026-06-07days on market $72,000 Active 137 DOM
-
2026-06-04days on market $72,000 Active 134 DOM
-
2026-06-03days on market $72,000 Active 133 DOM
-
2026-06-02days on market $72,000 Active 132 DOM
-
2026-06-01days on market $72,000 Active 131 DOM
-
2026-05-31days on market $72,000 Active 130 DOM
-
2026-01-19$72,000 Active 623-char remark
Show marketing remark (623 chars)
Welcome home to his lovely 2-bedroom property! Discover the lovely curb appeal showcasing desert landscape, carport parking, & a cozy side covered patio with delightful citrus tree. Inside, discover the open floor plan, wood & look flooring. The great room enjoys large windows and an inviting gas fireplace. The pristine kitchen features plenty of shaker cabinets, granite counters, center island w/breakfast bar, & a dining room w/sliding doors to the side yard. The main bedroom boasts backyard access & a private bathroom w/vessel sink & a walk-in closet. Do not miss the convenient storage outside.
-
2025-12-01historical
-
2025-11-01status Active
-
2025-11-01historical
-
2025-10-16price $74,900
-
2025-06-19price $80,000
-
2025-05-15$85,000 Active
ⓘ Source: listings_history table (triggers on properties + properties_extension) + one-shot
backfill from property_details.listing_events for pre-trigger history.
Climate risk First Street
- Flood 1/10 Low FEMA zone X (shaded) · 0% chance over 30 yrs
- Wildfire 1/10 Low
- Heat 8/10 Severe 5 d/yr ≥111°F today · 14 d/yr by 30 yrs out
- Wind 1/10 Low
- Air quality 3/10 Moderate 2 unhealthy d/yr today · 3 by 30 yrs out
Nearby sold comps map
Loading sold comps map…
Walkable amenities ~0.75 mi
Loading nearby amenities…
Taxation est. · year 1
- Rental income
- $19,614
- − Mortgage interest
- −$4,033
- − Property taxes
- −$1,080
- − Insurance
- −$360
- − Repairs & maintenance
- −$1,569
- − Management
- −$1,569
- − Depreciation
- −$2,095
- Taxable income
- $8,908
- Est. tax owed @ 24.0%
- −$2,138
- After-tax cash flow
- $7,386/yr
For passive investors: Depreciation is non-cash, so a rental often shows a tax loss while cash-flowing — sheltering income. Rental losses are passive: they offset passive income freely, and up to $25,000/yr can offset ordinary (W-2) income if you actively participate and your MAGI is under $100k (phasing out to $0 by $150k); unused losses carry forward. On sale, claimed depreciation is recaptured at up to 25%, and gains may owe capital-gains tax (a 1031 exchange can defer both). Figures are a year-1 estimate at your 24.0% rate — not tax advice; consult a CPA.
Condition & rehab AI · 12 photos
This manufactured home is in good condition with a good condition score of 80. It has a good curb appeal and an open floor plan with good quality finishes. The home is move-in ready with minor cosmetic updates needed to enhance its resale and rental value.
Value-add opportunities
- Resale paint exterior — enhances curb appeal
- Resale paint interior — enhances interior appearance
- Both landscaping — enhances curb appeal and adds value
- Rental HVAC maintenance — improves tenant satisfaction
Renovation cost estimate screening
Value-add ROI direction
- Resale paint exterior — enhances curb appeal ↑
- Resale paint interior — enhances interior appearance ↑
- Both landscaping — enhances curb appeal and adds value ↑
- Rental HVAC maintenance — improves tenant satisfaction ↑
ⓘ Cost ranges are severity-bucket heuristics (US national rule-of-thumb). Get contractor quotes + a written scope before underwriting a rehab budget.
Schools (NCES district)
- District
- Deer Valley Unified District (4246)
- NCES district ID
- 0407750
- Math proficiency
- 50% ▼ -9.00%
- Reading proficiency
- 55% ▼ -6.00%
- Median HH income
- $72,516
- Composite
- 47.0/100
- National rank
- #2346
- State rank
- #33 of 249 in AZ
Livability — Phoenix
- Score
- 75/100
- State rank
- #16
- US rank
- #3924
Category grades
Schools grade is shown separately in the Schools card above.
Census & demographics
- Census place
- Phoenix, AZ
- County
- Maricopa County · 4,537,380 people
- City population
- 1,500,198
- Metro
- Phoenix-Mesa-Chandler, AZ
- Population (ZIP)
- 39,487
- Household income
- $76,605
- Rent vs Own
- Severe rent burden
- 1533.0
Population outlook (Maricopa County) Hauer SSP2
- Today (2025)
- 4,979,203 people
- By 2030
- 5,378,229 · +8.0%
- By 2040
- 6,156,598 · +23.6%
- By 2050
- 6,872,376 · +38.0%
- By 2075
- 8,401,270 · +68.7%
- By 2100
- 9,247,439 · +85.7%
Race, ethnicity, and origin ACS 2023
- Neighborhood character
- Diverse neighborhood (Simpson 0.58)
- Race & ethnicity
- White 61% Hispanic / Latino 22% Two or more races 13% Asian 7% Black 2% Native American 2%
- Hispanic origin (detail)
- Mexican 18% Puerto Rican 1%
- Common ancestry
- Lithuanian 2% Romanian 2% Italian 2%
- Foreign-born
- 16% · Canada, China
- Languages at home
- 77% English-only · Spanish 10% Other Indo-European 4% Other Asian/Pacific 3%
Political lean MEDSL · Maricopa
- 2024 margin
- Toss-up / Even · D 47.7% · R 51.2% · Other 1.1%
- 2008→2024 swing
- +7.1pp toward D · 2008: -10.6pp · 2024: -3.5pp
- All cycles
- 2024: R+3.5 2020: D+2.2 2016: R+3.5 2012: R+12.0 2008: R+10.6
Not yet ingested
- Civics
- —
Market trends
- HPI YoY
- ▼ -248.58%
- Current HPI
- 356.8851
- Rent YoY
- ▼ -2.75%
- Metro
- Phoenix-Mesa-Chandler, AZ
- State GDP YoY
- ▲ 4.54%
- F500 in state
- 20
Industry mix (Fortune 500 HQ in AZ)
| Industry | F500 HQs | Revenue |
|---|---|---|
| Technology | 2 | $13B |
|
||
| Mining / Metals | 1 | $23B |
|
||
| Environmental Services | 1 | $16B |
|
||
| Metals / Steel | 1 | $14B |
|
||
| Technology Distribution | 1 | $9B |
|
||
| Homebuilding | 1 | $8B |
|
||
Price history
-15.3% since first listed7 events — show timeline
- 2026-01-19 Listed $72,000 ARMLS
- 2025-12-01 Listing Removed — ARMLS
- 2025-11-01 Relisted — ARMLS
- 2025-11-01 Listing Removed — ARMLS
- 2025-10-16 Price Changed $74,900 ARMLS
- 2025-06-19 Price Changed $80,000 ARMLS
- 2025-05-15 Listed $85,000 ARMLS
Cash-flow waterfall
monthlySold comps — $/sqft
last 12 mo · ≤1 miLoading sold comps…