 🏷️ Likely Rental
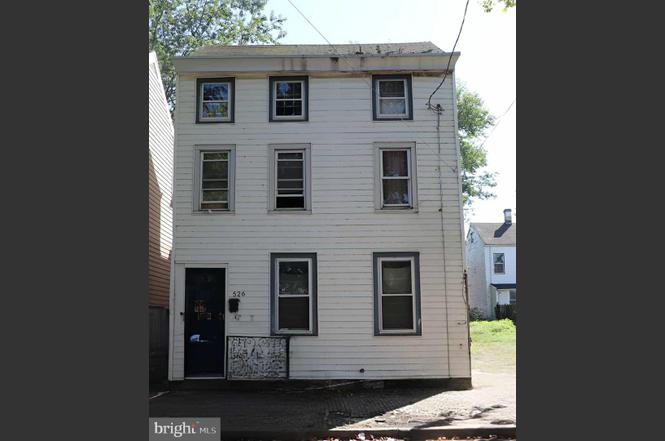
526 Lamberton St · Trenton, NJ
Flood risk 3/10 · Minor
- FEMA flood zone
- X (unshaded)
- Chance of flooding over 30 yrs
- 0.13%
- Est. flood insurance / yr
- $507 – $1,088
Fire risk 1/10 · Minimal
- Est. fire insurance / yr
- $526 – $976
Heat risk 6/10 · Moderate
- Hot days now (above 102°F)
- 7 days/yr
- Hot days in 30 yrs
- 15 days/yr
Wind risk 6/10 · Moderate
- Chance of severe wind over 30 yrs
- 27.0%
Air-quality risk 5/10 · Moderate
- Unhealthy air days now
- 6 days/yr
- Unhealthy air days in 30 yrs
- 8 days/yr
Risk factors via First Street. Map © Google.
Why this score? — see what drove the B- grade
The composite is a weighted blend of 9 inputs, each scored 0–100. Each bar is that input's sub-score; the figure is the points it added to the 100-point composite (weight × sub-score).
- Cash flow +29.2/30.0
- DSCR +10.0/10.0
- 1% rule +8.5/10.0
- ARV discount +7.5/15.0
- Livability +3.8/5.0
- Rent growth +3.7/5.0
- Condition / age +2.5/5.0
- Schools +0.7/10.0
- Appreciation +0.0/10.0
$200,000
🖨 Deal sheet (PDF) 📄 Offer letter ✓ Due diligence
Listing remarks
This spacious four-bedroom, two-bath home, located in the heart of South Trenton, offers both comfort and investment potential. Currently tenant-occupied on a month-to-month lease, it provides immediate rental income with the flexibility to transition to owner occupancy if desired. The generous layout works well for multi-generational living, home office setups, or continued rental use. Just minutes away, you can enjoy local attractions such as the Trenton Thunder Ballpark, River View Plaza, and the Cure Insurance Arena, providing year-round entertainment, sports, and dining options. A new central air unit is included with the purchase and needs to be installed. Water heater and central hea
Key facts
- Month to month lease
- Generous layout
- Home office setups
Tags
Property features AI
Finance
- Financial info: Fee simple ownership; Lease not in effect and lease not considered; No rent control
Exterior
- Parking: On-street parking
- Utilities: Public water; Public sewer; Natural gas service
- Home design: Detached structure; Average condition; Effective year of major renovation: 2020; Year built estimated
- Construction: Frame construction; Shingle roof; Permanent foundation; Above-grade structures
- Exterior features: Not in a federal flood zone; No tidal water on the property; No municipal trash service
Interior
- Bedrooms: Three bedrooms on the first upper level; One bedroom on the main level; Total of 4 bedrooms
- Bathrooms: Two full bathrooms (one on main level, one on first upper level)
- Heating & cooling: Forced air heating; Natural gas for heating, cooling fuel, and hot water
- Interior features: Drywall walls and ceilings; Not furnished; Smoking not allowed; Unfinished basement
- Laundry & utility: Washer/dryer hookup
Neighborhood map
What this means for you Summary
Snapshot
- This is a 4-bed/2.0-bath single-family listed at $200k.
Deal economics
- At list price, monthly cash flow is $694 ($8k/yr) — positive.
- The deal already cash-flows at list — no discount required.
- Meets the 1% rule at list price ($3k rent vs $200k).
- Recommended offer: $182k (9.0% below list) — sets the bar for market timing.
- Cap rate 10.5% vs local median 6.3% in Trenton — top-decile yield for the area; either an underpriced asset or a hidden risk that comps aren't pricing in. Stress-test before assuming the spread holds.
Location & tenants
- Location reads 76/100 on livability (#133 in NJ, #3,533 nationally) — a middle-class / working-renter tenant base. Strengths: amenities A+, commute A+, health & safety A+; Watch: schools F, crime F, employment F.
- Trenton Public School District (urban): math 2% / reading 16% proficiency, ranked #471 of 472 in NJ (top 100%) — low school quality limits family demand, transient renter base, plan for 1-2y turnover; 80% free/reduced lunch — lower-income household profile, screen leases tightly.
- Market conditions: Rents rising fast (+4.7%/yr); 84 active listings in the ZIP; 15 comparable units currently listed for rent nearby; rentals at typical pace (median 22d on market — plan ~3-4 weeks tenant-placement turnaround); 2,256 units permitted in Mercer County in 2024 (1,303 in 5+ unit buildings).
- At $2,697/mo this rent would consume 57% of the median local household income ($57k/yr) (locally 2147% of renters already pay >50% of income on rent) — very limited rent-growth headroom before tenants either downsize or default.
Forward outlook
- Local home prices are declining (-3.0%/yr); year-one equity from $1k of loan paydown is wiped out by about $6k of value loss. Plan a longer hold.
- Mercer County population projected at +4% by 2050 — modest demand growth; plan on rents tracking national, not racing it.
- At projected returns (-3.0% appreciation + 4.7% rent growth), your $56k cash investment doubles in ~7 years — after that, you're playing with house money.
Negotiation context
- It's been on market 120 days — a 9% lower offer ($182k) is reasonable based on typical stale-listing flexibility.
- 2 sale attempts; this cycle's ask has dropped $15k (7%) from the opening price — seller is motivated, your offer sets the floor, not the list.
- Current owner paid $18k; list at $200k implies a 1011% gain — meaningful room to come down on a strong offer.
Risks & watch-outs
- Watch-outs: built in 1887 — expect roof / HVAC / electrical / plumbing capex.
- Climate carrying-cost: major wind risk, 27% chance of damaging wind over 30y; extreme-heat days projected 7→15/yr by 2055 (HVAC capex compounding) — expect insurance premiums to compound above CPI over the hold.
Questions for the listing agent
- It's been on market 120 days. Have you received any prior offers? Is the seller open to a 9% concession, seller financing, or rate buy-down credit?
- Built in 1887 — when were the roof, HVAC, electrical panel, plumbing, and water heater last replaced?
- Why hasn't it sold? Are there any deal-killer items the seller is aware of (foundation, flood, title, zoning, code violations)?
- Is there a deadline driving the sale (1031 exchange, divorce, estate, relocation)? That informs how much negotiation room exists.
- Schools are F-rated, which usually means shorter tenancies and higher turnover. Who's the typical renter profile here, and what's been the actual vacancy rate?
- Crime grade is F in this area — have there been break-ins, vandalism, or insurance claims at this property in the last 3 years? What carrier currently insures it and at what premium?
- What's the average days-on-market for RENTAL listings here right now (not sales)? A rising rental-DOM trend means longer vacancies and softer asking-rent achievability than the comps imply.
- What's the recent tenant-quality profile in this submarket — average credit score on applications, eviction rate, late-payment / NSF rate, and stable-employment percentage? A property-management company in the area should have these aggregated.
- How much new for-sale + rental construction is in the pipeline within 1–3 miles? Heavy new supply typically softens prices + rents 12–24 months out; constrained supply supports both.
Investment metrics
- 1% rule
- 1.35% ✓
- Cap rate
- 10.46%
- Cash-on-cash
- 14.87%
- DSCR
- 1.66
- GRM
- 6.2
CMA / ARV
- ARV (on-the-fly)
- $404,584
- Comps found
- 6
Show comp detail 6 sales within ~0.75 mi
| Address | Dist | Beds/Ba | Sqft | Sold | Price | $/sf | Match |
|---|---|---|---|---|---|---|---|
| 209 S Delmorr Ave | 0.52mi | 3/1.5 (-1) | 1,792 (-9%) | 7mo | $385,000 | $215 | 48 |
| 95 Park Ave | 0.69mi | 3/2.0 (-1) | 2,160 (+10%) | 2mo | $445,000 | $206 | 45 |
| 1065 S Clinton Ave | 0.75mi | 4/2.0 | 2,124 (+8%) | 11mo | $300,000 | $141 | 42 |
| 617 Beatty St | 0.58mi | 5/2.0 (+1) | 1,724 (-12%) | 6mo | $240,000 | $139 | 42 |
| 80 Delaware Ave | 0.67mi | 4/2.0 | 1,717 (-13%) | 9mo | $360,000 | $210 | 40 |
| 114 Grove St | 0.62mi | 3/2.0 (-1) | 1,680 (-14%) | 18mo | $325,000 | $193 | 27 |
Match score weights: distance 35% · size 25% · config 20% · recency 20%. Top-matched comps best support the ARV.
Projected returns pro-forma
-3.0% appreciation · 4.71% rent growth · sell at horizon
- IRR
- 7.4%
- Equity multiple
- 1.30×
- Total profit
- $16,587
- Equity at exit
- $29,821
- IRR
- 18.2%
- Equity multiple
- 2.64×
- Total profit
- $91,715
- Equity at exit
- $17,292
Cash invested: $56,000 (down + closing). Projections, not guarantees.
Landlord ↔ Tenant lean methodology
- Overall (STATE)
- 21 Tenant-Leaning
- State New Jersey
- 21 Tenant-Leaning · D+6
- County
- — inherits STATE
- City
- — inherits STATE
ZIP-level market 08611
- Rents YoY
- 4.7%
- Active inventory
- 84
- Price-to-rent
- 6.2×
Monthly cashflow live
- Estimated rent
- $2,697 high interval (Pro) →
- Mortgage (P&I)
- −$1,049
- Tax from tax record
- −$304 /mo · $3,652/yr
- Insurance
- −$83
- HOA
- −$0
- Vacancy / Maint / Mgmt
- −$566
- Net cashflow
- $694
Break-even live
Sensitivity live
| Price | -10% $807 | -5% $751 | +0% $694 | +5% $637 | +10% $581 |
|---|---|---|---|---|---|
| Rent | -10% $481 | -5% $587 | +0% $694 | +5% $801 | +10% $907 |
| Rate | -1.0pp $795 | -0.5pp $745 | base $694 | +0.5pp $642 | +1.0pp $589 |
UW: 25.0% down · 7.5% · 30yr · 1.5% tax · 5.0% vac · 8.0% maint · 8.0% mgmt
Financing live
Cash to close
- Down payment
- $50,000
- Closing costs
- $6,000
- Reserves months
- —
- Total cash needed
- —
Loan-product check · same deal, 3 products live
Conventional
25% down · 7.5% · 30yr
- Down + closing
- —
- Monthly P&I
- —
- Monthly cashflow
- —
- DSCR
- —
- Eligible?
- —
Personal DTI + credit; lowest rate.
DSCR
20% down · 8.5% · 30yr
- Down + closing
- —
- Monthly P&I
- —
- Monthly cashflow
- —
- DSCR
- —
- Eligible?
- —
No personal income docs; deal must DSCR.
Hard money
10% down · 12.0% · 12mo
- Down + closing
- —
- Monthly P&I
- —
- Monthly cashflow
- —
- DSCR
- —
- Eligible?
- —
Short-term bridge; refi at stabilization.
Rent comps 15 comps
| Address | Beds | Baths | Sqft | Rent | $/sqft | DOM | Units | Dist |
|---|---|---|---|---|---|---|---|---|
| 5 Rafting Way Trenton, NJ | 3.0 | 2.5 | 1908 | $2,550 | $1.34 | 44d | 1 | 0.70mi |
| 117 Park Ave Morrisville, PA | 3.0 | 2.0 | 1396 | $3,200 | $2.29 | 13d | 1 | 0.72mi |
| 244 Jersey St Trenton, NJ | 3.0 | 1.5 | 1368 | $2,300 | $1.68 | 14d | 1 | 0.75mi |
| 1103 Division St Trenton, NJ | 4.0 | 1.0 | 1296 | $2,000 | $1.54 | 21d | 1 | 0.84mi |
| 130 Harper Ave Morrisville, PA | 3.0 | 2.5 | 1276 | $3,500 | $2.74 | 13d | 1 | 0.98mi |
| 233 Virginia Ave Trenton, NJ | 3.0 | 1.0 | 1302 | $2,500 | $1.92 | 13d | 1 | 1.03mi |
| 635 Chambers St Trenton, NJ | 4.0 | 2.0 | 1312 | $2,500 | $1.91 | 14d | 1 | 1.05mi |
| 34 E Hendrickson Ave Morrisville, PA | 3.0 | 1.0 | 1360 | $2,650 | $1.95 | 44d | 1 | 1.13mi |
| 234 Walnut Ave Trenton, NJ | 4.0 | 1.0 | 1480 | $2,200 | $1.49 | 21d | 1 | 1.19mi |
| 21 Bellevue Ave Trenton, NJ | 3.0 | 2.0 | 1740 | $2,400 | $1.38 | 44d | 1 | 1.20mi |
| 1049 Genesee St Trenton, NJ | 3.0 | 1.0 | 1270 | $2,300 | $1.81 | 21d | 1 | 1.22mi |
| 73 Bellevue Ave Trenton, NJ | 4.0 | 2.0 | 1950 | $2,400 | $1.23 | 14d | 1 | 1.26mi |
| 234 Howell St Trenton, NJ | 3.0 | 3.0 | 1656 | $3,600 | $2.17 | 21d | 1 | 1.26mi |
| 311 Calhoun St Trenton, NJ | 4.0 | 1.0 | 1516 | $2,400 | $1.58 | 44d | 1 | 1.30mi |
| 239 Ardmore Ave Trenton, NJ | 4.0 | 2.0 | 1665 | $2,750 | $1.65 | 21d | 1 | 1.41mi |
Listing history 21 events
-
2026-06-18days on market $200,000 Active 120 DOM
-
2026-06-17days on market $200,000 Active 119 DOM
-
2026-06-16days on market $200,000 Active 118 DOM
-
2026-06-15days on market $200,000 Active 117 DOM
-
2026-06-14days on market $200,000 Active 115 DOM
-
2026-06-10days on market $200,000 Active 112 DOM
-
2026-06-09days on market $200,000 Active 111 DOM
-
2026-06-08days on market $200,000 Active 110 DOM
-
2026-06-07days on market $200,000 Active 109 DOM
-
2026-06-03days on market $200,000 Active 105 DOM
-
2026-06-02days on market $200,000 Active 104 DOM
-
2026-06-01days on market $200,000 Active 103 DOM
-
2026-05-31days on market $200,000 Active 102 DOM
-
2026-05-30days on market $200,000 Active 101 DOM
-
2026-05-04price $200,000
-
2026-02-18$215,000 Active
-
2025-12-31historical
-
2025-11-22price $215,000
-
2025-10-26price $230,000
-
2025-08-08$250,000 Active
-
1993-03-03soldstatus $18,000
ⓘ Source: listings_history table (triggers on properties + properties_extension) + one-shot
backfill from property_details.listing_events for pre-trigger history.
Tax reassessment forecast NJ · Partial reset (capped growth)
- Current annual tax
- $3,652 · $304/mo
- Projected year-2 tax
- $4,316 · $360/mo
- Expected delta
- +$664/yr (+$55/mo · 18.2%)
ⓘ Screening estimate from a state-policy table — verify with the county assessor before closing.
Climate risk First Street
- Flood 3/10 Moderate FEMA zone X (unshaded) · 13% chance over 30 yrs
- Wildfire 1/10 Low
- Heat 6/10 Major 7 d/yr ≥102°F today · 15 d/yr by 30 yrs out
- Wind 6/10 Major 27% chance of damaging wind over 30 yrs
- Air quality 5/10 Major 6 unhealthy d/yr today · 8 by 30 yrs out
Nearby sold comps map
Loading sold comps map…
Walkable amenities ~0.75 mi
Loading nearby amenities…
Taxation est. · year 1
- Rental income
- $32,362
- − Mortgage interest
- −$11,203
- − Property taxes
- −$3,652
- − Insurance
- −$1,000
- − Repairs & maintenance
- −$2,589
- − Management
- −$2,589
- − Depreciation
- −$5,818
- Taxable income
- $5,511
- Est. tax owed @ 24.0%
- −$1,323
- After-tax cash flow
- $7,006/yr
For passive investors: Depreciation is non-cash, so a rental often shows a tax loss while cash-flowing — sheltering income. Rental losses are passive: they offset passive income freely, and up to $25,000/yr can offset ordinary (W-2) income if you actively participate and your MAGI is under $100k (phasing out to $0 by $150k); unused losses carry forward. On sale, claimed depreciation is recaptured at up to 25%, and gains may owe capital-gains tax (a 1031 exchange can defer both). Figures are a year-1 estimate at your 24.0% rate — not tax advice; consult a CPA.
Schools (NCES district)
- District
- Trenton Public School District
- NCES district ID
- 3416290
- Math proficiency
- 2% ▼ -8.00%
- Reading proficiency
- 16% ▼ -4.00%
- Median HH income
- $35,078
- Composite
- 7.31/100
- National rank
- #9956
- State rank
- #471 of 472 in NJ
Livability — Trenton
- Score
- 76/100
- State rank
- #133
- US rank
- #3533
Category grades
Schools grade is shown separately in the Schools card above.
Census & demographics
- Census place
- Trenton, NJ
- County
- Mercer County · 327,655 people
- City population
- 177,819
- Metro
- Trenton-Princeton, NJ
- Population (ZIP)
- 31,995
- Household income
- $56,788
- Rent vs Own
- Severe rent burden
- 2147.0
Population outlook (Mercer County) Hauer SSP2
- Today (2025)
- 381,395 people
- By 2030
- 384,640 · +0.9%
- By 2040
- 391,431 · +2.6%
- By 2050
- 397,845 · +4.3%
- By 2075
- 417,281 · +9.4%
- By 2100
- 420,327 · +10.2%
Race, ethnicity, and origin ACS 2023
- Neighborhood character
- Diverse neighborhood (Simpson 0.56)
- Race & ethnicity
- Hispanic / Latino 62% Black 20% Two or more races 18% White 14% Native American 4%
- Hispanic origin (detail)
- Mexican 2% Puerto Rican 12% Dominican 8%
- Common ancestry
- Romanian 2% Swiss 1% Hispanic 1%
- Foreign-born
- 37% · Canada, Jamaica, Guatemala
- Languages at home
- 41% English-only · Spanish 57% French/Haitian/Cajun 2%
Political lean MEDSL · Mercer
- 2024 margin
- Solid D (+33.9) · D 65.9% · R 32.0% · Other 2.1%
- 2008→2024 swing
- -2.2pp toward R · 2008: 36.1pp · 2024: 33.9pp
- All cycles
- 2024: D+33.9 2020: D+40.0 2016: D+36.2 2012: D+36.8 2008: D+36.1
Not yet ingested
- Civics
- —
Market trends
- HPI YoY
- ▼ -267.62%
- Current HPI
- 276.5427
- Rent YoY
- ▲ 4.71%
- Metro
- Trenton-Princeton, NJ
- State GDP YoY
- ▲ 2.05%
- F500 in state
- 34
Industry mix (Fortune 500 HQ in NJ)
| Industry | F500 HQs | Revenue |
|---|---|---|
| Consumer Goods | 3 | $31B |
|
||
| Pharmaceuticals | 2 | $153B |
|
||
| Technology | 2 | $21B |
|
||
| Insurance | 2 | $20B |
|
||
| Healthcare | 2 | $19B |
|
||
| Financial Services | 1 | $70B |
|
||
Price history
+1011.1% since first listed7 events — show timeline
- 2026-05-04 Price Changed $200,000 BRIGHT MLS
- 2026-02-18 Listed $215,000 BRIGHT MLS
- 2025-12-31 Listing Removed — BRIGHT MLS
- 2025-11-22 Price Changed $215,000 BRIGHT MLS
- 2025-10-26 Price Changed $230,000 BRIGHT MLS
- 2025-08-08 Listed $250,000 BRIGHT MLS
- 1993-03-03 Sold (Public Records) $18,000 Public Records
Property tax history
+1.7%/yrLatest (2025): $3,652 · +1.5% YoY. Source: county tax records.
Cash-flow waterfall
monthlySold comps — $/sqft
last 12 mo · ≤1 miLoading sold comps…